sinTrend_v1
Download script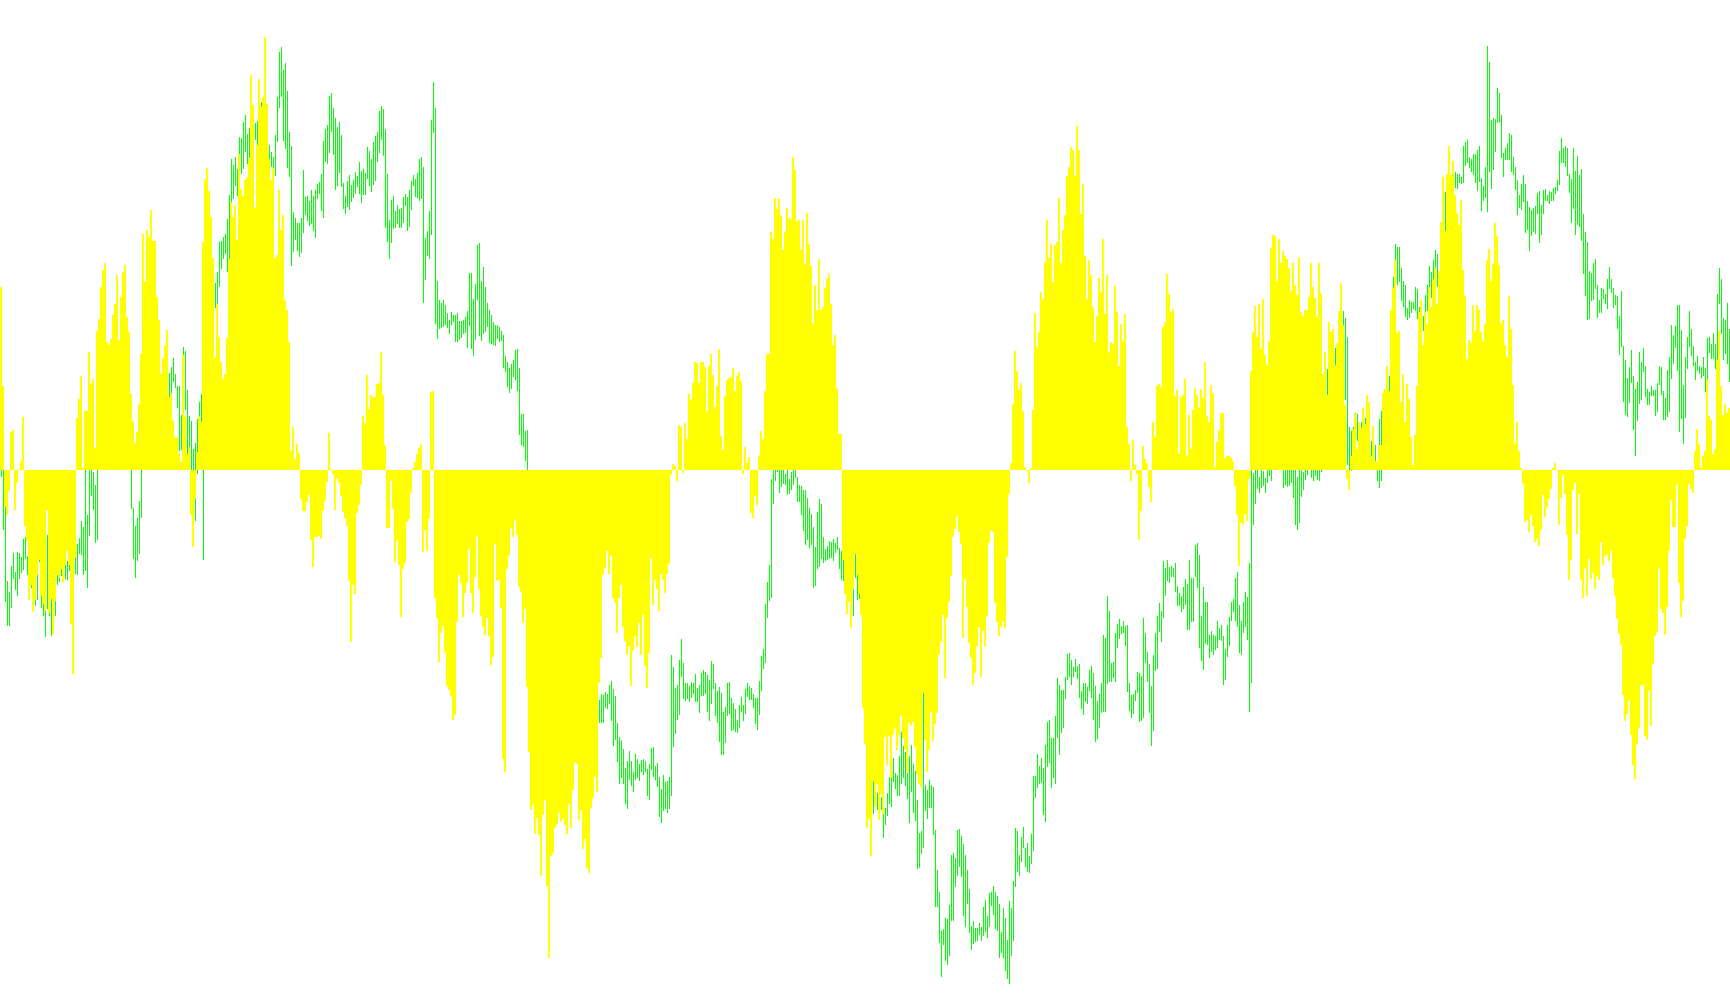
This tool is a custom technical indicator designed for the MetaTrader platform to help traders visualize market trends through a specialized histogram. Unlike standard indicators that might rely on simple moving averages, this script uses a mathematical approach to identify price cycles and momentum.
Core Functionality
Dynamic Timeframe Adaptation One of the primary features of this script is its "intelligent" awareness of different timeframes. It automatically detects which chart you are currently viewing (e.g., 1-minute, hourly, daily, or monthly) and adjusts its internal calculations accordingly. For example, it uses a larger look-back period for shorter timeframes to filter out noise and a smaller look-back period for longer timeframes to capture broader movements. This ensures that the indicator remains relevant and readable regardless of your trading style.
Mathematical Trend Analysis The logic behind the visual output is based on a trigonometric calculation. Specifically, it measures the difference between the current closing price and the closing price from a set number of bars ago (the "period"). It then applies a sine wave function to this difference.
By doing this, the indicator:
- Normalizes Price Movement: It converts raw price changes into a consistent wave pattern.
- Identifies Momentum: It helps visualize whether the current trend is gaining strength or losing steam relative to its historical cycle.
- Provides Visual Clarity: The result is displayed as a yellow histogram in a separate window, allowing you to see "waves" of market activity more clearly than by looking at price bars alone.
How it Works for the User
When you load this indicator, you don't need to manually change settings for different charts; the script handles the heavy lifting. It calculates the relationship between current prices and historical data, processes that data through a sine function, and renders it as a histogram. Traders can use this visual representation to identify potential cycle turns and understand the underlying rhythm of the market trend.
/*-----------------------------+
|			       |
| Shared by www.Aptrafx.com    |
|			       |
+------------------------------*/

//+------------------------------------------------------------------+
//|                                                     TrendOSC.mq4 |
//|                      Copyright © 2005, MetaQuotes Software Corp. |
//|                                        http://www.metaquotes.net |
//+------------------------------------------------------------------+
#property copyright "Copyright © 2005, DVYU."
#property link      "http://www.DVYU.ox"
#property indicator_buffers 1
#property indicator_color1 Yellow
#property indicator_separate_window
//#property indicator_minimum -1
//#property indicator_maximum 1
//ïàðàìåòðû
int g_period;
//.extern int dBar=3;
//Îáúÿâëåíèå ãëîáàëüíûõ ïåðåìåííûõ
double z_buffer[];
//double SpeedTrend1;
double dBar;
int x;
//+------------------------------------------------------------------+
//| Custom indicator initialization function                         |
//+------------------------------------------------------------------+
int init()
  {

  SetIndexStyle(0, DRAW_HISTOGRAM, EMPTY, 2, Yellow);
  SetIndexBuffer(0,z_buffer);
  IndicatorDigits(4);

  int x=Period();
  //string P;
  //Äëÿ ïîäáîðà ñìåùåíèÿ (shift) èíäèêàòîðà èçìåíèòå çíà÷åíèå g_period äëÿ íóæíîãî ïåðèîäà ãðàôèêà
  switch (x)
  {
  case 1:g_period=110;
  Comment("Ìèíóòíûé ãðàôèê","   ","Ñìåùåíèå",g_period);
  break;
  case 5:g_period=90;
  Comment("Ïÿòèìèíóòíûé ãðàôèê","   ","Ñìåùåíèå",g_period);
   break;
  case 15:g_period=60;
  Comment("Ïÿòíàäöàòèìèíóòíûé ãðàôèê","   ","Ñìåùåíèå",g_period);
   break;
  case 30:g_period=42;
  Comment("Ïîëó÷àñîâîé ãðàôèê","   ","Ñìåùåíèå",g_period);
   break;
  case 60:g_period=36;
  Comment("×àñîâîé ãðàôèê","   ","Ñìåùåíèå",g_period);
   break;
  case 240:g_period=24;
  Comment("×åòûðåõ÷àñîâîé ãðàôèê","   ","Ñìåùåíèå",g_period);
   break;
  case 1440:g_period=18;
  Comment("Äíåâíîé ãðàôèê","   ","Ñìåùåíèå",g_period);
   break;
  case 10080:g_period=12;
  Comment("Íåäåëüíûé  ãðàôèê","   ","Ñìåùåíèå",g_period);
   break;
  case 43200:g_period=3;
  Comment("Ìåñÿ÷íûé ãðàôèê","   ","Ñìåùåíèå",g_period);
   break;
  }
   return(0);
  }
//+------------------------------------------------------------------+
//| Custor indicator deinitialization function                       |
//+------------------------------------------------------------------+
int deinit()
  {
//----

//----
  return(0);
  }
//+------------------------------------------------------------------+
//| Custom indicator iteration function                              |
//+------------------------------------------------------------------+
int start()
  {
  int limit = 0;
  int z;
int counted_bars=IndicatorCounted();
      if(counted_bars<0) return(-1);
          if(counted_bars>0) counted_bars--;
              limit=Bars-counted_bars;

   for  (int i=0; i<limit; i++)
{

 z_buffer[i]=MathSin((Close[i]-Close[i+g_period])/g_period);


 }


//----

//----
   return(0);
  }
//+------------------------------------------------------------------+
Comments