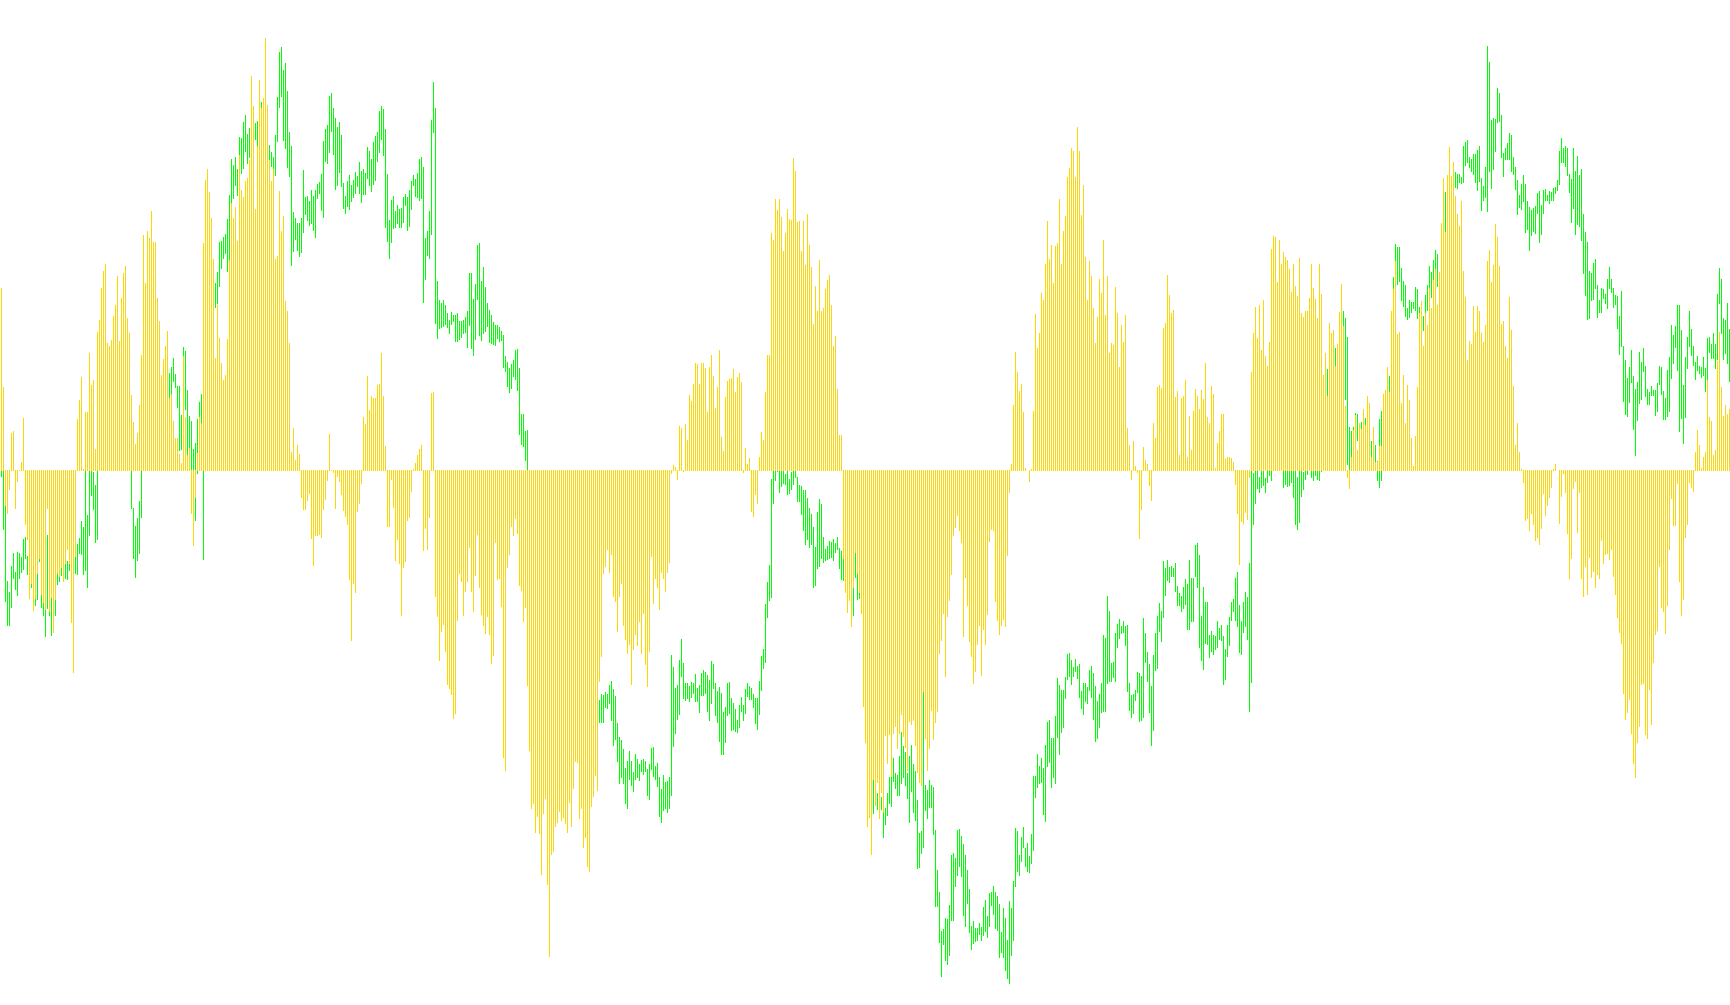
This indicator is designed to help traders visualize market trends by analyzing the relationship between current price movements and historical price points. Instead of simply looking at where the price is now, it calculates a mathematical "wave" to smooth out market noise and highlight underlying momentum.
Core Logic Overview
The tool works by calculating the difference in price between two specific points in time: the current closing price and a historical closing price from a predetermined number of bars back. By comparing these two points, the script determines how much the price has moved over a specific window of time.
This movement is then processed through a sine wave calculation. In financial terms, this means the tool treats price action as a rhythmic cycle rather than just a jagged line. The result is plotted as a yellow histogram in a separate window below your main chart.
Dynamic Adaptation
One of the key features of this script is its ability to automatically adjust its sensitivity based on the timeframe you are viewing. It includes a built-in "logic switch" that detects your current chart period (e.g., 1-minute, 15-minute, 1-hour, or daily charts) and automatically selects the optimal historical lookback period for that specific timeframe.
For example:
- On shorter timeframes: The indicator looks further back into history to capture broader trends.
- On longer timeframes: The indicator narrows its focus to more recent data to capture immediate momentum.
How to Interpret the Visuals
The resulting histogram provides a visual representation of trend strength:
- When the histogram values move significantly away from the zero line, it indicates a stronger trend in either direction.
- The use of the sine function helps to filter out "market noise," making it easier for traders to identify when a trend is gaining momentum versus when the market is simply fluctuating sideways.
By automatically adjusting its settings to match your timeframe, the tool aims to provide a consistent visual experience across different trading styles, helping you see the "flow" of the market more clearly.
//+------------------------------------------------------------------+
//|   sinTrend                                          TrendOSC.mq4 |
//|                      Copyright © 2005, MetaQuotes Software Corp. |
//|                                        http://www.metaquotes.net |
//+------------------------------------------------------------------+
#property copyright "Copyright © 2005, DVYU."
#property link      "http://www.DVYU.ox"
#property indicator_buffers 1
#property indicator_color1 Yellow
#property indicator_separate_window
#property indicator_width1 2
//#property indicator_minimum -1
//#property indicator_maximum 1
//ïàðàìåòðû
int g_period;
//Îáúÿâëåíèå ãëîáàëüíûõ ïåðåìåííûõ
double z_buffer[];
//double SpeedTrend1;
double dBar;
int x;
//+------------------------------------------------------------------+
//| Custom indicator initialization function                         |
//+------------------------------------------------------------------+
int init()
  {
   SetIndexStyle(0, DRAW_HISTOGRAM);
   SetIndexBuffer(0,z_buffer);
   IndicatorDigits(4);
   int x=Period();
   //Äëÿ ïîäáîðà ñìåùåíèÿ (shift) èíäèêàòîðà èçìåíèòå çíà÷åíèå g_period äëÿ íóæíîãî ïåðèîäà ãðàôèêà
   switch(x)
     {
      case 1:g_period=110;
         Comment(g_period);
         break;
      case 5:g_period=90;
         Comment("g_period",g_period);
         break;
      case 15:g_period=60;
         Comment(g_period);
         break;
      case 30:g_period=42;
         Comment(g_period);
         break;
      case 60:g_period=36;
         Comment("g_period  ",g_period);
         break;
      case 240:g_period=24;
         Comment("g_period  ",g_period);
         break;
      case 1440:g_period=18;
         Comment("g_period  ",g_period);
         break;
      case 10080:g_period=12;
         Comment("g_period  ",g_period);
         break;
      case 43200:g_period=3;
         Comment(g_period);
         break;
     }
   return(0);
  }
//+------------------------------------------------------------------+
//| Custor indicator deinitialization function                       |
//+------------------------------------------------------------------+
int deinit()
  {
//----
//----
   return(0);
  }
//+------------------------------------------------------------------+
//| Custom indicator iteration function                              |
//+------------------------------------------------------------------+
int start()
  {
   int limit=0;
   int z;
   int counted_bars=IndicatorCounted();
   if(counted_bars<0) return(-1);
   if(counted_bars>0) counted_bars--;
   limit=Bars-counted_bars;
   for(int i=0; i<limit; i++)
     {
      z_buffer[i]=MathSin((Close[i]-Close[i+g_period])/g_period);
     }
//----
//----
   return(0);
  }
//+------------------------------------------------------------------+
Comments