Skyscraper_v1
Download script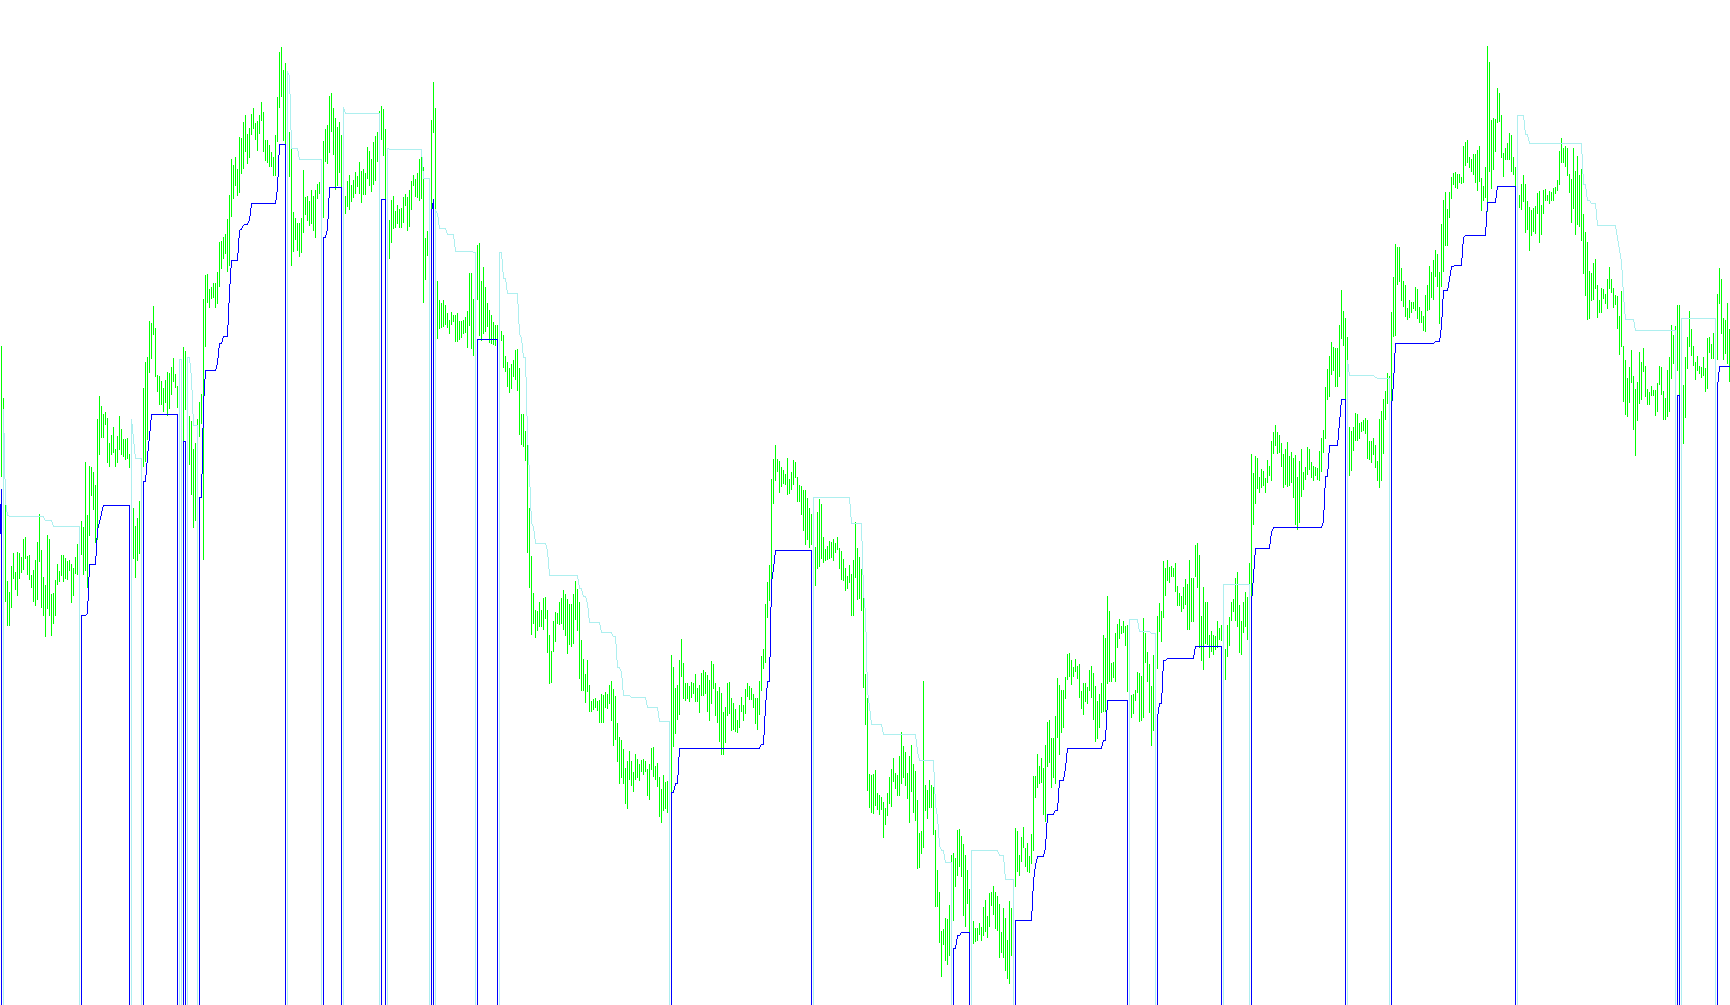
This script, known as the StepMA, is a specialized technical analysis tool designed to identify market trends by creating a "staircase" effect on your price charts. Instead of following every minor fluctuation in price, it filters out market noise to show you the broader direction of the trend using distinct steps.
Core Logic and Behavior
1. Defining the Movement (The Step) The indicator works by determining how far the price should "move" before a new step is created. It calculates this distance based on market volatility. It looks at the typical range of price movement (Highs to Lows) over a specific period to ensure that the steps are proportional to the current market environment—making it adaptable to both calm and volatile markets.
2. Establishing Trend Direction The script constantly monitors the closing price in relation to these calculated steps:
- Upward Trend: If the price breaks above a certain upper threshold, the indicator recognizes an upward move and builds a "staircase" moving up.
- Downward Trend: If the price drops below a specific lower threshold, it switches to a downward trend, creating a descending staircase.
3. Creating the "Staircase" Effect What makes this unique is its "sticky" logic. Once a trend is established, the indicator creates a flat line (a step). It will only move to a new level if the price pushes far enough to overcome the current step's boundary. This prevents the indicator from reacting to small price wobbles, effectively smoothing out the visual representation of the market.
4. Visual Feedback The script provides clear visual cues on the chart:
- Trend Lines: It draws the actual path of these steps so you can see the current "floor" or "ceiling" of the price action.
- Color Coding: It can highlight the trend visually (e.g., changing colors when the trend flips from up to down).
- Sensitivity Adjustments: You can customize how "sensitive" the indicator is. By adjusting the sensitivity factor, you can decide whether you want the staircase to react quickly to new price information or remain steady until a very significant move occurs.
Summary for the User
Think of this tool as a filter that ignores the "jitter" of the market. It tells you: "The price is currently moving in this direction, and it won't be considered a change in trend until it moves this specific distance." It helps traders stay on the right side of a move by clearly defining the boundaries of current price momentum.
//+------------------------------------------------------------------+
//|                                                  StepMA_v6.4.mq4 |
//|                                Copyright © 2006, TrendLaboratory |
//|            http://finance.groups.yahoo.com/group/TrendLaboratory |
//|                                       E-mail: igorad2004@list.ru |
//+------------------------------------------------------------------+
#property copyright "Copyright © 2006, TrendLaboratory"
#property link      "http://finance.groups.yahoo.com/group/TrendLaboratory"
//----
#property indicator_chart_window
#property indicator_buffers 3
#property indicator_color1 LightBlue
#property indicator_color2 Blue
#property indicator_color3 Red
//---- input parameters
extern int     Length=10;      // ATR Length
extern double  Kv=0.9;         // Sensivity Factor
extern int     StepSize=0;     // Constant Step Size (if need)
extern int     Advance=0;      // Offset
extern double  Percentage=0;   // Up/down moving percentage
extern bool    HighLow=false;  // High/Low Mode Switch (more sensitive)
extern bool    Color=true;    // Color Mode Switch
extern int     BarsNumber=0;   // Counted bars
//---- indicator buffers
double LineBuffer[];
double UpBuffer[];
double DnBuffer[];
double smin[];
double smax[];
//+------------------------------------------------------------------+
//| Custom indicator initialization function                         |
//+------------------------------------------------------------------+
  int init()
  {
   string short_name;
//---- indicator line
   IndicatorBuffers(5);
   SetIndexStyle(0,DRAW_NONE,STYLE_SOLID,1);
   SetIndexStyle(1,DRAW_LINE);
   SetIndexStyle(2,DRAW_LINE);
   SetIndexArrow(1,159);
   SetIndexArrow(2,159);
   SetIndexShift(0,Advance);
   SetIndexShift(1,Advance);
   SetIndexShift(2,Advance);
   SetIndexBuffer(0,LineBuffer);
   SetIndexBuffer(1,UpBuffer);
   SetIndexBuffer(2,DnBuffer);
   SetIndexBuffer(3,smin);
   SetIndexBuffer(4,smax);
   IndicatorDigits(MarketInfo(Symbol(),MODE_DIGITS));
//---- name for DataWindow and indicator subwindow label
   short_name="Skyscraper("+StepSize+","+Kv+","+StepSize+")";
   IndicatorShortName(short_name);
   SetIndexLabel(0,short_name);
   SetIndexLabel(1,"UpTrend");
   SetIndexLabel(2,"DownTrend");
//----
   SetIndexEmptyValue(0,0.0);
   SetIndexEmptyValue(1,0.0);
   SetIndexEmptyValue(2,0.0);
//----
   SetIndexDrawBegin(0,Length);
   SetIndexDrawBegin(1,Length);
   SetIndexDrawBegin(2,Length);
//----
   return(0);
  }
//+------------------------------------------------------------------+
//| StepMA_v6                                                         |
//+------------------------------------------------------------------+
int start()
  {
   int i,shift,trend,Step;
   double smin0,smax0,smin1,smax1,ATRmin=1000000,ATRmax=-1000000,AvgRange,ATR0;
//----
   if(BarsNumber>0) int Nbars=BarsNumber; else Nbars=Bars;
//----
   for(shift=Nbars-1-Length;shift>=0;shift--)
     {
      if(StepSize==0)
        {
         AvgRange=0;
         for(i=Length;i>=1;i--)
           {
            AvgRange+= (High[shift+i]-Low[shift+i]);
           }
         ATR0=AvgRange/Length;
         if (shift>0)
           {
            if (ATR0>ATRmax) ATRmax=ATR0;
            if (ATR0<ATRmin) ATRmin=ATR0;
           }
         Step=0.5*Kv*(ATRmax+ATRmin)/Point;
        }
      else
      {Step=Kv*StepSize;}
//----
      Comment (" WARP_SPEED to boldly go were no men has gon before= ", Step);
      if (HighLow)
        {
         smax[shift]=Low[shift]+2.0*Step*Point;
         smin[shift]=High[shift]-2.0*Step*Point;
        }
      else
        {
         smax[shift]=Close[shift]+2.0*Step*Point;
         smin[shift]=Close[shift]-2.0*Step*Point;
        }
      if (Close[shift]>smax[shift+1])  trend=1;
      if (Close[shift]<smin[shift+1])  trend=-1;
      if(trend>0)
        {
         if(smin[shift]<smin[shift+1]) smin[shift]=smin[shift+1];
         double Line=smin[shift]+Step*Point;
         if(Color) {UpBuffer[shift]=smin[shift];DnBuffer[shift]=-1.0;}
        }
      else
        {
         if(smax[shift]>smax[shift+1]) smax[shift]=smax[shift+1];
         Line=smax[shift]-Step*Point;
         if(Color) {DnBuffer[shift]=smax[shift];UpBuffer[shift]=-1.0;}
        }
      LineBuffer[shift]=Line+Percentage/100.0*Step*Point;
     }
   return(0);
  }
//+------------------------------------------------------------------+
Comments