Slope Direction Line Alert_002
Download script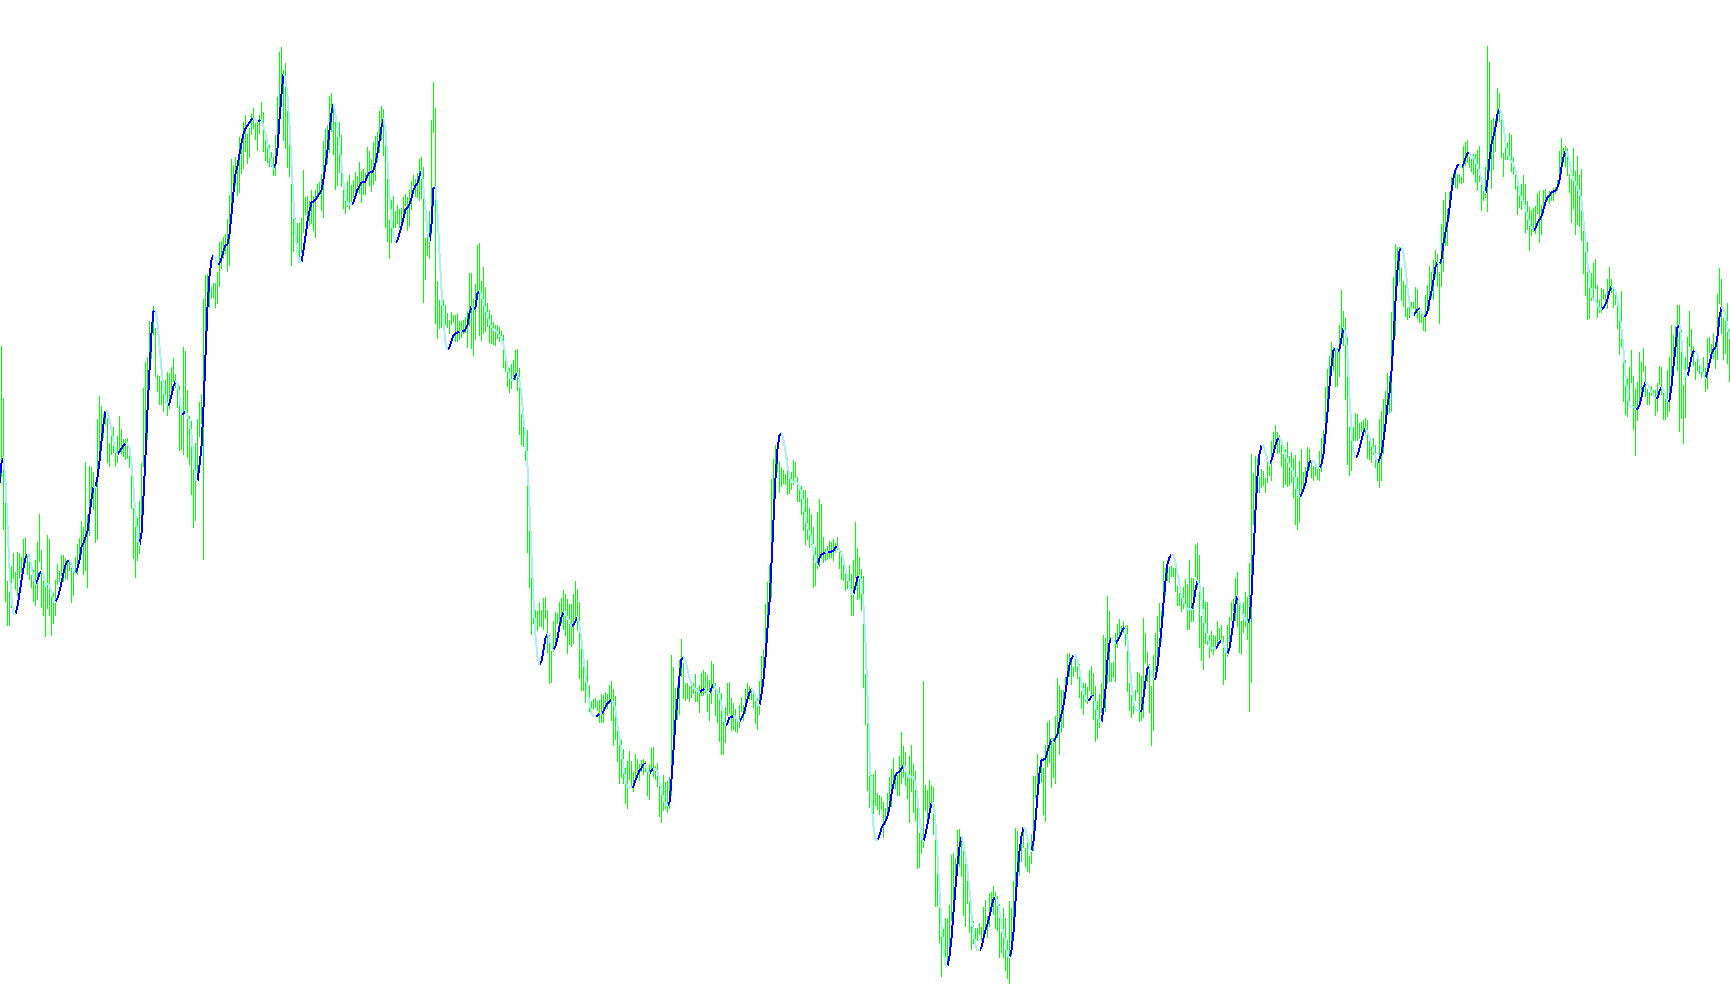
Overview
This script is a specialized technical analysis tool designed to identify and visualize market trends on a trading chart. It focuses on the "Slope Direction" of price movements, filtering out minor market noise to help traders determine whether the current momentum is shifting toward an upward or downward trajectory.
Core Logic and Functionality
1. Trend Smoothing and Calculation The tool begins by processing raw price data through a multi-layered smoothing technique. Instead of looking at raw prices directly—which can be erratic—it uses weighted moving averages to calculate the "velocity" of the market. By comparing these different moving average periods against one another, the script creates a secondary mathematical value that represents the underlying momentum of the asset.
2. Directional Mapping Once the momentum is calculated, the script evaluates the "slope" of this data. It looks at the rate of change between consecutive points:
- If the slope is increasing, it identifies an Uptrend.
- If the slope is decreasing, it identifies a Downtrend.
3. Visual Representation The indicator provides clear visual feedback on your chart by plotting two distinct lines:
- One line tracks the movement during active uptrends (colored to distinguish from the background).
- A separate line tracks movement during active downtrends. This allows you to see exactly when the tool switches its "bias" from one direction to another, providing a clear visual break between bullish and bearish phases.
4. Automated Alerts and Notifications Beyond just visual mapping, the script features a proactive notification system. It is programmed to detect the exact moment the trend flips (e.g., moving from an uptrend to a downtrend). When these specific "crossover" points occur at the start of a new price candle, the tool can:
- Trigger an audible alert sound within your trading platform.
- Generate a pop-up notification on your screen.
- Send an email notification to your registered address, providing the specific price details (Ask/Bid) and the time of the trend shift.
Summary for the Trader
Essentially, this tool acts as a sophisticated "momentum filter." It smooths out the chaos of the market to reveal the primary direction of travel. By identifying where the slope changes from positive to negative (or vice versa), it provides you with objective signals on potential trend reversals, accompanied by real-time alerts so you don't have to watch the charts constantly.
//+------------------------------------------------------------------+
//| HMA.mq4
//| Copyright © 2006 WizardSerg <wizardserg@mail.ru>, ?? ??????? ForexMagazine #104
//| wizardserg@mail.ru
//| Revised by IgorAD,igorad2003@yahoo.co.uk |
//| Personalized by iGoR AKA FXiGoR for the Trend Slope Trading method (T_S_T)
//| Link:
//| contact: thefuturemaster@hotmail.com
//+------------------------------------------------------------------+
#property copyright "MT4 release WizardSerg <wizardserg@mail.ru>, ?? ??????? ForexMagazine #104"
#property link      "wizardserg@mail.ru"

#property indicator_chart_window
#property indicator_buffers 3
#property indicator_color2 Yellow
#property indicator_color3 Blue
#property indicator_color1 Orange
#property indicator_width1 1
#property indicator_width2 1
#property indicator_width3 1

//---- input parameters
extern int       period=12;
extern int       method=3;                         // MODE_SMA
extern int       price=0;                          // PRICE_CLOSE
extern int       EmailON=1;                        // 0 = false    1 = true
extern int       SoundON=1;                        // 0 = false    1 = true
//---- buffers
double Uptrend[];
double Dntrend[];
double ExtMapBuffer[];
double buff[];


//+------------------------------------------------------------------+
//| Custom indicator initialization function                         |
//+------------------------------------------------------------------+
int init()
{
    IndicatorBuffers(3);
    SetIndexBuffer(1, Uptrend);
    //ArraySetAsSeries(Uptrend, true);
    SetIndexBuffer(2, Dntrend);
    //ArraySetAsSeries(Dntrend, true);
    //SetIndexBuffer(2, ExtMapBuffer);
    //ArraySetAsSeries(Uptrend, true);
    SetIndexBuffer(0, ExtMapBuffer);
    ArraySetAsSeries(ExtMapBuffer, true);

    SetIndexStyle(0,DRAW_LINE,STYLE_SOLID,2);
    SetIndexStyle(1,DRAW_LINE,STYLE_SOLID,2);
    SetIndexStyle(2,DRAW_LINE,STYLE_SOLID,2);

    IndicatorShortName("Slope Direction Line("+period+")");
    return(0);
}

//+------------------------------------------------------------------+
//| Custor indicator deinitialization function                       |
//+------------------------------------------------------------------+
int deinit()
{
    // ???? ????? ?????? ??????
    return(0);
}

//+------------------------------------------------------------------+
//| ?????????? ???????                                               |
//+------------------------------------------------------------------+
double WMA(int x, int p)
{
    return(iMA(NULL, 0, p, 0, method, price, x));
}

//+------------------------------------------------------------------+
//| Custom indicator iteration function                              |
//+------------------------------------------------------------------+
int start()
{
    int counted_bars = IndicatorCounted();

    if(counted_bars < 0)
        return(-1);

    int x = 0;
    int p = MathSqrt(period);
    int e = Bars - counted_bars + period + 1;

    double vect[], trend[];

    if(e > Bars)
        e = Bars;

    ArrayResize(vect, e);
    ArraySetAsSeries(vect, true);
    ArrayResize(trend, e);
    ArraySetAsSeries(trend, true);

    for(x = 0; x < e; x++)
    {
        vect[x] = 2*WMA(x, period/2) - WMA(x, period);
 //       Print("Bar date/time: ", TimeToStr(Time[x]), " close: ", Close[x], " vect[", x, "] = ", vect[x], " 2*WMA(p/2) = ", 2*WMA(x, period/2), " WMA(p) = ",  WMA(x, period));
    }

    for(x = 0; x < e-period; x++)

        ExtMapBuffer[x] = iMAOnArray(vect, 0, p, 0, method, x);

    for(x = e-period; x >= 0; x--)
    {
        trend[x] = trend[x+1];
        if (ExtMapBuffer[x]> ExtMapBuffer[x+1]) trend[x] =1;
        if (ExtMapBuffer[x]< ExtMapBuffer[x+1]) trend[x] =-1;

    if (trend[x]>0)
    { Uptrend[x] = ExtMapBuffer[x];
      if (trend[x+1]<0) Uptrend[x+1]=ExtMapBuffer[x+1];
      Dntrend[x] = EMPTY_VALUE;
    }
    else
    if (trend[x]<0)
    {
      Dntrend[x] = ExtMapBuffer[x];
      if (trend[x+1]>0) Dntrend[x+1]=ExtMapBuffer[x+1];
      Uptrend[x] = EMPTY_VALUE;
    }
    buff[x] = trend[x];

    //Print( " trend=",trend[x]);
    }
    if (EmailON==1 && Dntrend[0] != EMPTY_VALUE &&   Dntrend[1] == EMPTY_VALUE && isNewBar())
    {
      if (SoundON==1) Alert("SELL signal at Ask=",Ask,", Bid=",Bid,", Date=",TimeToStr(CurTime(),TIME_DATE)," ",TimeHour(CurTime()),":",TimeMinute(CurTime())," Symbol=",Symbol()," Period=",Period());
      SendMail("SELL signal alert","SELL signal at Ask="+DoubleToStr(Ask,4)+", Bid="+DoubleToStr(Bid,4)+", Date="+TimeToStr(CurTime(),TIME_DATE)+" "+TimeHour(CurTime())+":"+TimeMinute(CurTime())+" Symbol="+Symbol()+" Period="+Period());
    }
    if (EmailON==1 && Uptrend[0] != EMPTY_VALUE &&   Uptrend[1] == EMPTY_VALUE && isNewBar())
    {
      if (SoundON==1) Alert("BUY signal at Ask=",Ask,", Bid=",Bid,", Time=",TimeToStr(CurTime(),TIME_DATE)," ",TimeHour(CurTime()),":",TimeMinute(CurTime())," Symbol=",Symbol()," Period=",Period());
      SendMail("BUY signal alert","BUY signal at Ask="+DoubleToStr(Ask,4)+", Bid="+DoubleToStr(Bid,4)+", Date="+TimeToStr(CurTime(),TIME_DATE)+" "+TimeHour(CurTime())+":"+TimeMinute(CurTime())+" Symbol="+Symbol()+" Period="+Period());
    }
    return(0);
}

bool isNewBar()
{
   static datetime lastbar=0;
   datetime curbar = Time[0];
   if(lastbar!=curbar)
   {
      lastbar=curbar;
      return (true);
   }
   else
   {
      return(false);
   }
}


//+------------------------------------------------------------------+
Comments