Spread Analyzer
Indicator

Spread Analyzer

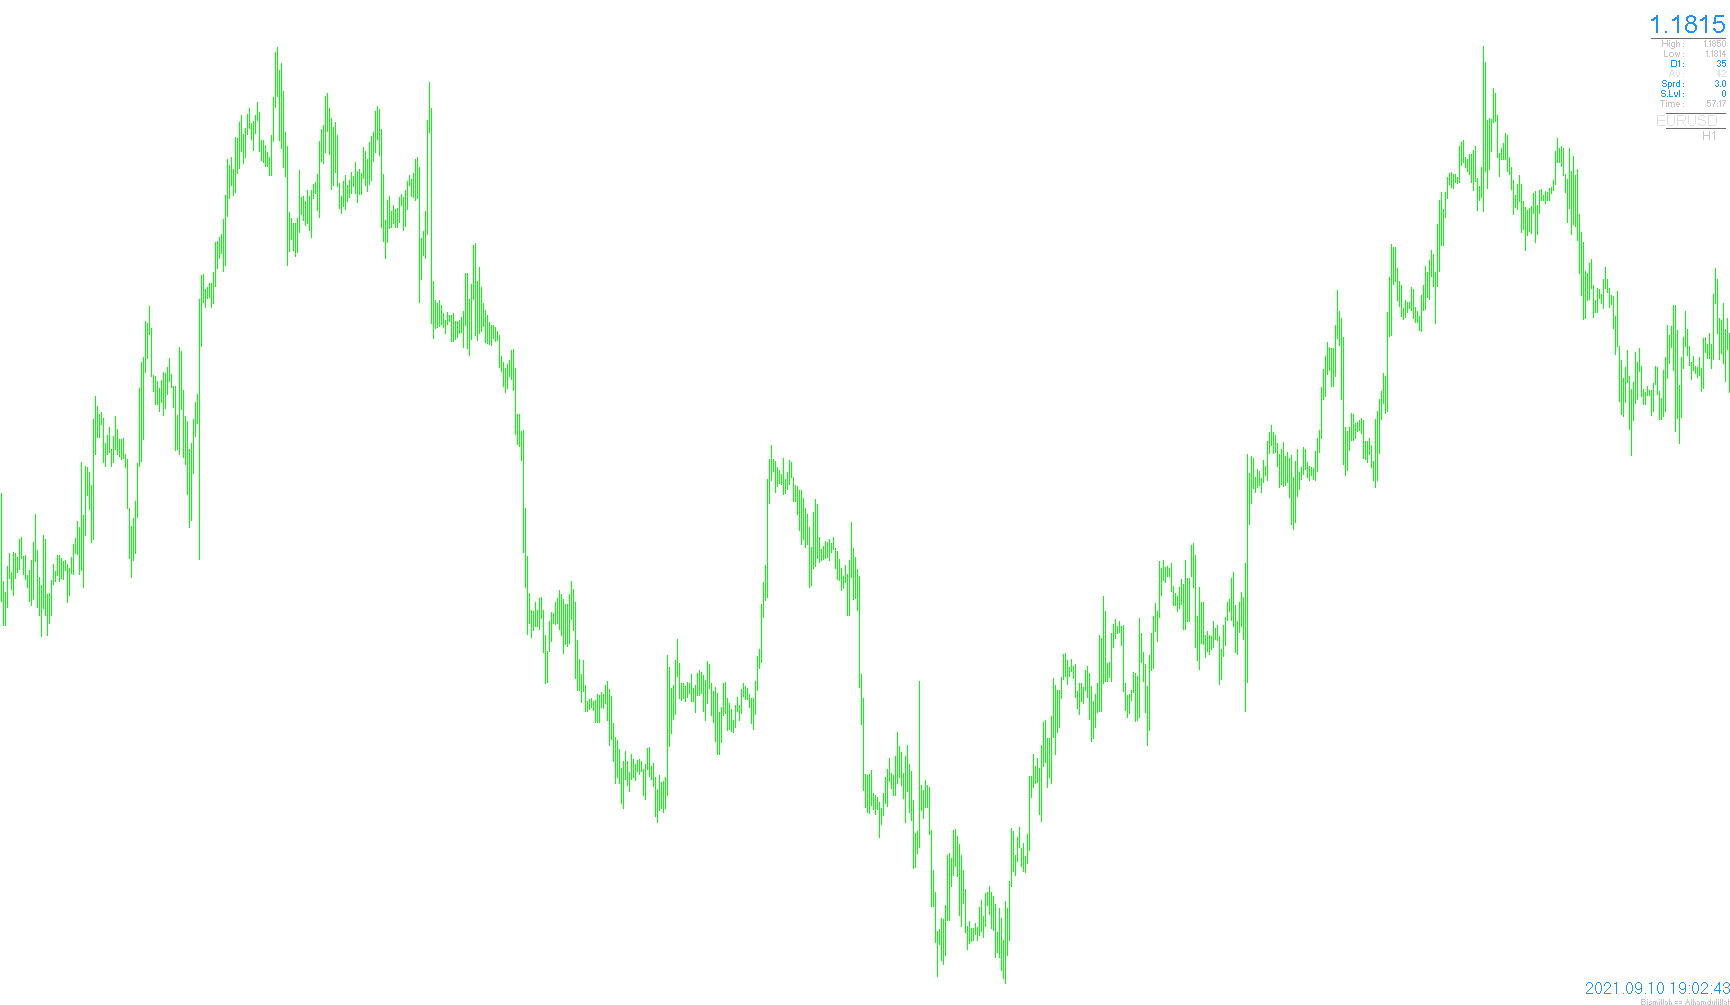
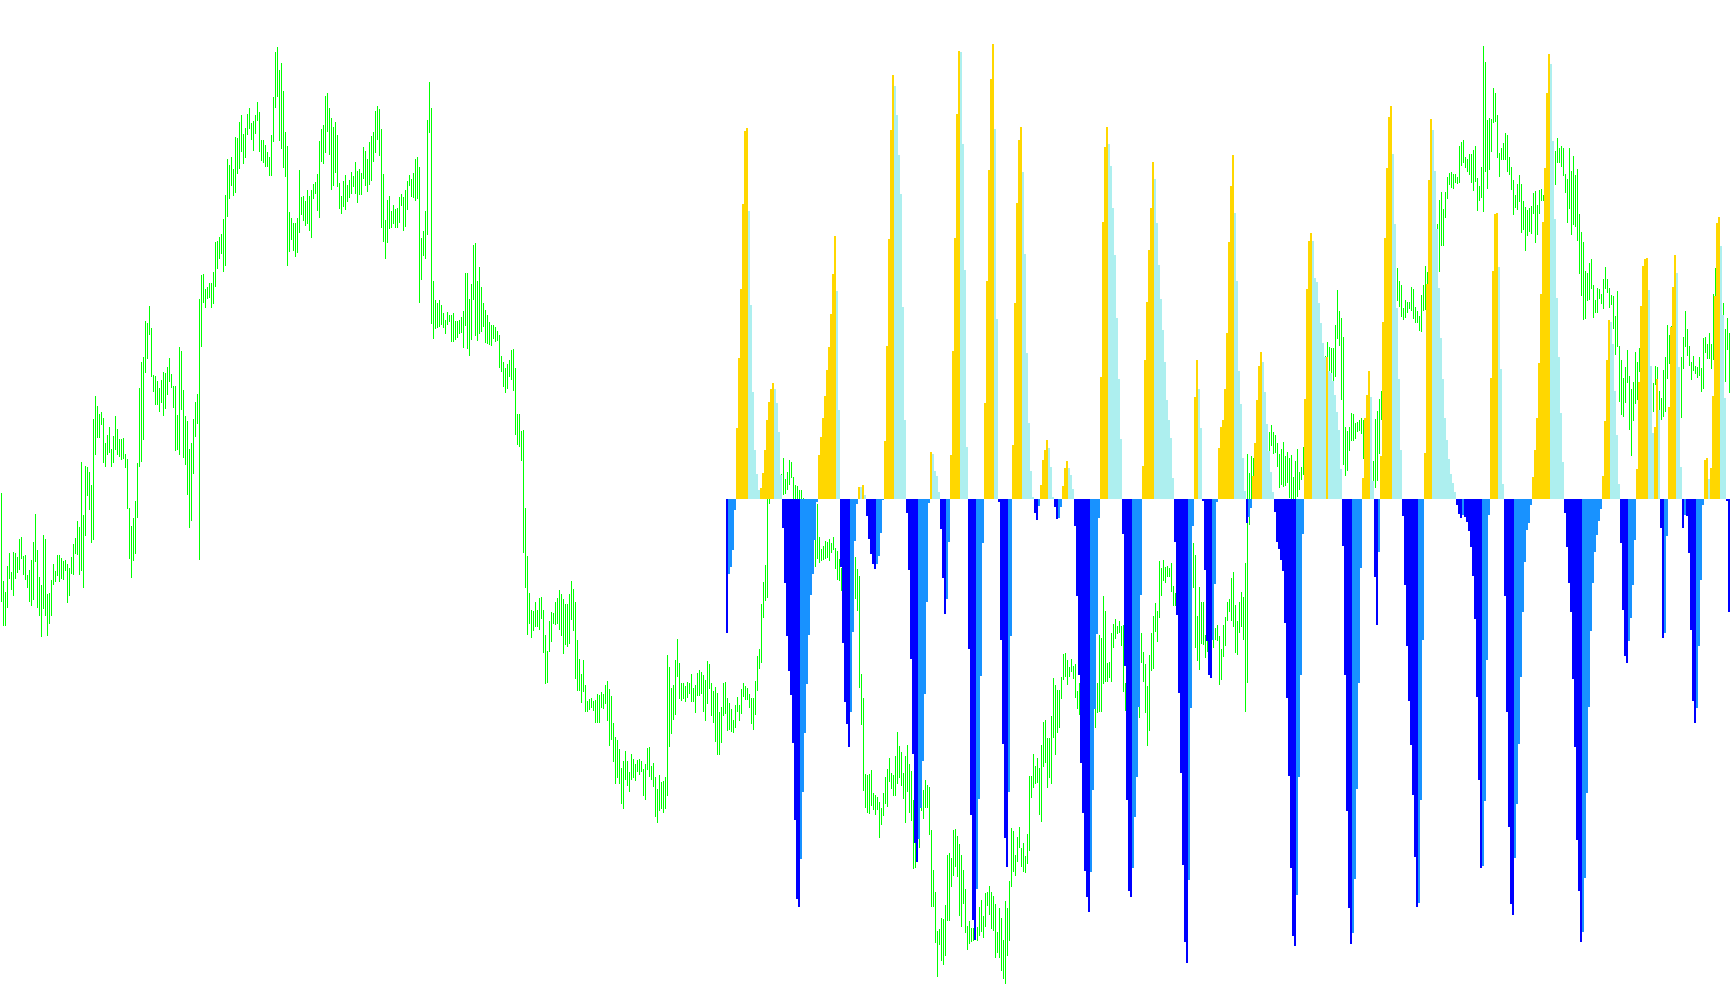
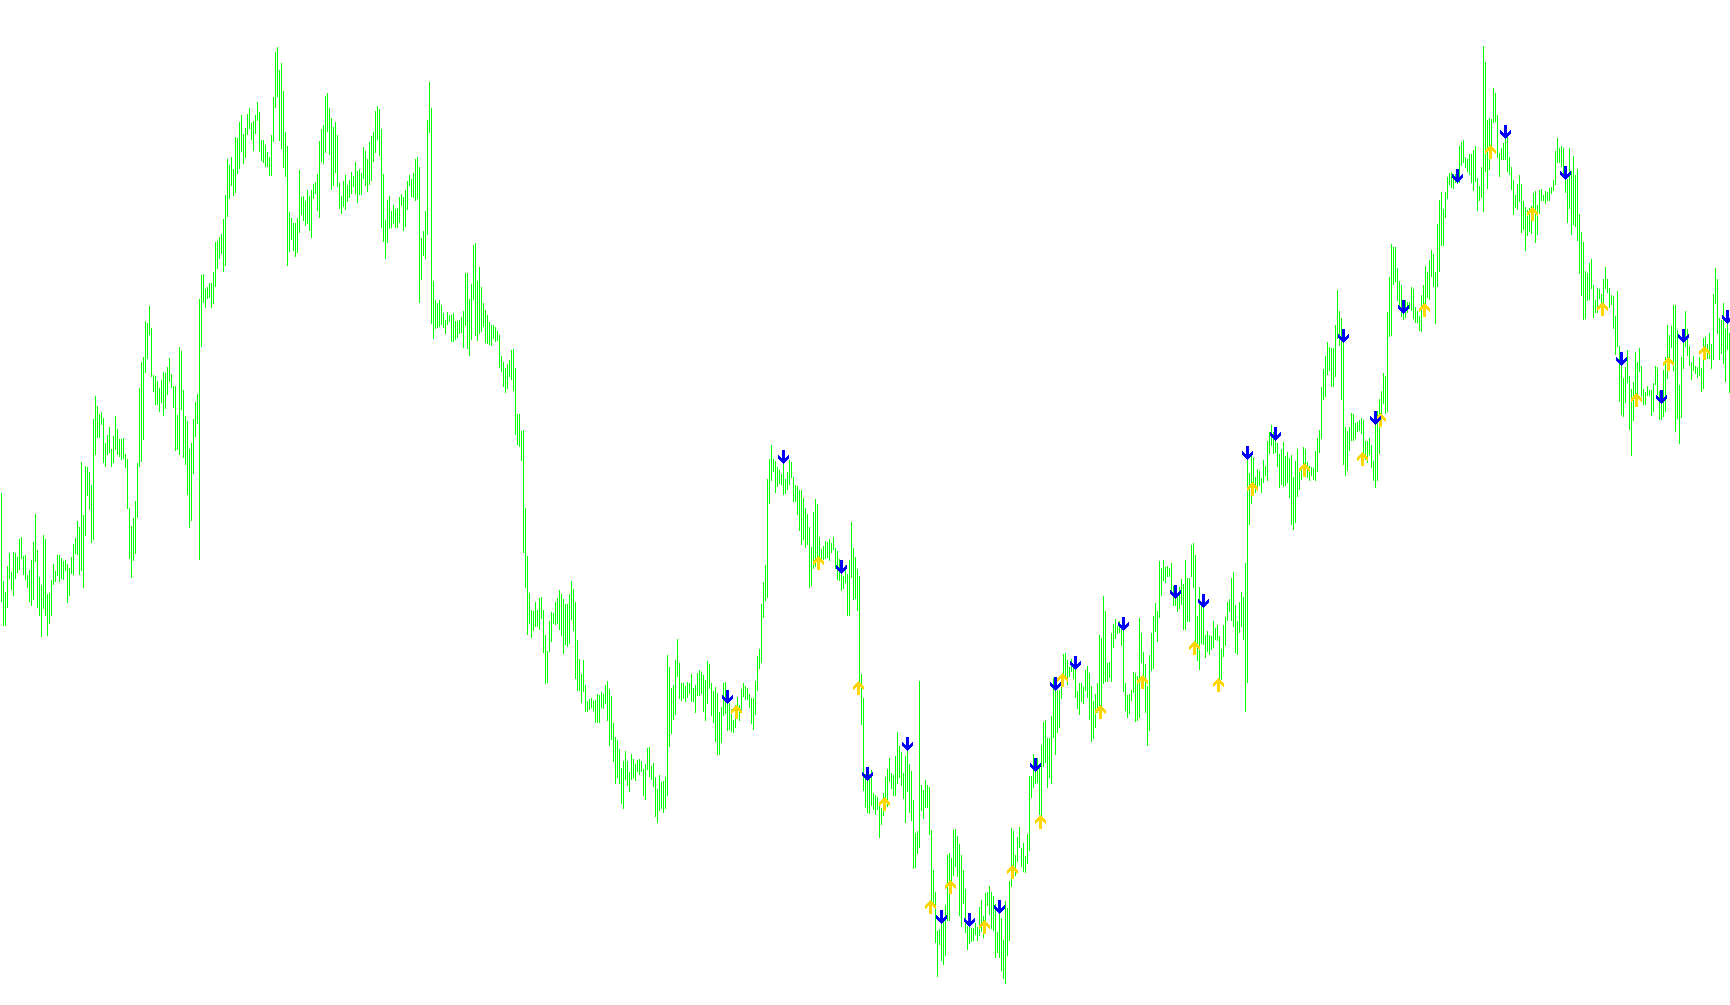
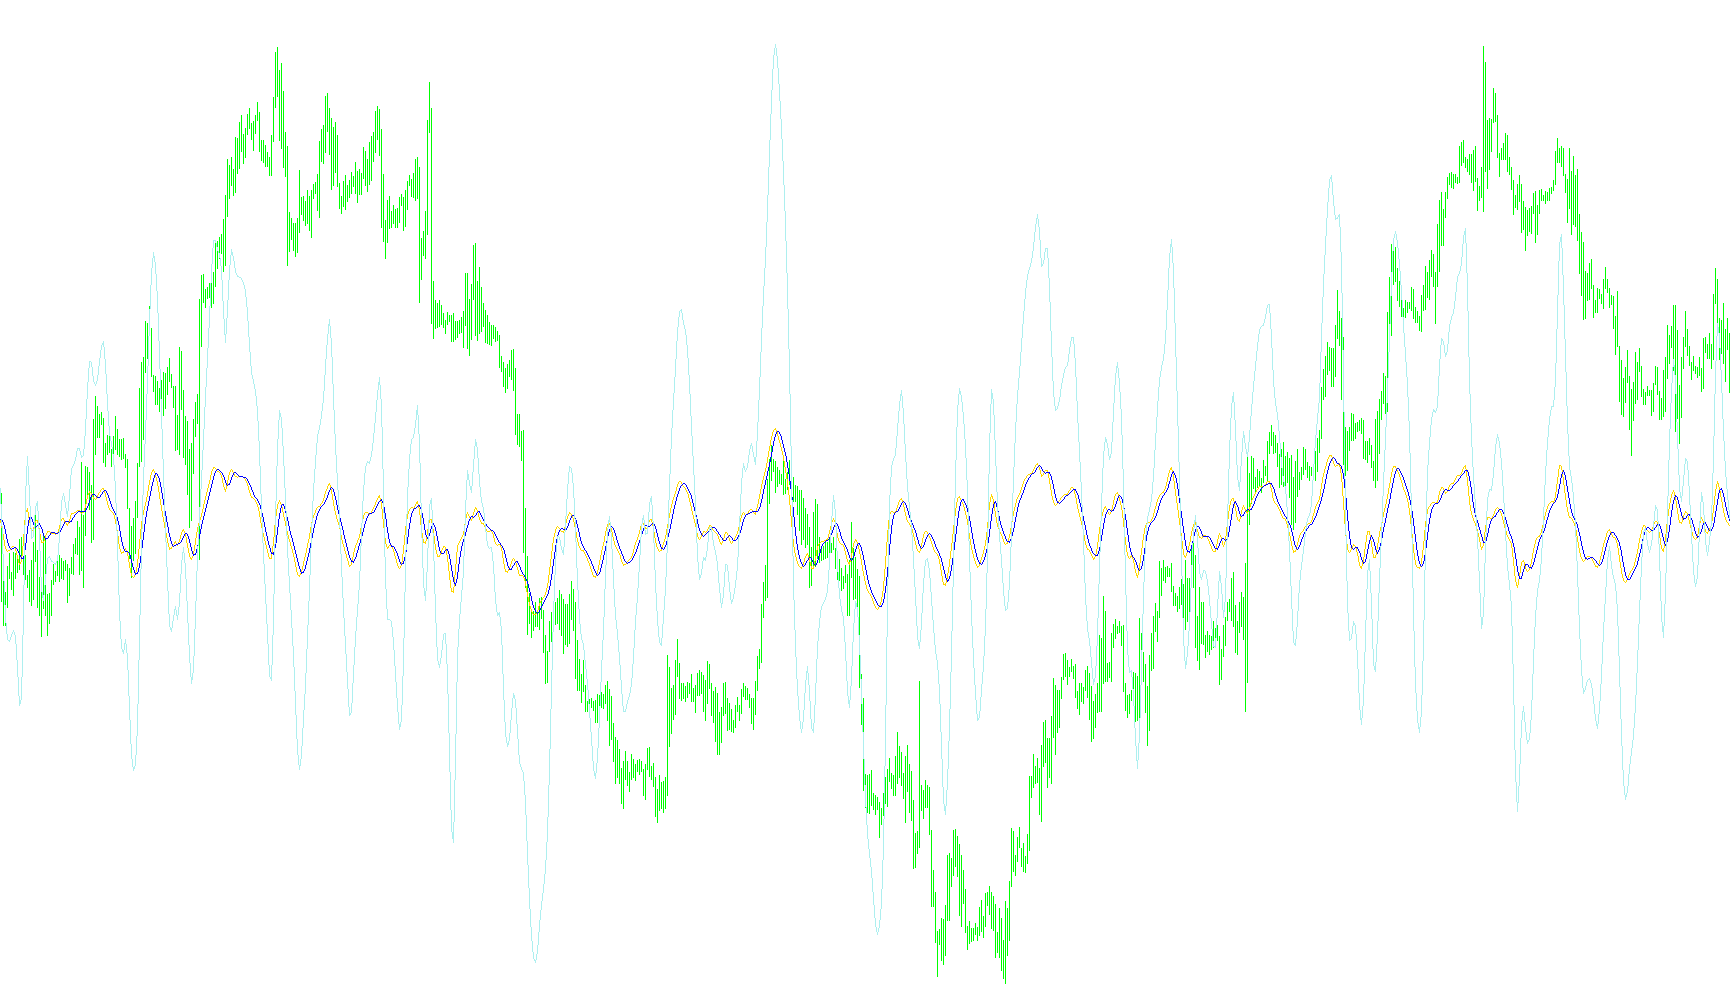
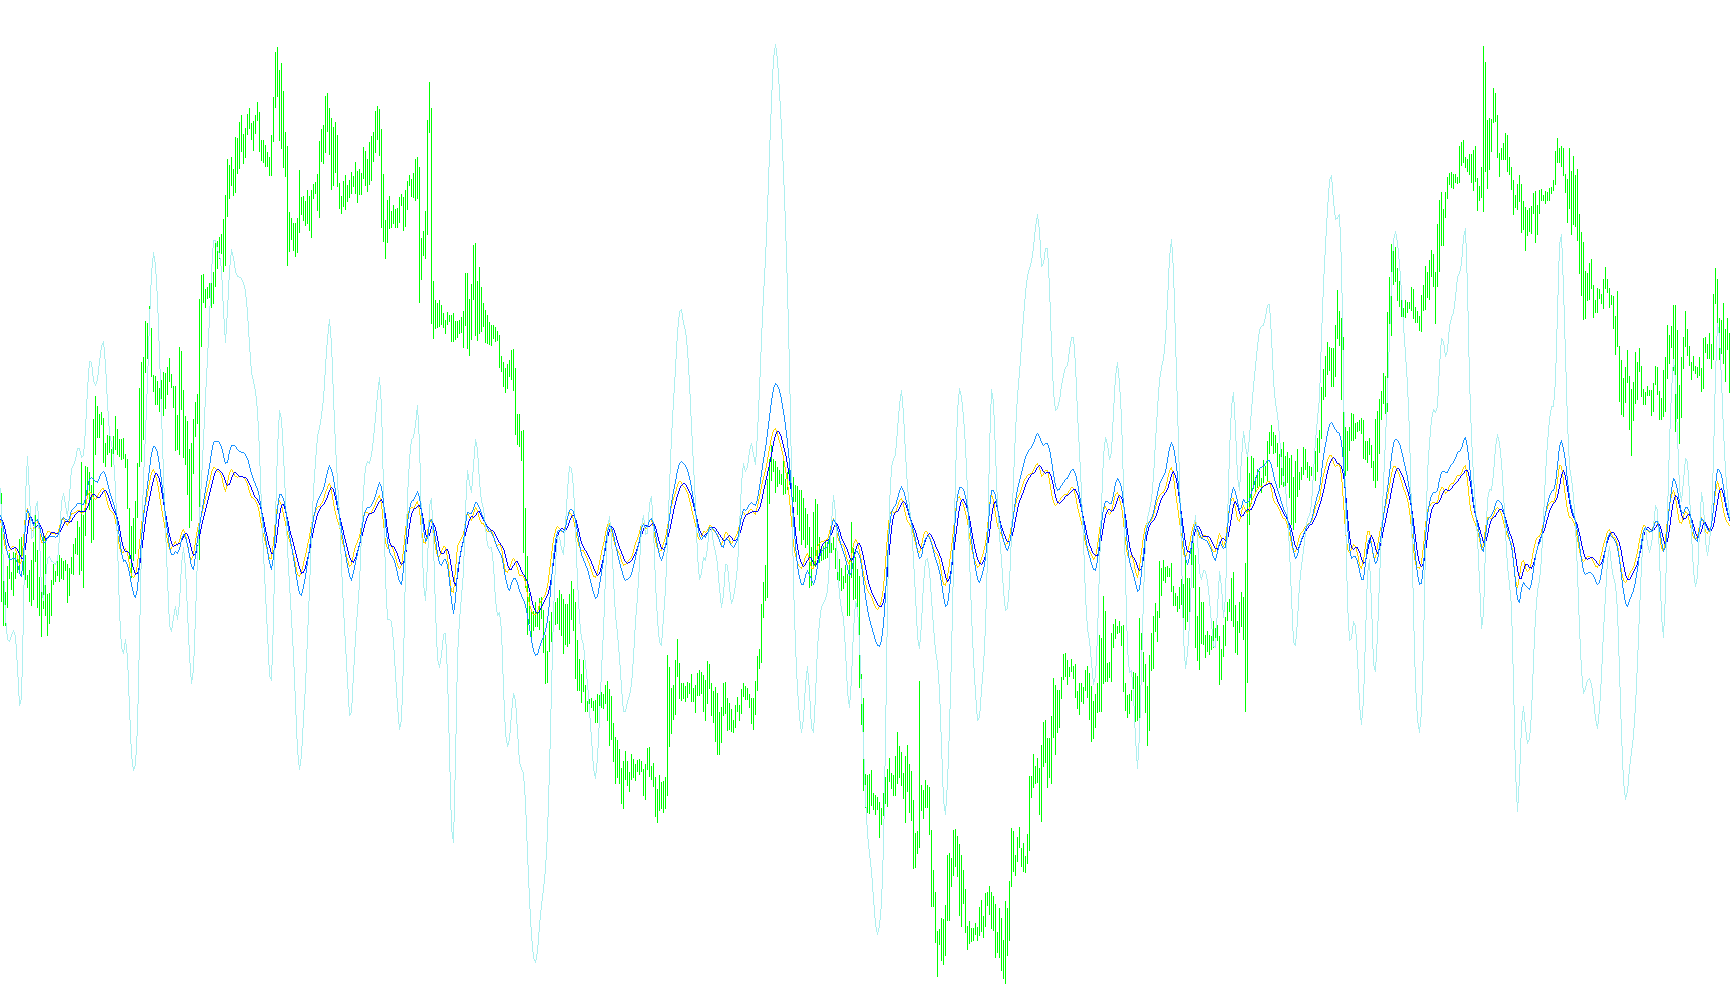
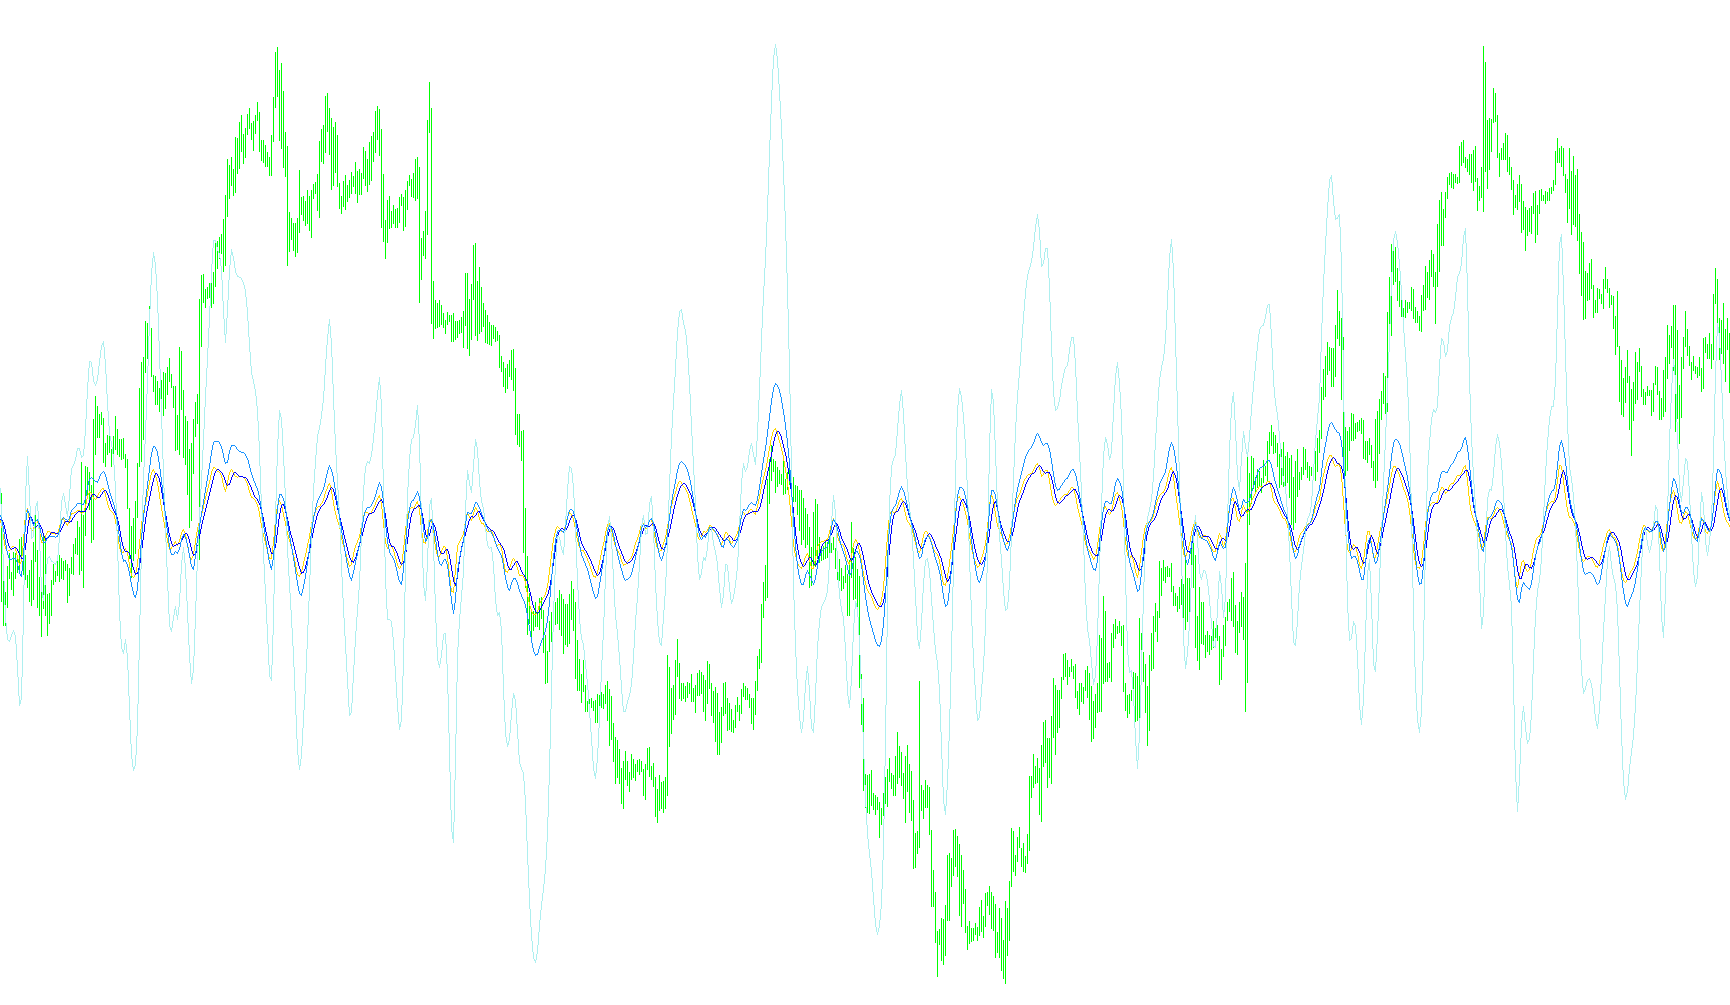
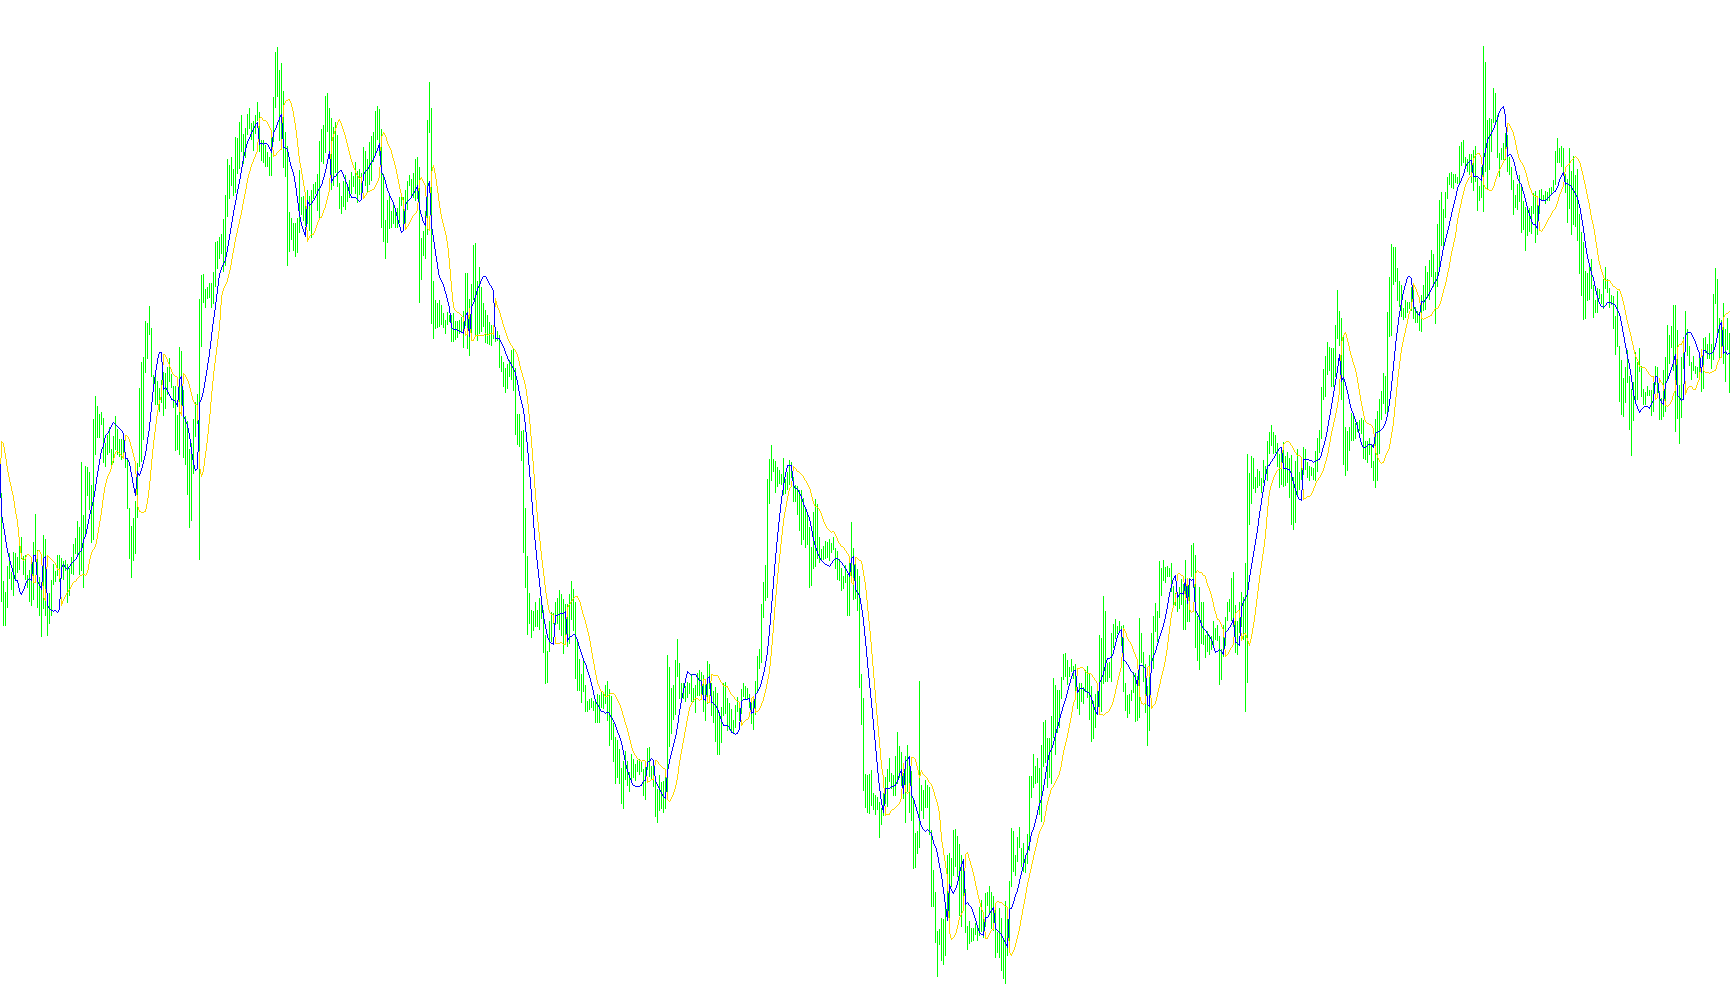
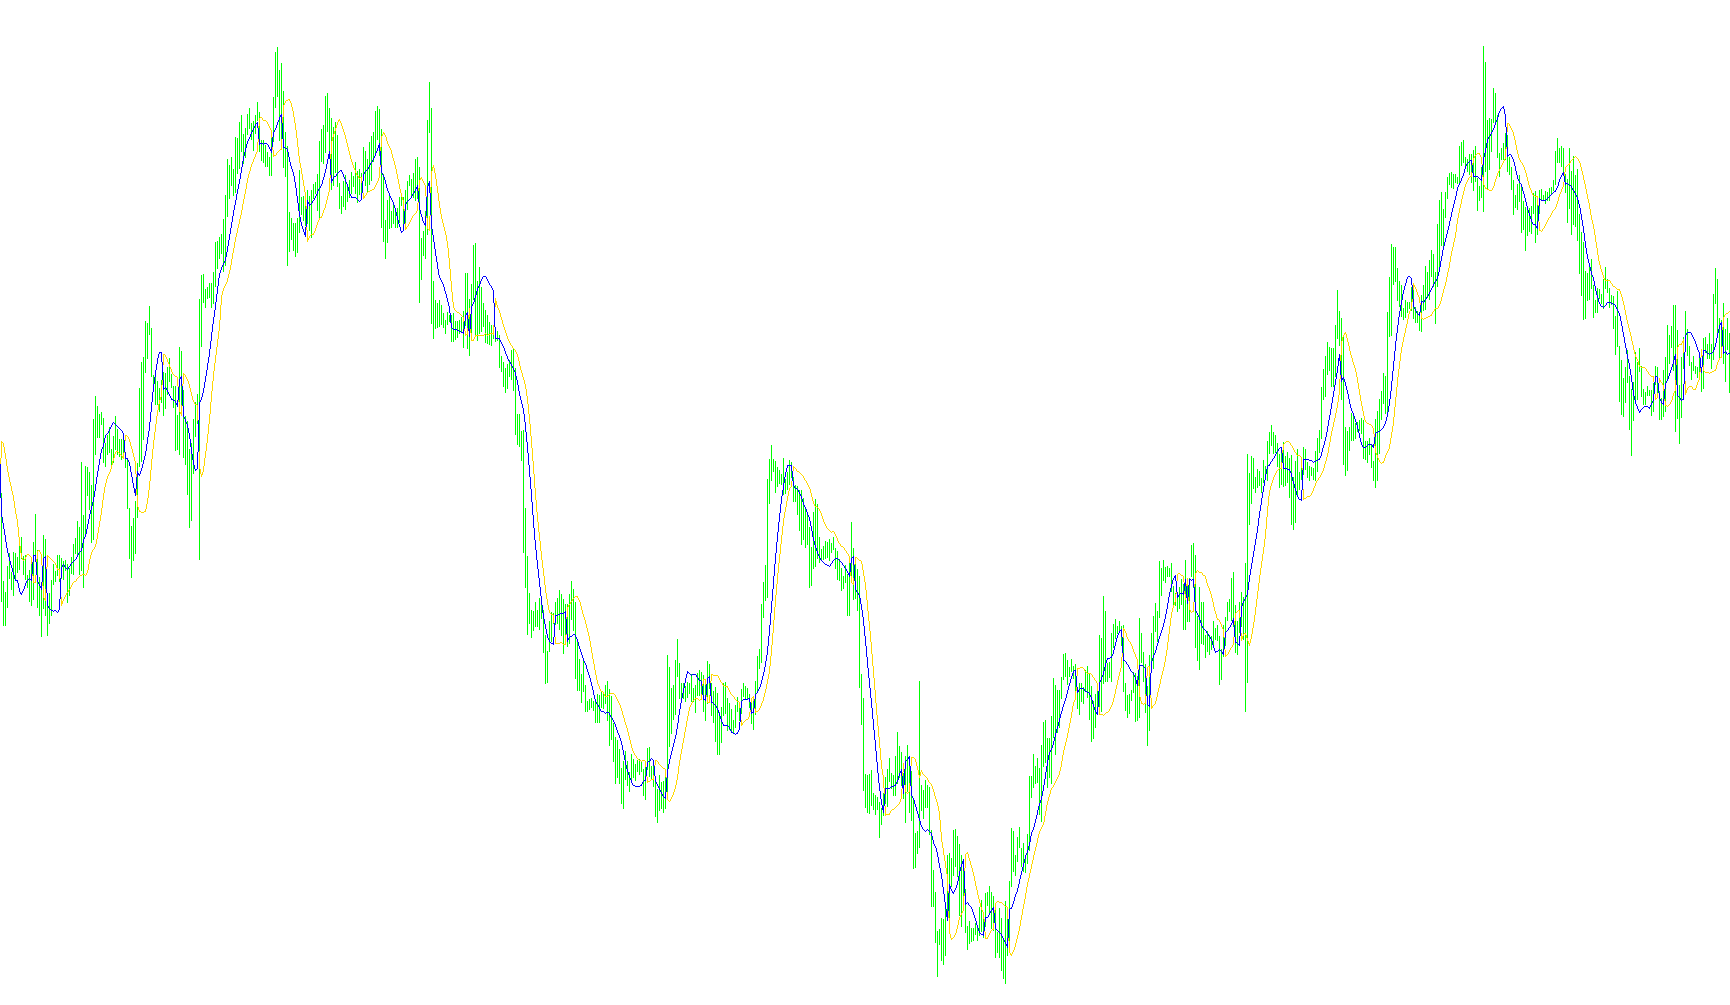
This indicator quantifies price range anomalies by comparing current bar volatility against a moving average of historical spreads to identify significant expansion zones.

spread swap
Indicator

spread swap

This indicator extracts and visualizes live bid-ask spreads alongside long and short overnight financing rates directly on a secondary dashboard window.

spread swap_v1
Indicator

spread swap_v1

This indicator dynamically retrieves and displays the current market spread alongside the specific long and short rollover swap rates for a given currency pair.

Spread&StopLoss
Indicator

Spread&StopLoss

Dynamically retrieves and displays real-time market volatility costs and minimum distance constraints directly on the chart interface.

SpreadMonitor-Phat-
Indicator

SpreadMonitor-Phat-

This indicator tracks real-time pip differentials and triggers immediate notifications upon detecting any fluctuations in the current market liquidity gap.

SpreadPaintBar
Indicator

SpreadPaintBar

This indicator identifies price action instances where candle bodies significantly exceed their respective wicks relative to a defined volatility percentage.

Spread_Hi_Lo_v1a
Indicator

Spread_Hi_Lo_v1a

iMA

This indicator provides a comprehensive real-time dashboard featuring dynamic price trends, daily high-low volatility, multi-timeframe analysis, and automated spread monitoring with visual color alerts.

spread_stoplevel_info_alert_en
Indicator

spread_stoplevel_info_alert_en

This indicator tracks real-time fluctuations in market spread and minimum stop level requirements, providing visual alerts and dynamic color shifts when liquidity conditions vary.

SpudFibo
Indicator

SpudFibo

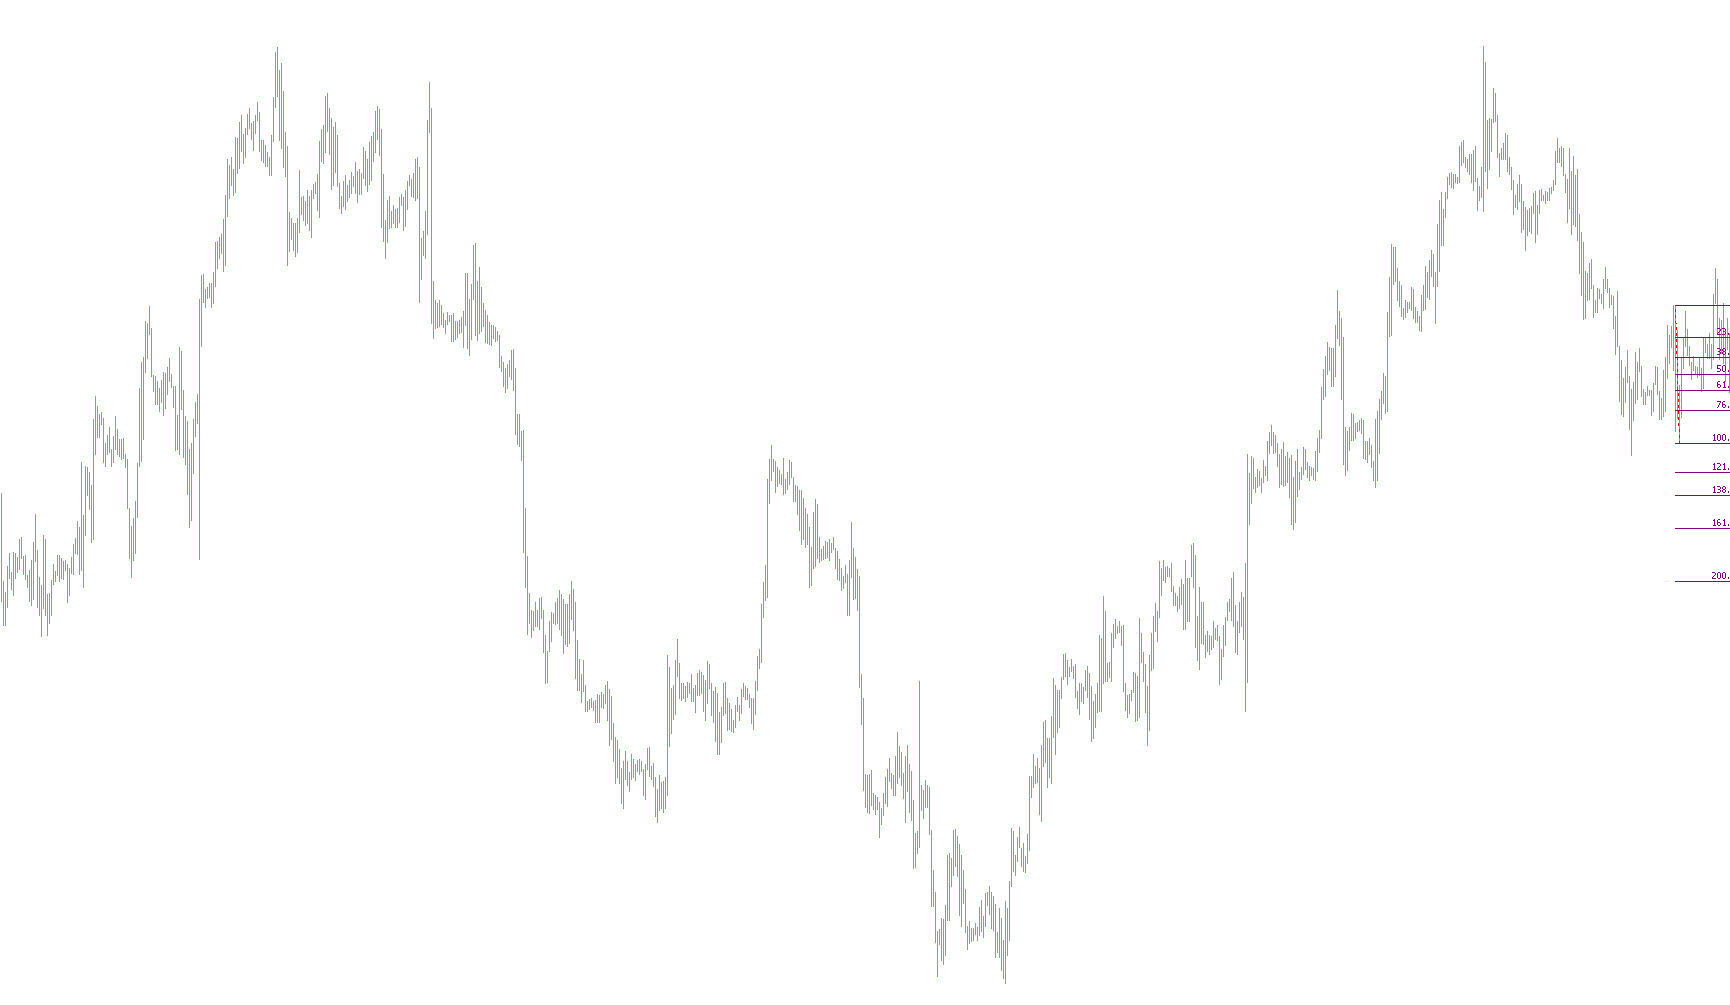
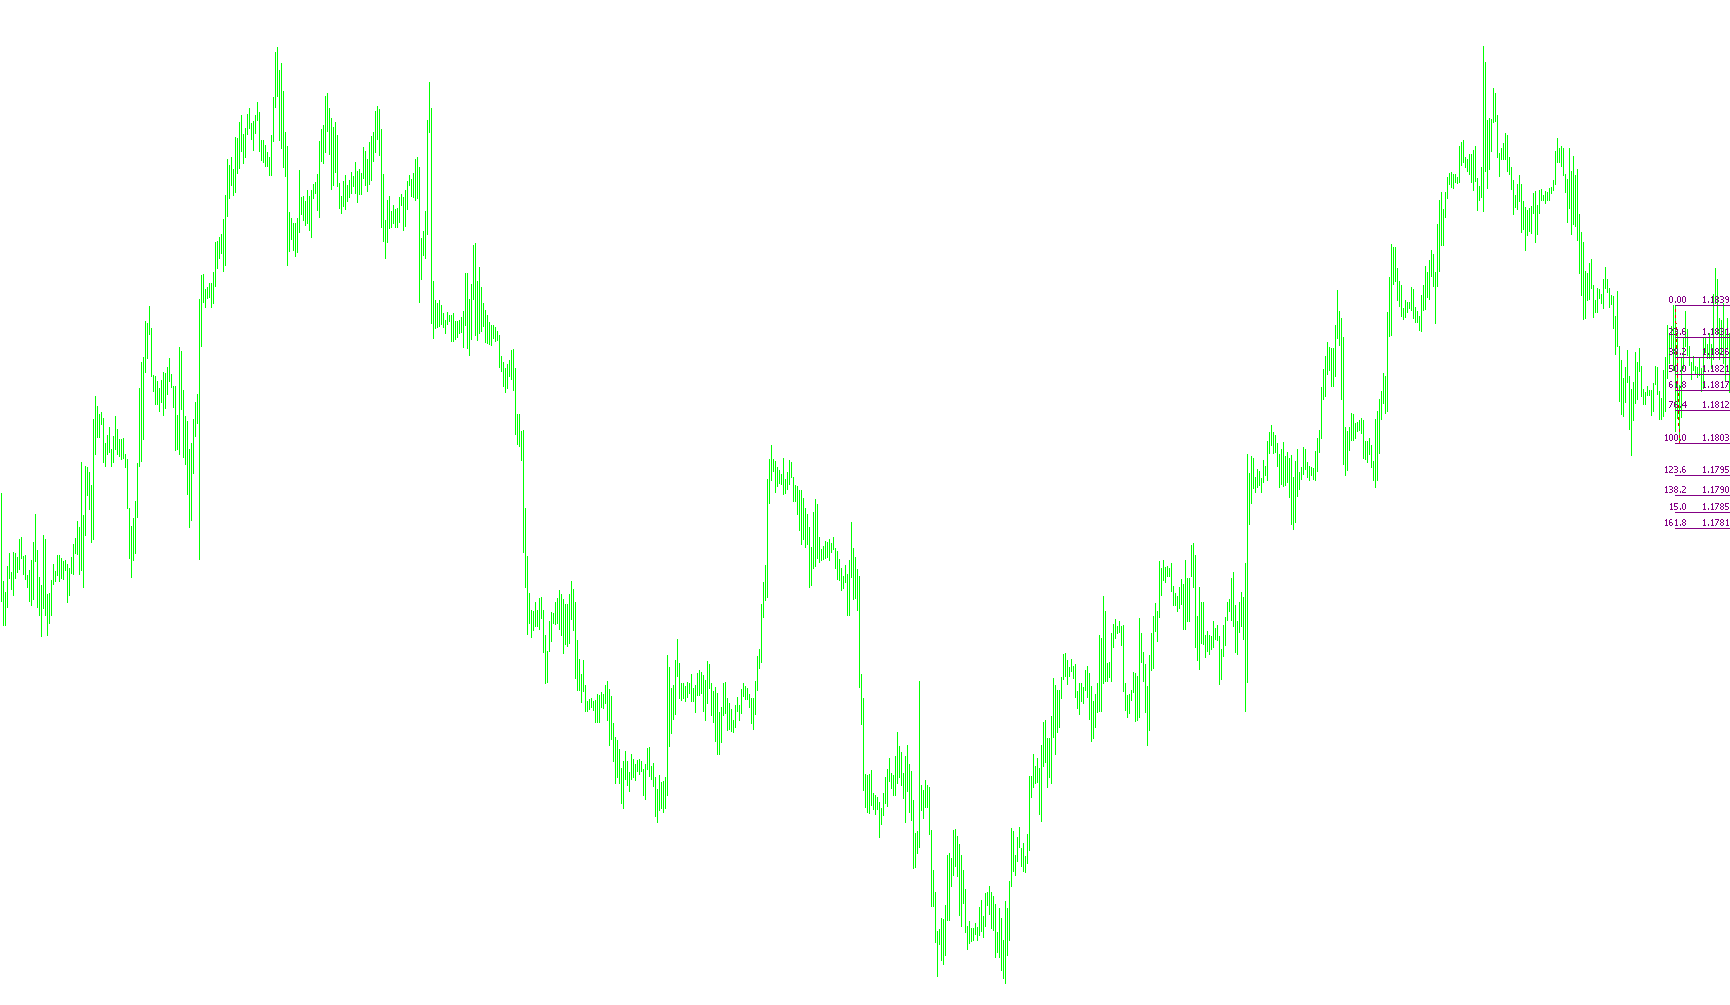
This indicator dynamically maps historical daily price extremes to generate multi-layered Fibonacci retracement and extension levels for simultaneous trend analysis.

Spyker
Indicator

Spyker

iMAiMAOnArray

Calculates the instantaneous spread between price extremes using a high-sensitivity exponential average paired with a long-term smoothed signal.

Indicator

SQ9 (Price)

SQ9 (Time)
Indicator

SQ9 (Time)

This tool projects geometric price-to-angle transformations onto a chronological timeline to identify potential rhythmic expansion zones across multiple timeframes.

SQ9 (Time)_001
Indicator

SQ9 (Time)_001

This indicator maps mathematical price-to-degree conversions onto a multi-dimensional time axis to project periodic vertical intervals across weeks, days, hours, and minutes.

Square of Nine
Indicator

Square of Nine

This indicator maps horizontal price levels by applying sequential radical adjustments to a user-defined base price to project geometric growth patterns.

Squeeze Straddle
Indicator

Squeeze Straddle

iATRiMAiStdDev

The indicator identifies market equilibrium by calculating the ratio between standard deviation and Average True Range to detect low-volatility squeeze zones.

Squeeze_Break
Indicator

Squeeze_Break

iATRiMACDiADXiRSI

This indicator identifies potential market breakouts by detecting when Bollinger Bands expand beyond Keltner Channels, filtered by Momentum to confirm trend bias.

Squeeze_Break_v1
Indicator

Squeeze_Break_v1

iATRiMACDiADXiRSI

This system identifies trend reversals by detecting periods of low volatility via Bollinger Band and Keltner Channel convergence, triggering alerts when price momentum confirms an expansion into a high-volatility state.

Squize_MA
Indicator

Squize_MA

iMA

This indicator identifies market compression by merging dual moving averages into a singular node whenever their absolute point distance falls below a specific threshold.

Indicator

Squize_MA_mtf

iMA
Indicator

SR-Rate Indicator

SRCma
Indicator

SRCma

iMAOnArray

This indicator quantifies the non-linear monotonic relationship between price movements by calculating the rank correlation coefficient across a sliding window.

SRCx2MA
Indicator

SRCx2MA

iMAOnArray

This indicator calculates the volatility variance between dual Source Moving Average (SRCma) inputs and applies an SMA smoothing filter to identify directional momentum shifts via histogram displacement.
SRCx2MA_arr
Indicator

SRCx2MA_arr

iMAOnArray

This indicator identifies trend reversals by calculating the smoothed differential between two Source Moving Average (SRCma) values and detecting zero-line crossovers of their residual momentum.

SRDC Fibo AHA V0_1
Indicator

SRDC Fibo AHA V0_1

This indicator dynamically identifies the preceding day's price extremes to project multi-level Fibonacci retracement zones onto the current intraday chart.
SRDC Fibo AHA V0_1b
Indicator

SRDC Fibo AHA V0_1b

This indicator dynamically calculates and plots a 13-level Fibonacci retracement based on the price extremes of the current daily trading session.
Srev
Indicator

Srev

Identifies potential trend reversal points by detecting price breaches of defined volatility thresholds relative to high-low extremes over a specific period.

SRVI@1
Indicator

SRVI@1

This indicator quantifies market momentum by calculating the ratio of weighted candle body price actions relative to the weighted high-low ranges over a rolling period.

SRVI@1_v1
Indicator

SRVI@1_v1

This indicator quantifies market velocity by calculating a weighted average of price fluctuations over multiple candles to derive a momentum-based ratio against historical range volatility.

SRVI@2
Indicator

SRVI@2

This indicator calculates a relative vigor ratio by normalizing the weighted sum of price ranges against price velocities to identify momentum shifts and signal divergences.

SRVI@2_v1
Indicator

SRVI@2_v1

This indicator calculates a weighted ratio of bullish price expansion against bearish volatility to identify trend strength and momentum shifts.

SRVI@3
Indicator

SRVI@3

This indicator quantifies market vigor by calculating the ratio of weighted price action gains against high-low volatility range across a smoothed moving average signal.

SR_AlertSystemM
Indicator

SR_AlertSystemM

This indicator monitors price action relative to predefined horizontal levels and triggers auditory alerts when the market price pierces established resistance or support boundaries.

SR_Barry_Eli_MTF
Indicator

SR_Barry_Eli_MTF

iFractals

This indicator projects historical fractal high and low price levels from multiple concurrent timeframes onto a single chart to identify key structural support and resistance zones.

SR_Barry_Eli_MTF_ammended
Indicator

SR_Barry_Eli_MTF_ammended

iFractals

This indicator projects synchronized fractal high and low levels from multiple higher timeframes onto the current chart to identify structural support and resistance zones.

Indicator

sr_KGSupportandResistanceAlert_Revision2

SR_MTF_Eli
Indicator

SR_MTF_Eli

iFractals

This indicator projects historical fractal highs and lows from multiple specific timeframes onto a single chart to identify structural pivot points.

SSA
Indicator

SSA

The code implements high-level linear algebra routines to perform singular value decomposition (SVD) and eigenvalue calculations using Gauss bisection and matrix reconstruction for signal smoothing.

sSaveSetFunctions
Indicator

sSaveSetFunctions

Automatically captures and logs unique expert advisor parameter sets into sequentially numbered files and a consolidated HTML report during the MT4 optimization process.

SSL channel chart
Indicator

SSL channel chart

iATRiMA

This indicator detects trend shifts by monitoring price crossovers against dual Simple Moving Averages of high and low prices, dynamically flipping the upper and lower boundary lines based on the prevailing momentum.

SSL
Indicator

SSL

iMA

The indicator identifies trend persistence by dynamically switching between high and low price moving averages based on whether the current close breaches preceding SMA boundaries.

SSL_channel_chartA
Indicator

SSL_channel_chartA

iMA

This indicator identifies trend shifts by monitoring price breaches of dual Simple Moving Average envelopes based on high and low price extremes.

SSL_channel_chartVar_alert
Indicator

SSL_channel_chartVar_alert

iMA

This indicator identifies directional momentum by comparing price action against high and low moving average boundaries to plot a responsive trend channel.

SSL_channel_chart_alert-CA
Indicator

SSL_channel_chart_alert-CA

This indicator dynamically swaps upper and lower boundary values based on price interaction with exponential moving averages of high and low extremes to identify structural trend shifts.

SSL_channel_chart_alert
Indicator

SSL_channel_chart_alert

iMA

The indicator identifies trend shifts by comparing closing prices against SMA boundaries of historical highs and lows to dynamically swap upper and lower channel limits.

Indicator

SSL_channel_chart_alert_mtf

iMA
SSL_channel_chart_LnSig_alert
Indicator

SSL_channel_chart_LnSig_alert

iATRiMA

This indicator identifies trend reversals by dynamically flipping between high and low Simple Moving Average boundaries based on price breaches to create a reactive volatility channel.

SSL_channel_chart_varBLnSig_alert
Indicator

SSL_channel_chart_varBLnSig_alert

iATRiMA

The algorithm identifies directional shifts by comparing closing prices against high and low moving average boundaries to flip a dual-channel structure based on prevailing momentum.

SSL_channel_chart_varLnSig_alert
Indicator

SSL_channel_chart_varLnSig_alert

iATRiMA

The algorithm identifies trend shifts by monitoring price breakouts against dynamic moving average corridors, flipping boundary orientations based on high/low price breaches.

SSL_fast
Indicator

SSL_fast

iMA

This indicator identifies trend shifts by comparing current closing prices against a rolling simple moving average of the high and low price extremes.

SSL_fastA
Indicator

SSL_fastA

iMA

This indicator identifies trend shifts by comparing closing prices against a dual-mode Simple Moving Average calculated from high and low price extremes.