sinTrend_001
Download script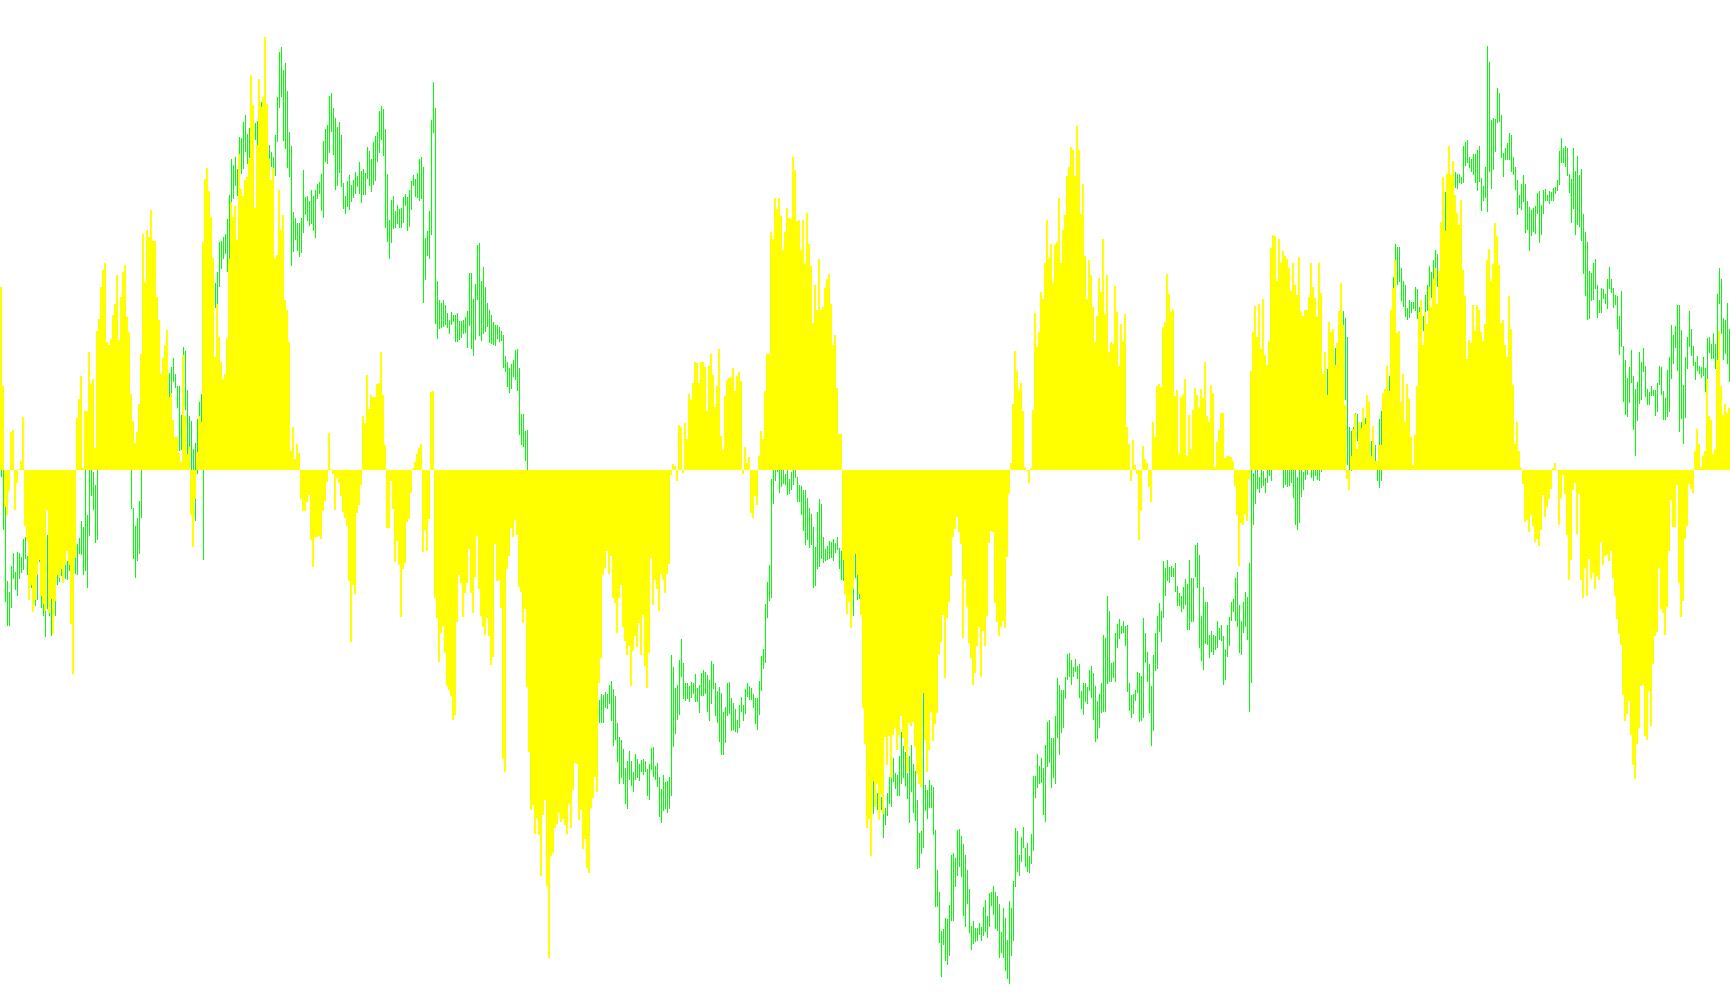
Overview of the TrendOSC Indicator
The TrendOSC is a specialized technical analysis tool designed to help traders visualize market momentum and trend direction by calculating the cyclical movement of price. Unlike standard oscillators that may simply show overbought or oversold conditions, this script focuses on identifying the "rhythm" of price action relative to specific timeframes.
How the Logic Works
1. Dynamic Timeframe Adaptation One of the primary features of this tool is its intelligence regarding the chart you are viewing. The script automatically detects your current trading timeframe (e.g., 1-minute, hourly, daily, or monthly) and adjusts its internal calculation period accordingly. This ensures that the indicator remains relevant whether you are performing high-frequency scalping or long-term swing trading. By shifting the "look-back" window based on the timeframe, it attempts to provide a consistent perspective on market volatility across different scales.
2. Sine Wave Calculation The core mathematical logic of the script utilizes a sine function—a trigonometric calculation typically used to model periodic and oscillating movements. The tool takes the difference between the current closing price and the closing price from a set number of bars ago (determined by the timeframe detection).
By applying this difference to a sine wave formula, the indicator converts raw price fluctuations into a smoothed, wave-like movement. This helps in identifying:
- Trend Strength: The intensity of the wave's movement.
- Cycle Completion: Where the price is currently positioned within its local trend cycle.
3. Visual Representation The result of these calculations is displayed as a yellow histogram in a separate window at the bottom of your trading platform. This allows you to monitor the "pulse" of the market independently of the main price candles.
Summary for the Trader
Essentially, the TrendOSC acts as a rhythmic filter. Instead of looking at jagged price spikes, it translates price action into a flowing movement. By observing how these waves rise and fall, traders can better identify the underlying cycle of a trend, helping to distinguish between standard market "noise" and significant directional shifts.
//+------------------------------------------------------------------+
//|                                                     TrendOSC.mq4 |
//|                      Copyright © 2005, MetaQuotes Software Corp. |
//|                                        http://www.metaquotes.net |
//+------------------------------------------------------------------+
#property copyright "Copyright © 2005, DVYU."
#property link      "http://www.DVYU.ox"
#property indicator_buffers 1
#property indicator_color1 Yellow
#property indicator_separate_window
//#property indicator_minimum -1
//#property indicator_maximum 1
//ïàðàìåòðû
int g_period;
//Îáúÿâëåíèå ãëîáàëüíûõ ïåðåìåííûõ
double z_buffer[];
//double SpeedTrend1;
double dBar;
int x;
//+------------------------------------------------------------------+
//| Custom indicator initialization function                         |
//+------------------------------------------------------------------+
int init()
  {
   SetIndexStyle(0, DRAW_HISTOGRAM, EMPTY, 2, Yellow);
   SetIndexBuffer(0,z_buffer);
   IndicatorDigits(4);
   int x=Period();
   //Äëÿ ïîäáîðà ñìåùåíèÿ (shift) èíäèêàòîðà èçìåíèòå çíà÷åíèå g_period äëÿ íóæíîãî ïåðèîäà ãðàôèêà
   switch(x)
     {
      case 1:g_period=110;
         Comment("Ìèíóòíûé ãðàôèê","   ","Ñìåùåíèå",g_period);
         break;
      case 5:g_period=90;
         Comment("Ïÿòèìèíóòíûé ãðàôèê","   ","Ñìåùåíèå",g_period);
         break;
      case 15:g_period=60;
         Comment("Ïÿòíàäöàòèìèíóòíûé ãðàôèê","   ","Ñìåùåíèå",g_period);
         break;
      case 30:g_period=42;
         Comment("Ïîëó÷àñîâîé ãðàôèê","   ","Ñìåùåíèå",g_period);
         break;
      case 60:g_period=36;
         Comment("×àñîâîé ãðàôèê","   ","Ñìåùåíèå",g_period);
         break;
      case 240:g_period=24;
         Comment("×åòûðåõ÷àñîâîé ãðàôèê","   ","Ñìåùåíèå",g_period);
         break;
      case 1440:g_period=18;
         Comment("Äíåâíîé ãðàôèê","   ","Ñìåùåíèå",g_period);
         break;
      case 10080:g_period=12;
         Comment("Íåäåëüíûé  ãðàôèê","   ","Ñìåùåíèå",g_period);
         break;
      case 43200:g_period=3;
         Comment("Ìåñÿ÷íûé ãðàôèê","   ","Ñìåùåíèå",g_period);
         break;
     }
   return(0);
  }
//+------------------------------------------------------------------+
//| Custor indicator deinitialization function                       |
//+------------------------------------------------------------------+
int deinit()
  {
//----
//----
   return(0);
  }
//+------------------------------------------------------------------+
//| Custom indicator iteration function                              |
//+------------------------------------------------------------------+
int start()
  {
   int limit=0;
   int z;
   int counted_bars=IndicatorCounted();
   if(counted_bars<0) return(-1);
   if(counted_bars>0) counted_bars--;
   limit=Bars-counted_bars;
   for(int i=0; i<limit; i++)
     {
      z_buffer[i]=MathSin((Close[i]-Close[i+g_period])/g_period);
     }
//----
//----
   return(0);
  }
//+------------------------------------------------------------------+
Comments