six_ind_v31_v1
Download script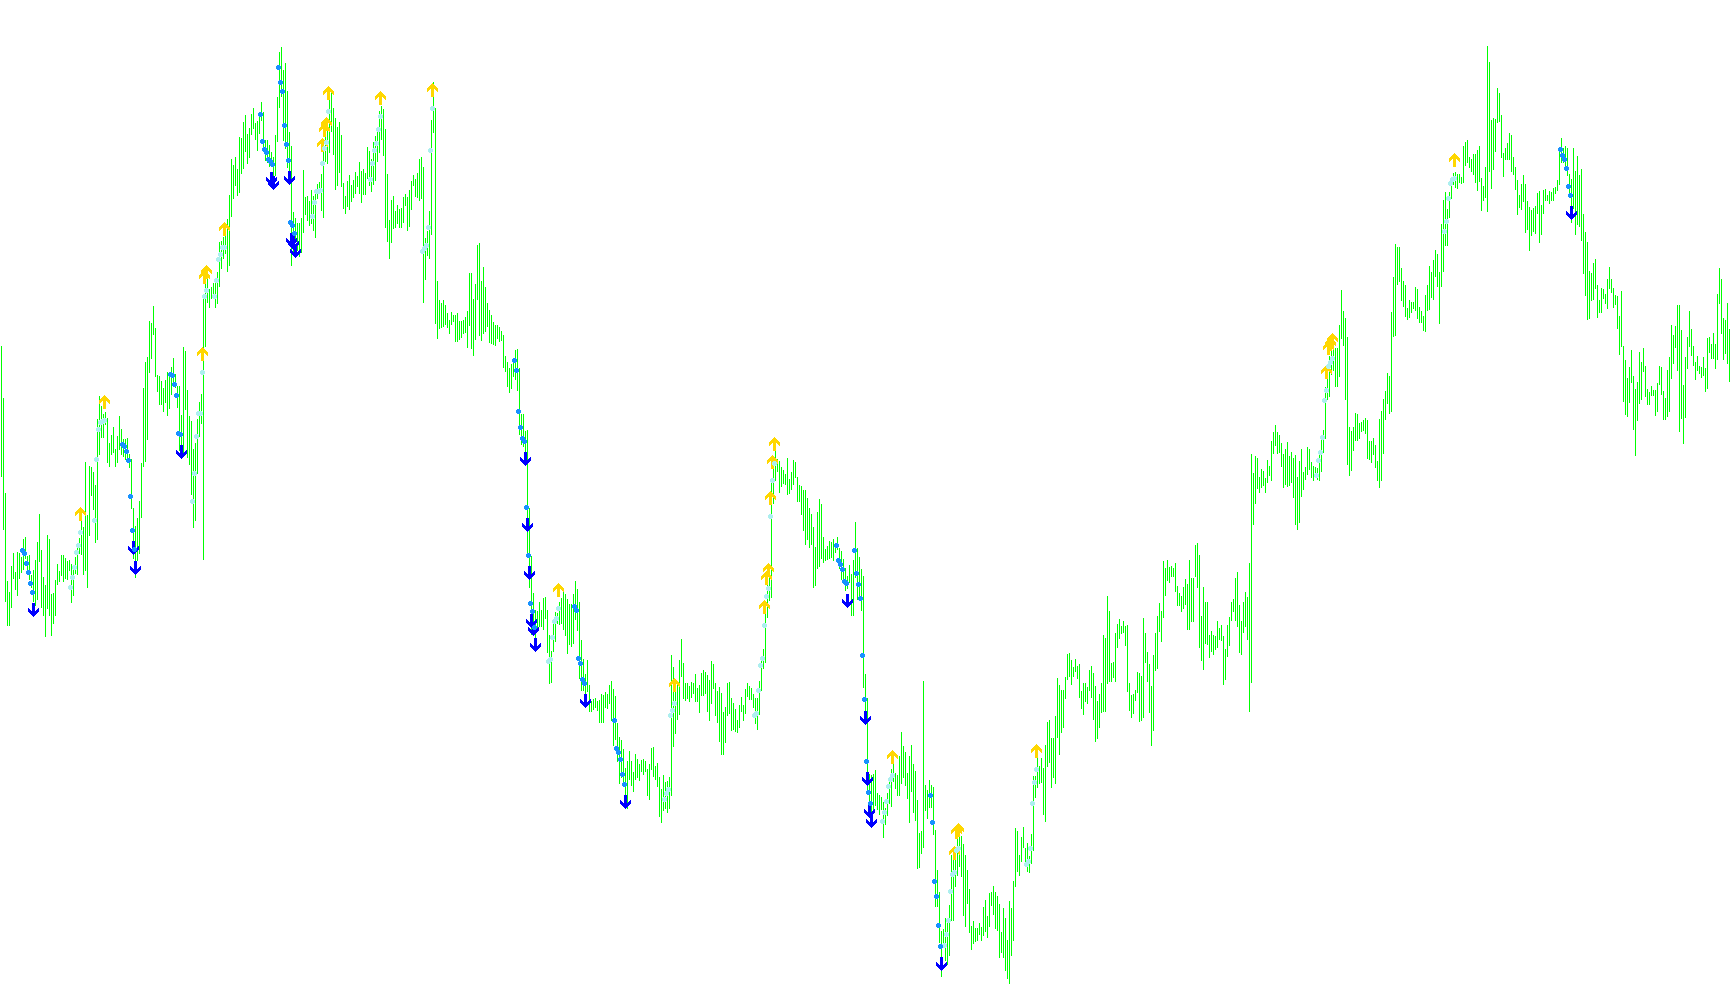
This tool is designed to analyze price action by identifying specific momentum trends based on the relationship between consecutive price movements. Instead of reacting to sudden spikes, it looks for a sustained sequence of progression to determine when a trend has reached a point of exhaustion or transition.
Core Methodology
The logic functions by calculating a "Typical Price" for each individual candle over a rolling six-period window. This price is derived from a combination of the high, low, and closing prices of each bar. By focusing on this average rather than just the closing price, the tool filters out minor market noise and focuses on the actual range of the price action.
How It Identifies Trends
The script constantly scans the market history to find two specific mathematical conditions:
1. Downward Momentum Detection The tool looks for a "staircase" effect where the calculated price of each of the last six periods is consistently lower than the one preceding it (moving backward in time). When it confirms that the price has been steadily declining across this entire six-bar sequence, it triggers a specific visual signal. This indicates a strong downward trend that may be reaching a turning point.
2. Upward Momentum Detection Conversely, the tool monitors for a continuous upward "staircase." If the calculated price of each of the last six periods is consistently higher than the one preceding it, the tool identifies a sustained bullish move. This signifies strong buying pressure over a defined period.
Visual Representation
To make these insights easy for a trader to interpret, the script translates these mathematical sequences into visual markers on your chart:
- Trend Signals: When the required six-period progression is met, the script places specific arrow symbols. These act as highlights, alerting you to areas where momentum has reached a peak or a specific structural milestone.
- Historical Mapping: In addition to the primary signals, the tool maps out the data points of the identified sequences. This helps in visualizing the "path" the price took to reach that point, allowing for a clearer understanding of the trend's geometry rather than just seeing an isolated signal.
Summary for Traders
Essentially, this script acts as a momentum tracker. It filters out "jittery" price movements and only highlights instances where the market has moved in a very specific, consistent direction over a six-period duration. It is designed to help you identify organized trends and potential areas of interest where price action has reached a significant structural sequence.
/*-----------------------------+
|			       |
| Shared by www.Aptrafx.com    |
|			       |
+------------------------------*/

//+------------------------------------------------------------------+
//| test.mq4                                                         |
//+------------------------------------------------------------------+
#property copyright "Ron T"
#property link      "http://www.lightpatch.com"

#property indicator_chart_window
#property indicator_buffers 4
#property indicator_color1 White
#property indicator_color2 Red
#property indicator_color3 White
#property indicator_color4 Red

//---- buffers
double ExtMapBuffer1[];
double ExtMapBuffer2[];
double ExtMapBuffer3[];
double ExtMapBuffer4[];


// User Input


//+------------------------------------------------------------------+
//| Custom indicator initialization function                         |
//|------------------------------------------------------------------|

int init()
  {

   SetIndexStyle(0,DRAW_ARROW);
   SetIndexBuffer(0, ExtMapBuffer1);
   SetIndexArrow(0,233); //up red

   SetIndexStyle(1,DRAW_ARROW);
   SetIndexBuffer(1, ExtMapBuffer2);
   SetIndexArrow(1,234); //down white

   SetIndexStyle(2,DRAW_ARROW);
   SetIndexBuffer(2, ExtMapBuffer3);
   SetIndexArrow(2,159); //white open square

   SetIndexStyle(3,DRAW_ARROW);
   SetIndexBuffer(3, ExtMapBuffer4);
   SetIndexArrow(3,159); //white open square

   return(0);
  }


//+------------------------------------------------------------------+
//| Custor indicator deinitialization function                       |
//+------------------------------------------------------------------+
int deinit()
  {
   int i;

   for( i=0; i<Bars; i++ ) ExtMapBuffer1[i]=0;
   for( i=0; i<Bars; i++ ) ExtMapBuffer2[i]=0;
   for( i=0; i<Bars; i++ ) ExtMapBuffer3[i]=0;
   for( i=0; i<Bars; i++ ) ExtMapBuffer4[i]=0;

   return(0);
  }


//+------------------------------------------------------------------+
//| Custom indicator iteration function                              |
//+------------------------------------------------------------------+
int start()
  {
   double oTYP0=0, oTYP1=0, oTYP2=0, oTYP3=0, oTYP4=0, oTYP5=0;

   int pos=Bars;

   while(pos>=0)
     {
      // six-period typical
      oTYP0=(High[pos+0]+Low[pos+0]+Close[pos+0]+Close[pos+0])/4;
      oTYP1=(High[pos+1]+Low[pos+1]+Close[pos+1]+Close[pos+1])/4;
      oTYP2=(High[pos+2]+Low[pos+2]+Close[pos+2]+Close[pos+2])/4;
      oTYP3=(High[pos+3]+Low[pos+3]+Close[pos+3]+Close[pos+3])/4;
      oTYP4=(High[pos+4]+Low[pos+4]+Close[pos+4]+Close[pos+4])/4;
      oTYP5=(High[pos+5]+Low[pos+5]+Close[pos+5]+Close[pos+5])/4;

      // six-period down
      if(oTYP5>oTYP4 && oTYP4>oTYP3 && oTYP3>oTYP2 && oTYP2>oTYP1 && oTYP1>oTYP0)
        {
         ExtMapBuffer1[pos]=0;
         ExtMapBuffer2[pos]=oTYP0-0.0005;  //down red

         ExtMapBuffer4[pos+0]=oTYP0;
         ExtMapBuffer4[pos+1]=oTYP1;
         ExtMapBuffer4[pos+2]=oTYP2;
         ExtMapBuffer4[pos+3]=oTYP3;
         ExtMapBuffer4[pos+4]=oTYP4;
         ExtMapBuffer4[pos+5]=oTYP5;
        }


      if(oTYP5<oTYP4 && oTYP4<oTYP3 && oTYP3<oTYP2 && oTYP2<oTYP1 && oTYP1<oTYP0)
        {
         // six-period up
         ExtMapBuffer1[pos]=oTYP0+0.0005;  //up white
         ExtMapBuffer2[pos]=0;

         ExtMapBuffer3[pos+0]=oTYP0;
         ExtMapBuffer3[pos+1]=oTYP1;
         ExtMapBuffer3[pos+2]=oTYP2;
         ExtMapBuffer3[pos+3]=oTYP3;
         ExtMapBuffer3[pos+4]=oTYP4;
         ExtMapBuffer3[pos+5]=oTYP5;
        }
 	   pos--;
     }

   return(0);
  }
//+------------------------------------------------------------------+
Comments