slow-stoch_v1
Download script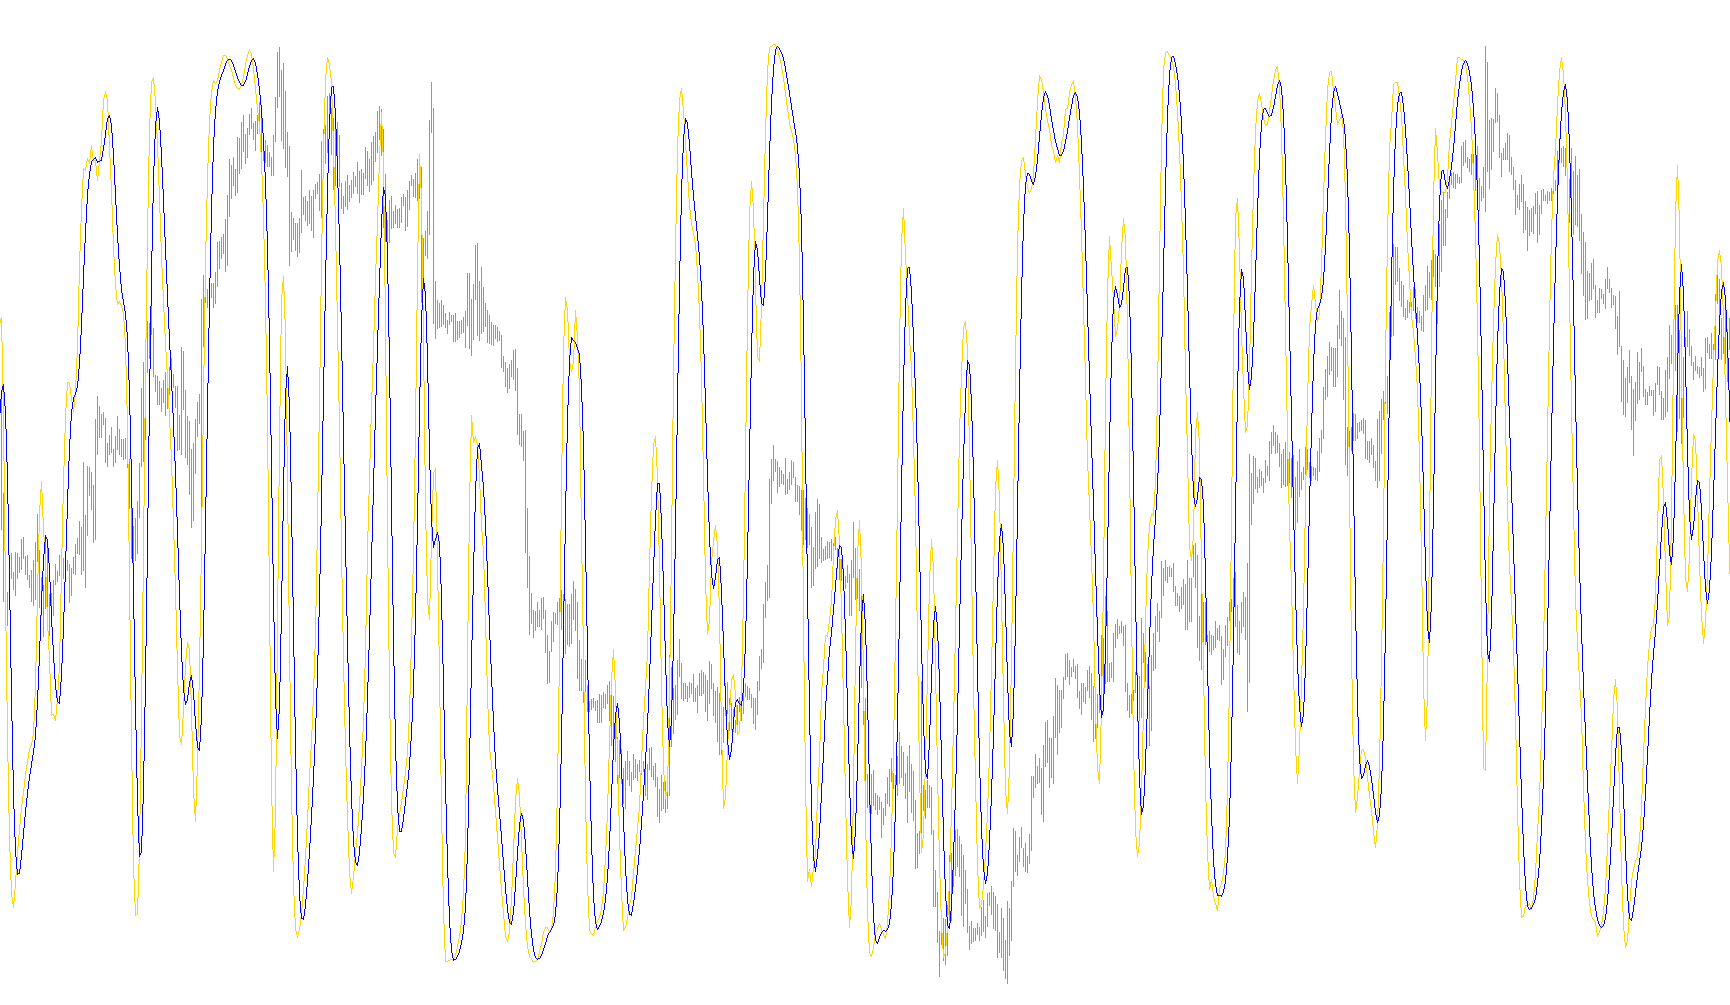
This indicator is designed to provide a smoothed visual representation of market momentum by refining the traditional Stochastic Oscillator. Rather than relying on the raw, often volatile data points provided by standard technical analysis tools, this script applies a specialized averaging logic to create a "slower," more stable signal.
Core Logic and Functionality
The primary objective of this tool is to filter out minor price fluctuations (market noise) to help traders identify clearer trends. It achieves this through three main components:
1. Data Source Integration The script utilizes the Stochastic Oscillator as its foundation. This standard technical indicator measures the location of the current price relative to the range of prices over a specific period, helping to determine if an asset is "overbought" or "oversold."
2. Multi-Point Smoothing Technique Instead of calculating the indicator value based solely on the most recent price candle, the script looks back at the last three data points for both the "Main" line and the "Signal" line. By capturing these three consecutive values, the tool creates a broader context for the current market movement.
3. Three-Point Averaging Calculation For every new point displayed on your chart, the script performs a mathematical average of the three data points mentioned above. Specifically:
- The Main Line: Is calculated by averaging the current and previous two values of the Stochastic Main line.
- The Signal Line: Is calculated by averaging the current and previous two values of the Stochastic Signal line.
Visual Output
The result is a smoothed trajectory displayed in a separate window below your main price chart. By averaging the data over multiple points, the indicator produces lines that are less jagged than standard oscillators. This logic is intended to help traders observe more sustained trends and significant shifts in momentum, potentially reducing the frequency of "false" signals caused by sudden, brief spikes in price volatility.
//+------------------------------------------------------------------+
//|                                                   slow-stich.mq4 |
//|                                     Copyright © 2005, Nick Bilak |
//|                                              beluck[at]gmail.com |
//+------------------------------------------------------------------+
#property copyright "Copyright © 2005, Nick Bilak"

#property indicator_separate_window
#property indicator_buffers 3
#property indicator_color1 Lime
#property indicator_color2 Aqua
//---- input parameters
extern int PK=14;
extern int PD=5;
extern int PS=5;
//---- buffers
double k[];
double d[];

//+------------------------------------------------------------------+
//| Custom indicator initialization function                         |
//+------------------------------------------------------------------+
int init()
  {
   SetIndexStyle(0,DRAW_LINE);
   SetIndexBuffer(0,k);
   SetIndexStyle(1,DRAW_LINE);
   SetIndexBuffer(1,d);
   return(0);
  }
//+------------------------------------------------------------------+
//| Custom indicator iteration function                              |
//+------------------------------------------------------------------+
int start()
  {
   int counted_bars=IndicatorCounted();
   int shift,limit;
   if (counted_bars<0) return(-1);
   if (counted_bars>0) counted_bars--;
   limit=Bars-PK-1;
   if(counted_bars>=PK) limit=Bars-counted_bars-1;

     for(shift=limit;shift>=0;shift--)   {
      d[shift]=(iStochastic(NULL,0,PK,PD,PS,MODE_SMA,1,MODE_SIGNAL,shift)+iStochastic(NULL,0,PK,PD,PS,MODE_SMA,1,MODE_SIGNAL,shift+1)+iStochastic(NULL,0,PK,PD,PS,MODE_SMA,1,MODE_SIGNAL,shift+2))/3.0;
      k[shift]=(iStochastic(NULL,0,PK,PD,PS,MODE_SMA,1,MODE_MAIN,shift)+iStochastic(NULL,0,PK,PD,PS,MODE_SMA,1,MODE_MAIN,shift+1)+iStochastic(NULL,0,PK,PD,PS,MODE_SMA,1,MODE_MAIN,shift+2))/3.0;
     }
   return(0);
  }
//+------------------------------------------------------------------+
Comments