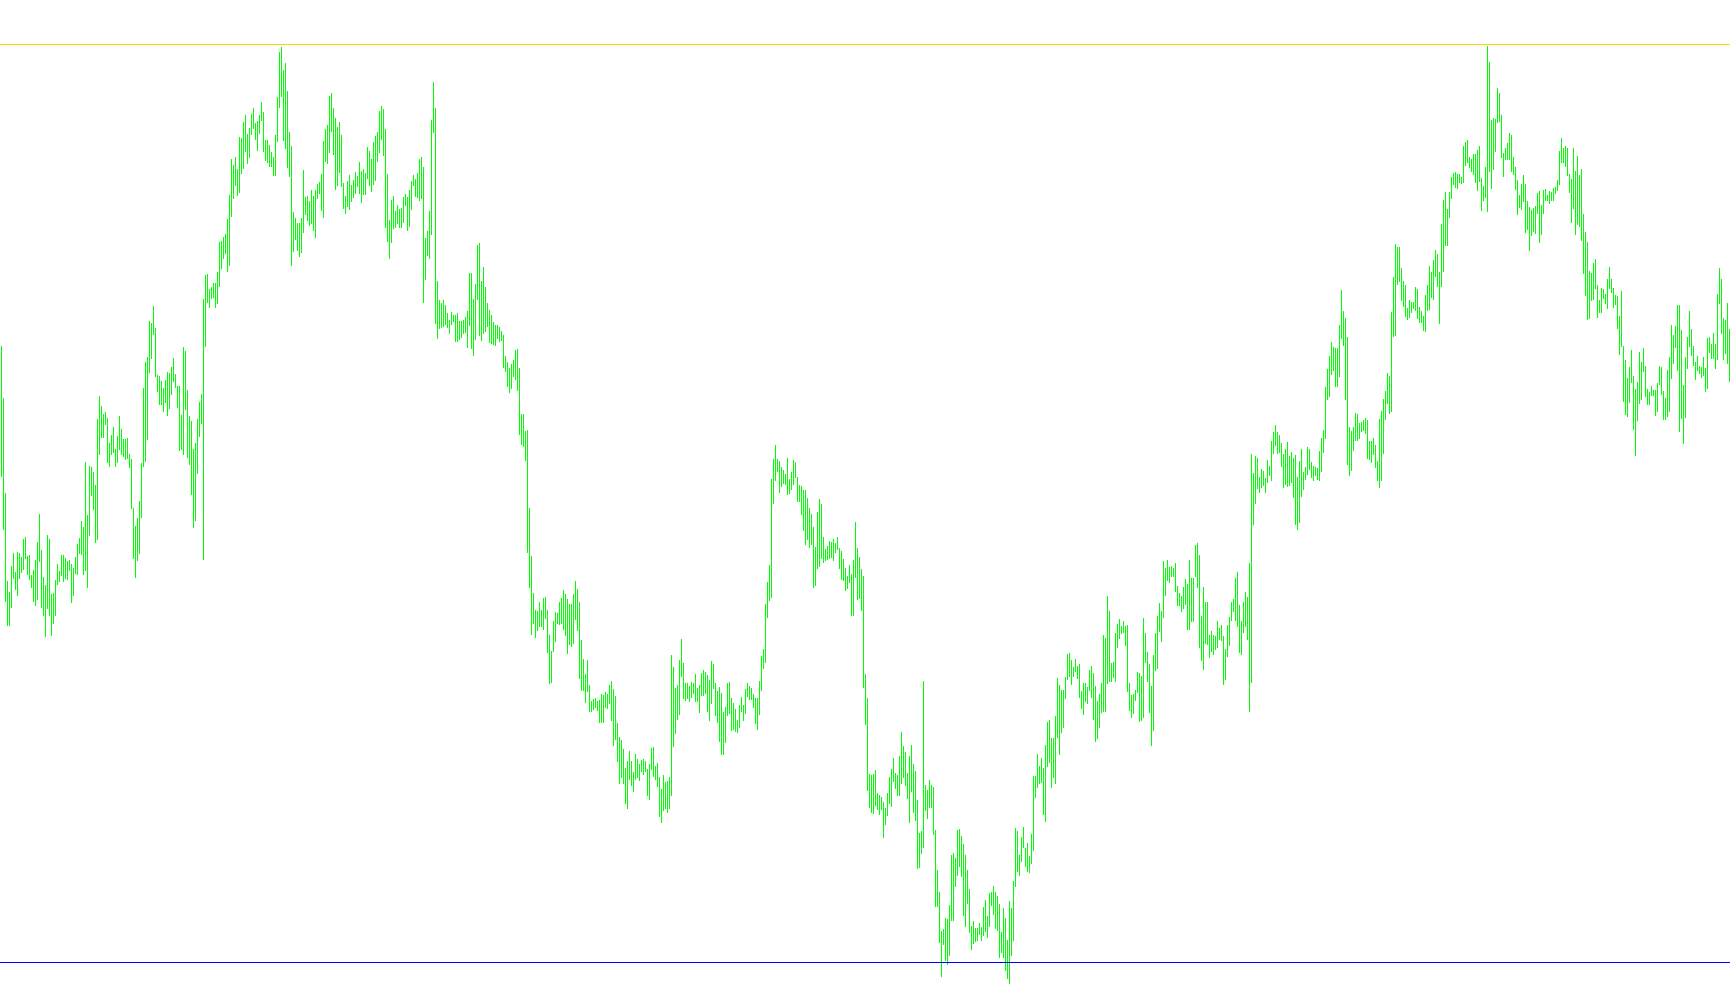
This tool is designed to analyze market trends by identifying underlying rhythmic patterns or "cycles" within price movements. Rather than looking at simple price action, it attempts to isolate the repeating waves—similar to a sine wave in physics—that often dictate the ebb and flow of financial markets.
Core Logic Overview
The script follows a sophisticated three-step process to translate raw market data into visual cycles:
1. Data Smoothing and Preparation Before performing any complex calculations, the tool takes the price action (specifically the midpoint between the high and low of each candle) and applies a smoothing filter. This reduces "noise" from erratic price spikes, ensuring that the resulting analysis reflects the primary trend rather than temporary fluctuations.
2. Cycle Detection and Frequency Analysis Once the data is smoothed, the algorithm calculates the "Cycle." It uses a specific mathematical formula to determine how the price fluctuates over time. It then performs a frequency analysis to find the "Dominant Cycle"—the most prominent repeating wave in the current market environment. It essentially asks: "What is the heartbeat of this market right now?"
3. Phase Calculation and Forecasting After identifying the cycle, the tool determines the "Phase," which tells us where we are currently positioned within that wave (e.g., are we at a peak, a trough, or in the middle of a move?).
Based on this phase, the script generates two primary visual outputs:
- The Sine Wave: This represents the current cycle of the market. It helps visualize the current momentum and where the price sits relative to its rhythmic pattern.
- The Lead Sine (Leading Indicator): By calculating a "lead" value, the tool attempts to project what the next phase of the cycle might look like. It provides a visual suggestion of the direction the cycle is heading, aiming to offer a glimpse into potential upcoming movements.
Summary for the User
Think of this indicator as a "rhythm tracker." While standard indicators might tell you if the price is going up or down based on past data, this script tries to understand the tempo of the market. By identifying the recurring waves in price, it provides a visual representation of the current cycle and a projected look at where that cycle might move next.
//+------------------------------------------------------------------+
//|                                                    Sinewave2.mq4 |
//|                                                                  |
//| Sinewave                                                         |
//|                                                                  |
//| Algorithm taken from book                                        |
//|     "Cybernetics Analysis for Stock and Futures"                 |
//| by John F. Ehlers                                                |
//|                                                                  |
//|                                              contact@mqlsoft.com |
//|                                          http://www.mqlsoft.com/ |
//+------------------------------------------------------------------+
#property copyright "Coded by Witold Wozniak"
#property link      "www.mqlsoft.com"

#property indicator_separate_window
#property indicator_buffers 2
#property indicator_color1 Red
#property indicator_color2 Blue

#property indicator_minimum -1
#property indicator_maximum 1
#property indicator_level1 0

double Sine[];
double LeadSine[];
double Cycle[];
double Smooth[];

extern double Alpha = 0.07;
int buffers = 0;
int drawBegin = 0;

double tempReal, rad2Deg, deg2Rad;

int init() {
    drawBegin = 8;
    initBuffer(Sine, "Sine", DRAW_LINE);
    initBuffer(LeadSine, "Lead", DRAW_LINE);
    initBuffer(Cycle);
    initBuffer(Smooth);
    IndicatorBuffers(buffers);
    IndicatorShortName("Sinewave [" + DoubleToStr(Alpha, 2) + "]");
    tempReal = MathArctan(1.0);
    rad2Deg = 45.0 / tempReal;
    deg2Rad = 1.0 / rad2Deg;
    return (0);
}

int start() {
    if (Bars <= drawBegin) return (0);
    int countedBars = IndicatorCounted();
    if (countedBars < 0) return (-1);
    if (countedBars > 0) countedBars--;
    int s, limit = Bars - countedBars - 1;
    for (s = limit; s >= 0; s--) {
        Smooth[s] = (P(s) + 2.0 * P(s + 1) + 2.0 * P(s + 2) + P(s + 3)) / 6.0;
        Cycle[s] = (1.0 - 0.5 * Alpha) * (1.0 - 0.5 * Alpha) * (Smooth[s] - 2.0 * Smooth[s + 1] + Smooth[s + 2])
            + 2.0 * (1.0 - Alpha) * Cycle[s + 1]
            - (1.0 - Alpha) * (1.0 - Alpha) * Cycle[s + 2];
        double period = iCustom(0, 0, "CyclePeriod", Alpha, 0, s);
        int DCPeriod = MathFloor(period);
        double RealPart = 0.0;
        double ImagPart = 0.0;
        for (int count = 0; count < DCPeriod; count++) {
            RealPart += MathSin(deg2Rad * 360.0 * count / DCPeriod) * Cycle[s + count];
            ImagPart += MathCos(deg2Rad * 360.0 * count / DCPeriod) * Cycle[s + count];
        }
        double DCPhase;
        if (MathAbs(ImagPart) > 0.0000001) {
            DCPhase = rad2Deg * MathArctan(RealPart / ImagPart);
        } else if (MathAbs(ImagPart) <= 0.0000001) {
    	      if (RealPart >= 0.0) {
    	          DCPhase = 90.0;
    	      } else {
    	          DCPhase = -90.0;
    	      }
        }
        DCPhase += 90.0;
        if (ImagPart < 0) {
            DCPhase += 180.0;
        }
        if (DCPhase > 315.0) {
            DCPhase -= 360.0;
        }
        Sine[s] = MathSin(DCPhase * deg2Rad);
        LeadSine[s] = MathSin((DCPhase + 45.0) * deg2Rad);
        if (DCPhase == 180 && LeadSine[s + 1] > 0) {
            LeadSine[s] = MathSin(45 * deg2Rad);
        }
        if (DCPhase == 0 && LeadSine[s + 1] < 0) {
            LeadSine[s] = MathSin(225 * deg2Rad);
        }
    }
    return (0);
}

double P(int index) {
    return ((High[index] + Low[index]) / 2.0);
}

void initBuffer(double array[], string label = "", int type = DRAW_NONE, int arrow = 0, int style = EMPTY, int width = EMPTY, color clr = CLR_NONE) {
    SetIndexBuffer(buffers, array);
    SetIndexLabel(buffers, label);
    SetIndexEmptyValue(buffers, EMPTY_VALUE);
    SetIndexDrawBegin(buffers, drawBegin);
    SetIndexShift(buffers, 0);
    SetIndexStyle(buffers, type, style, width);
    SetIndexArrow(buffers, arrow);
    buffers++;
}
Comments