SMA_Angle
Indicator

SMA_Angle

iMA

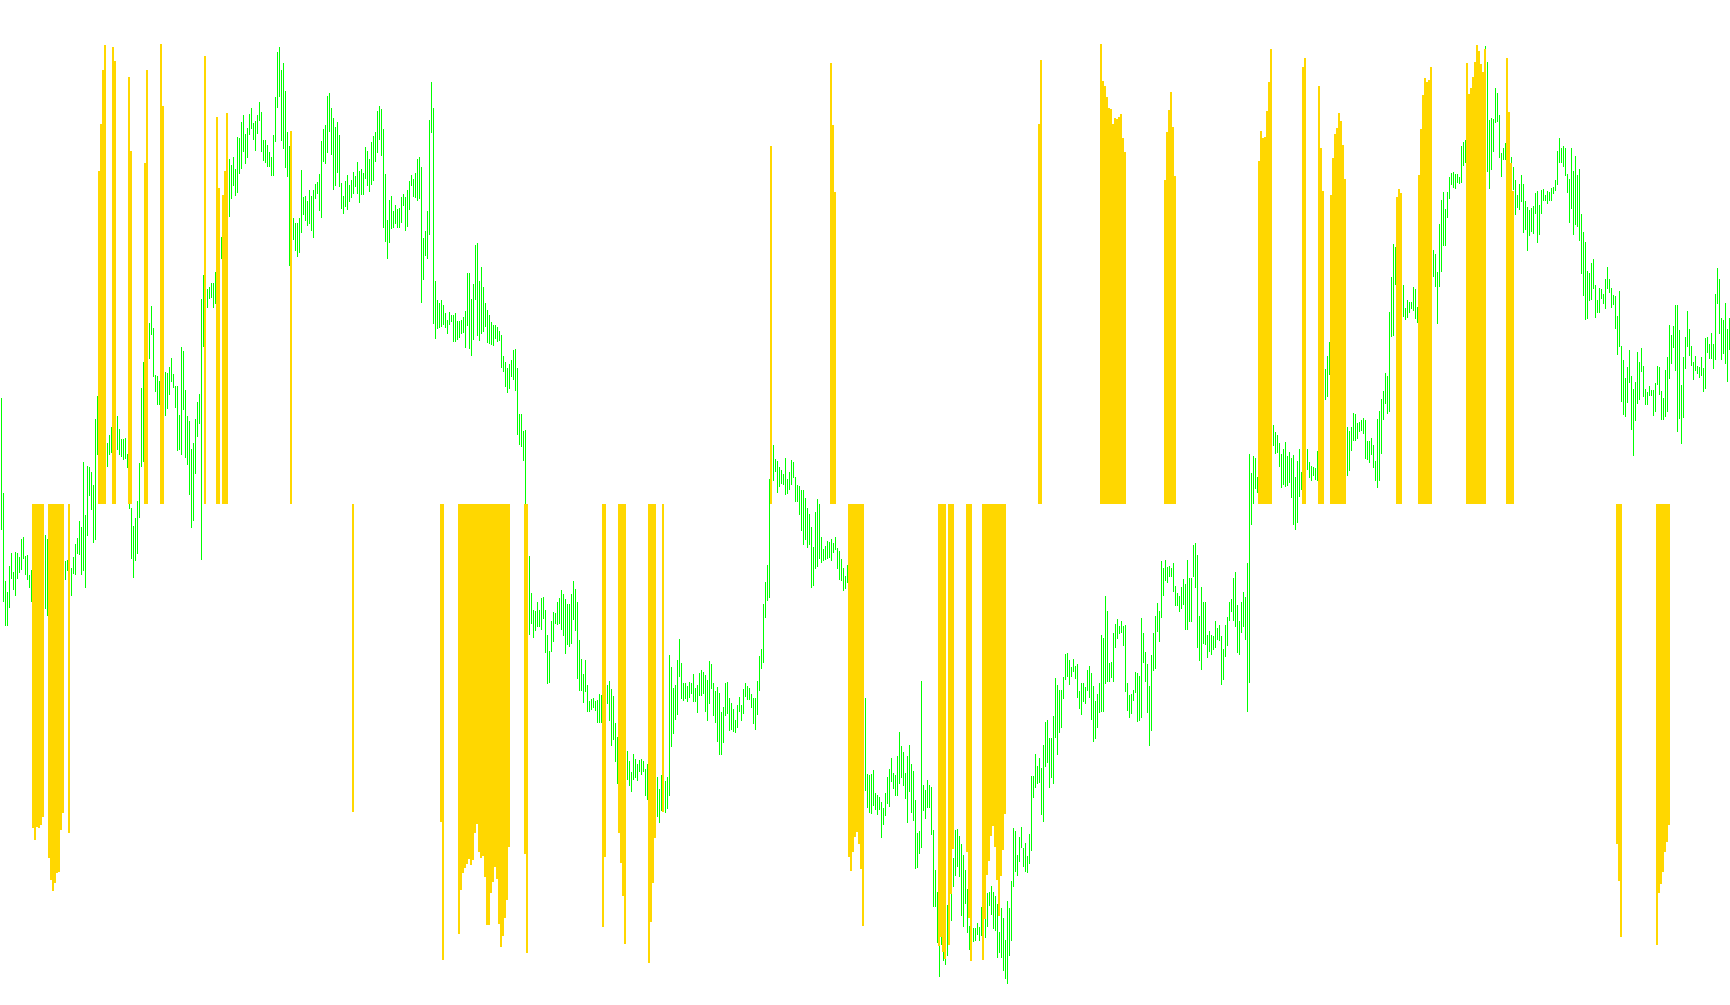
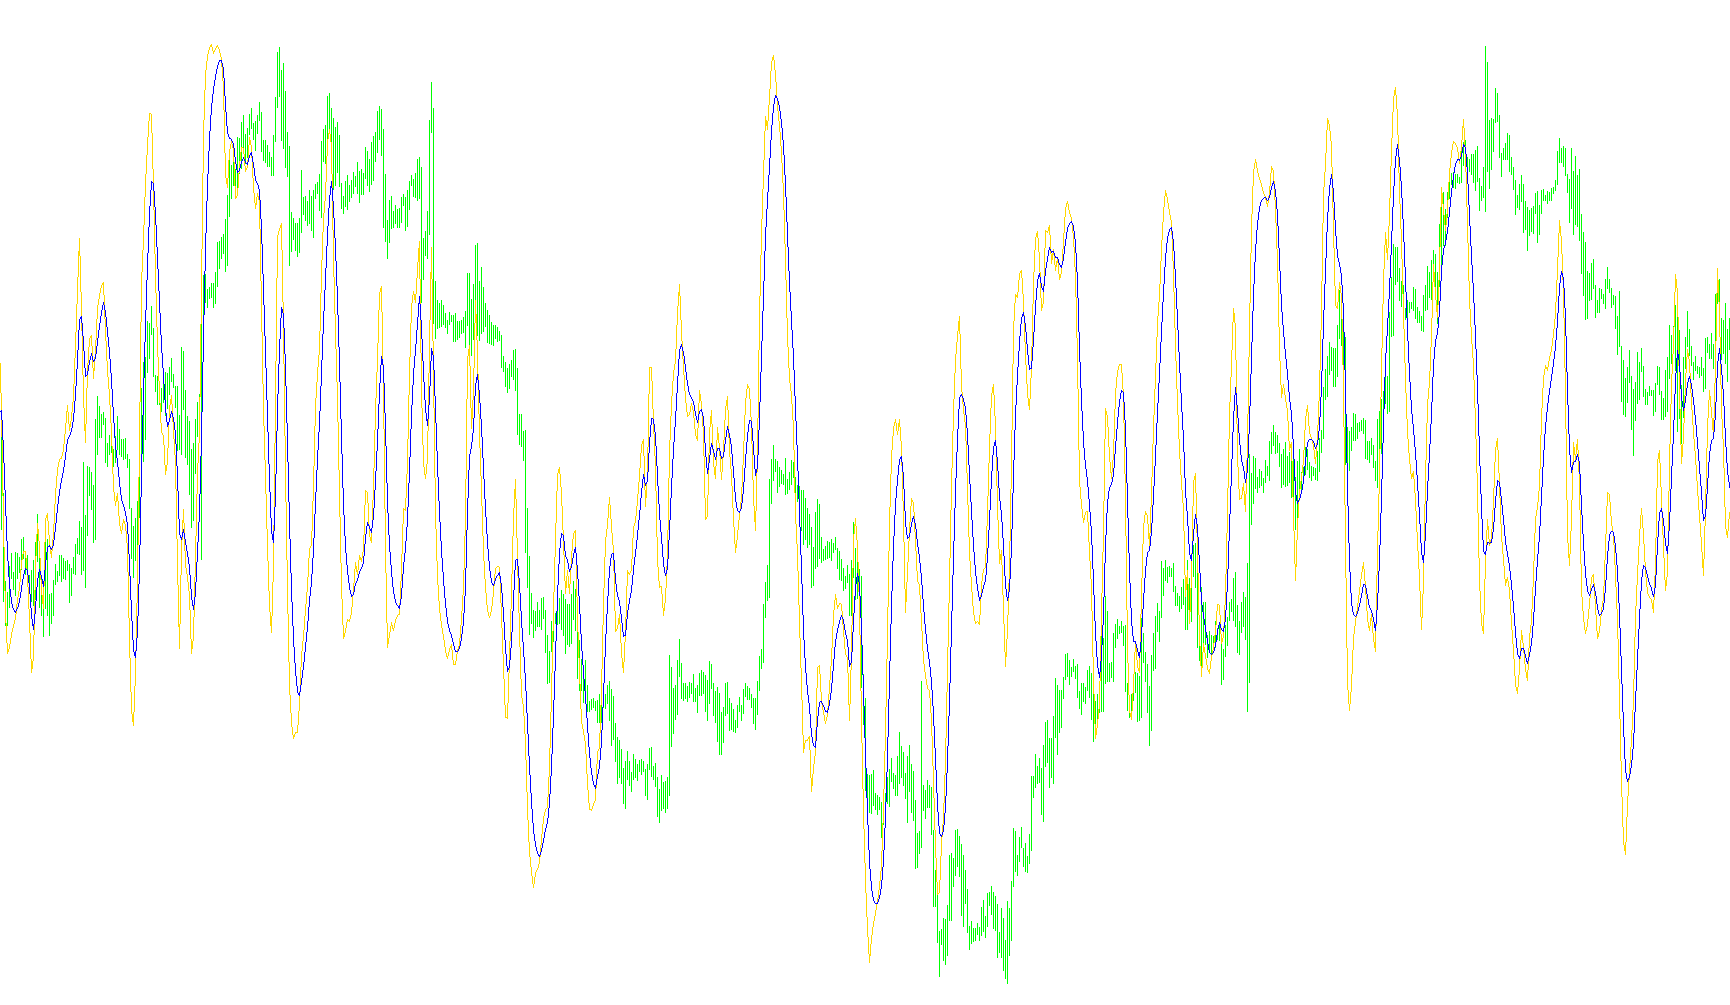
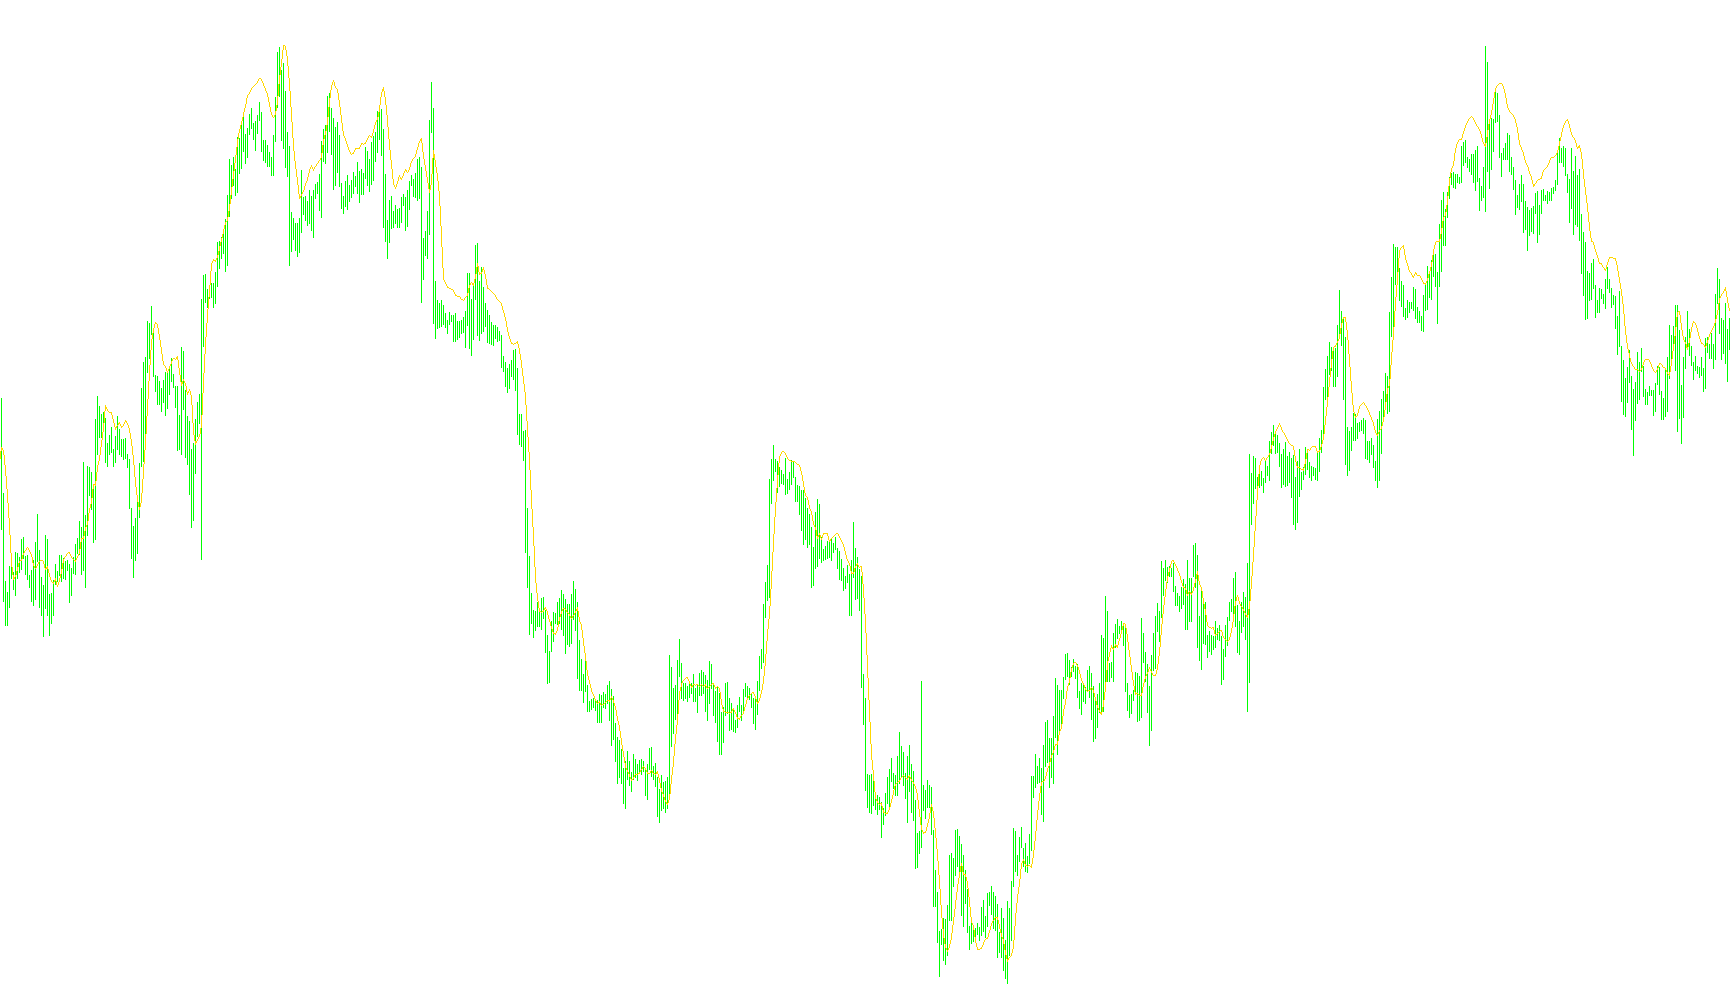
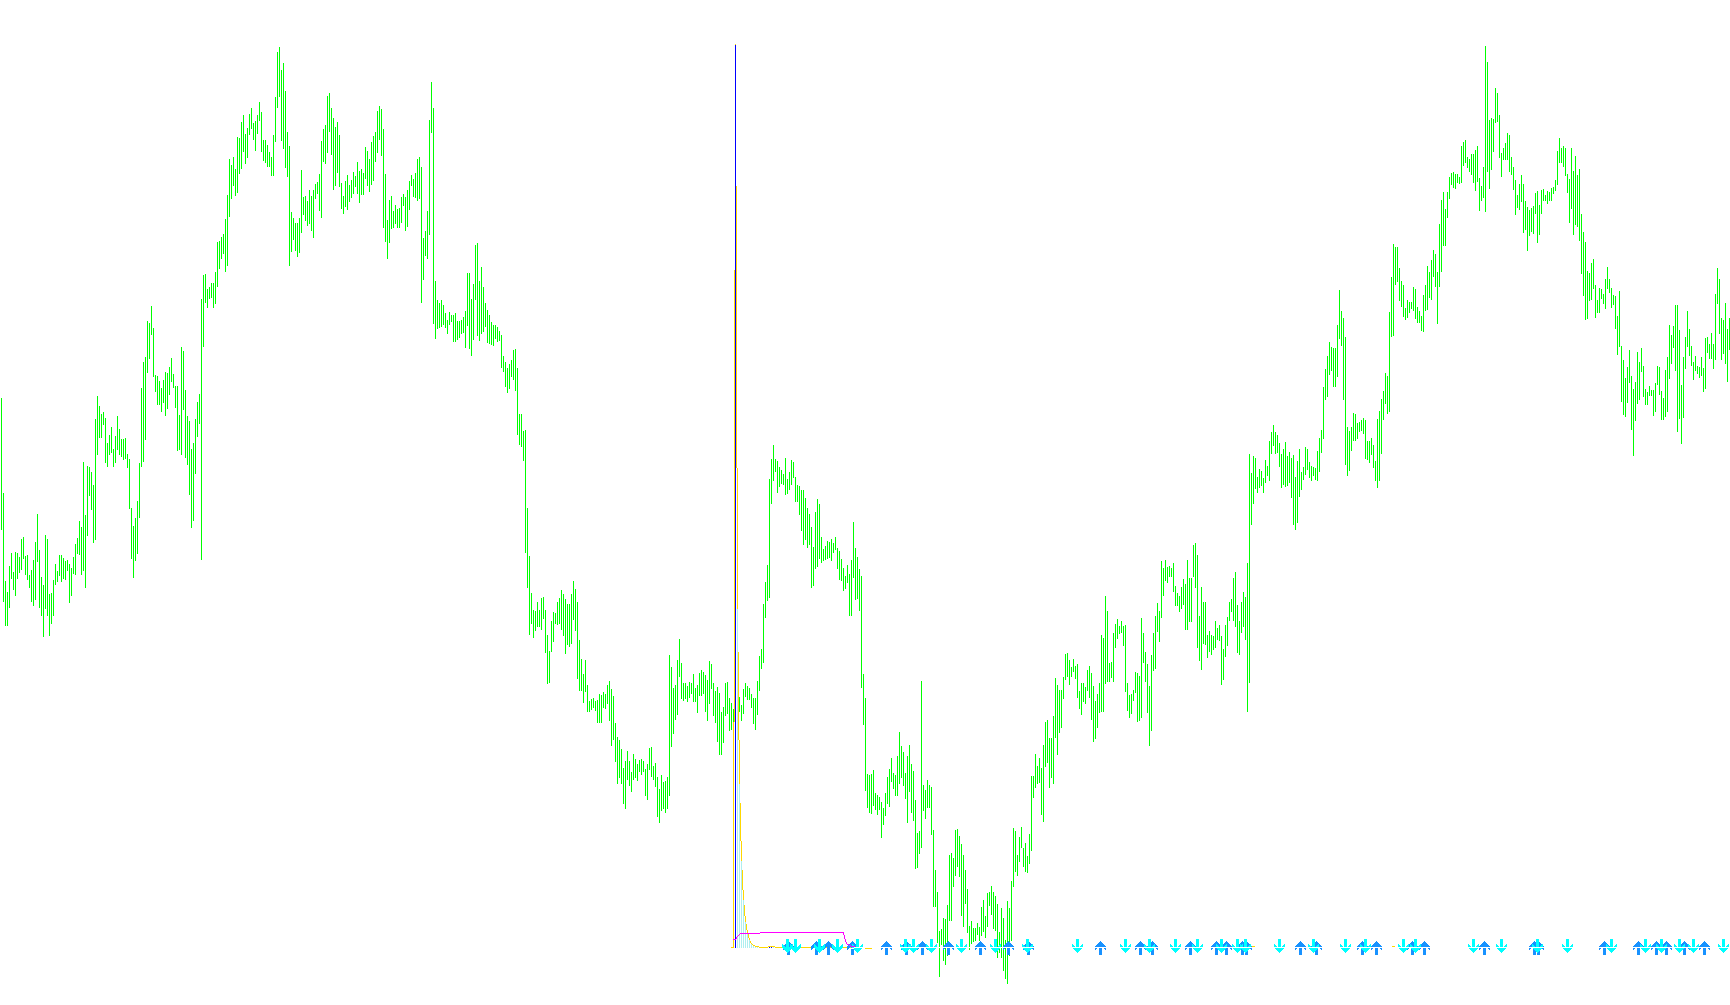
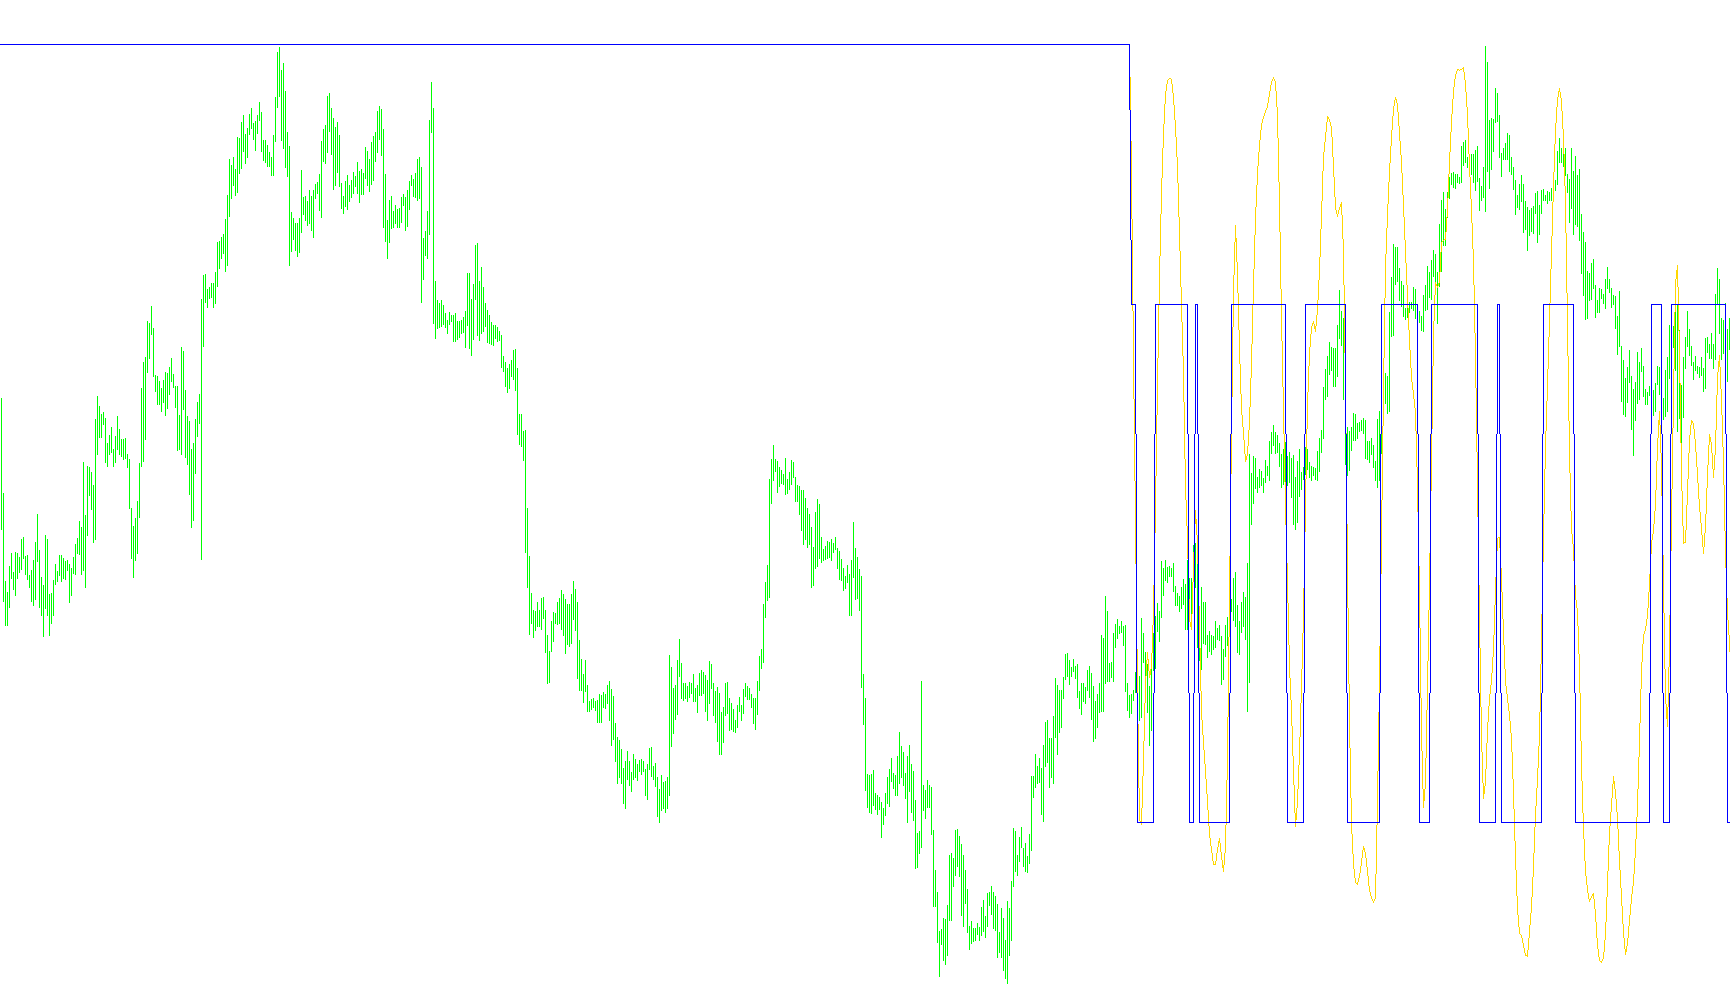
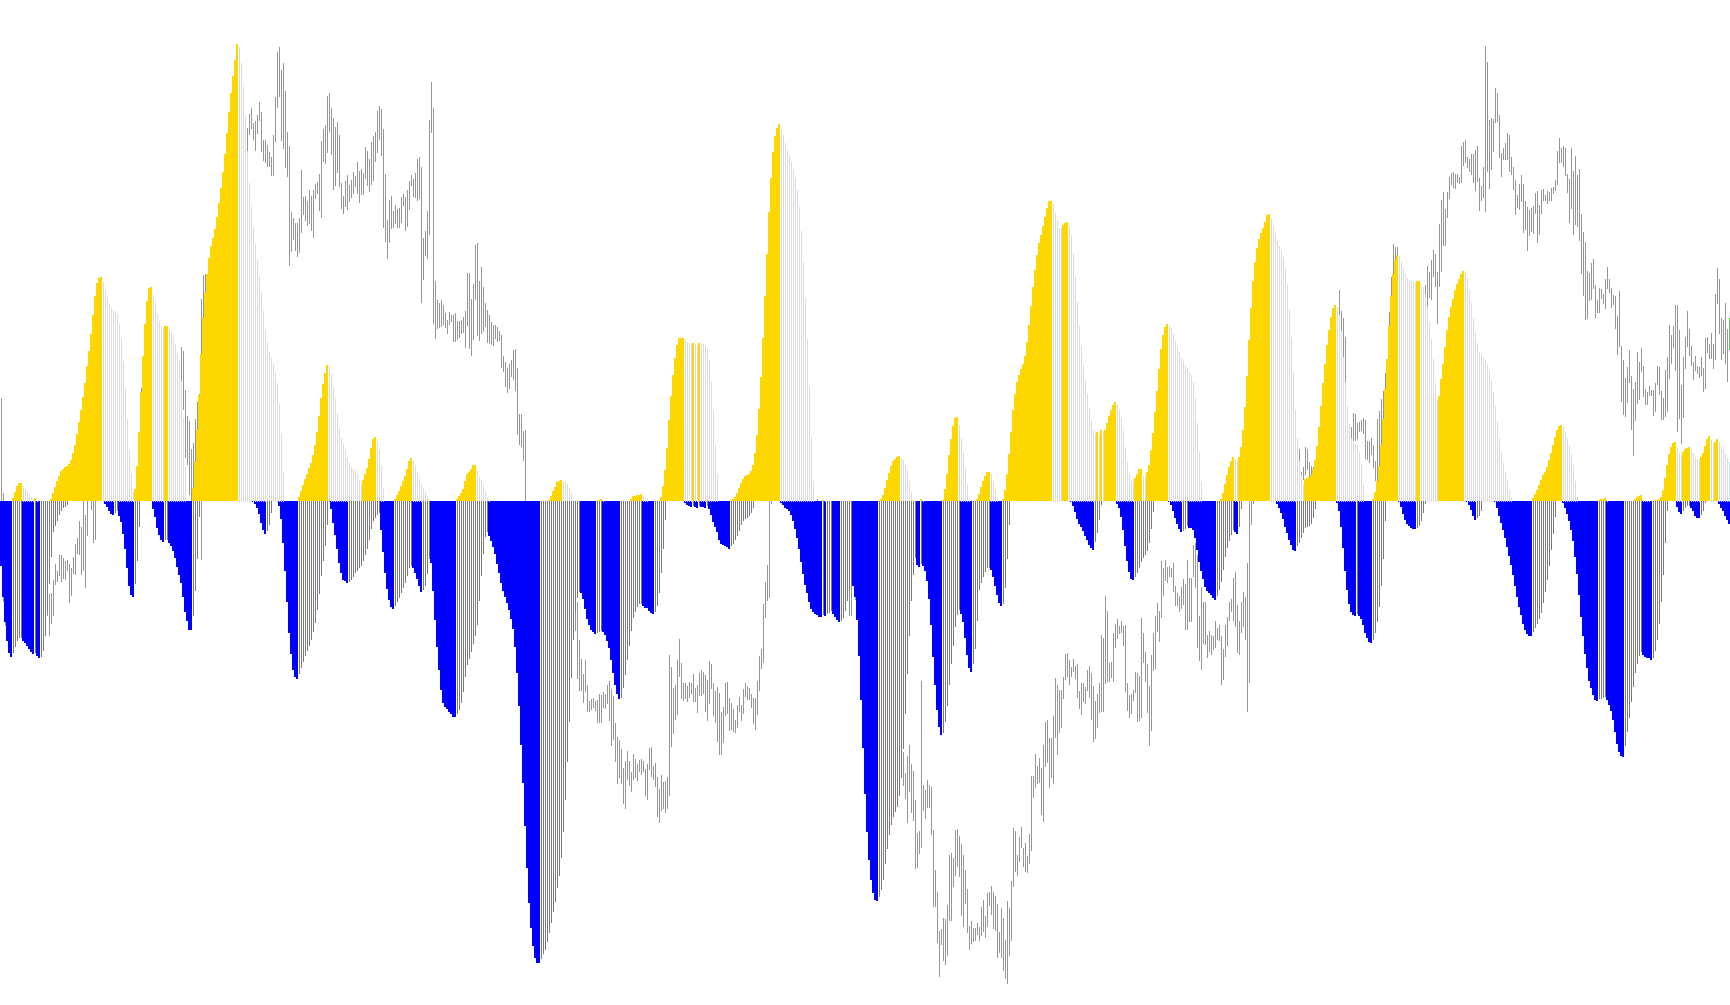
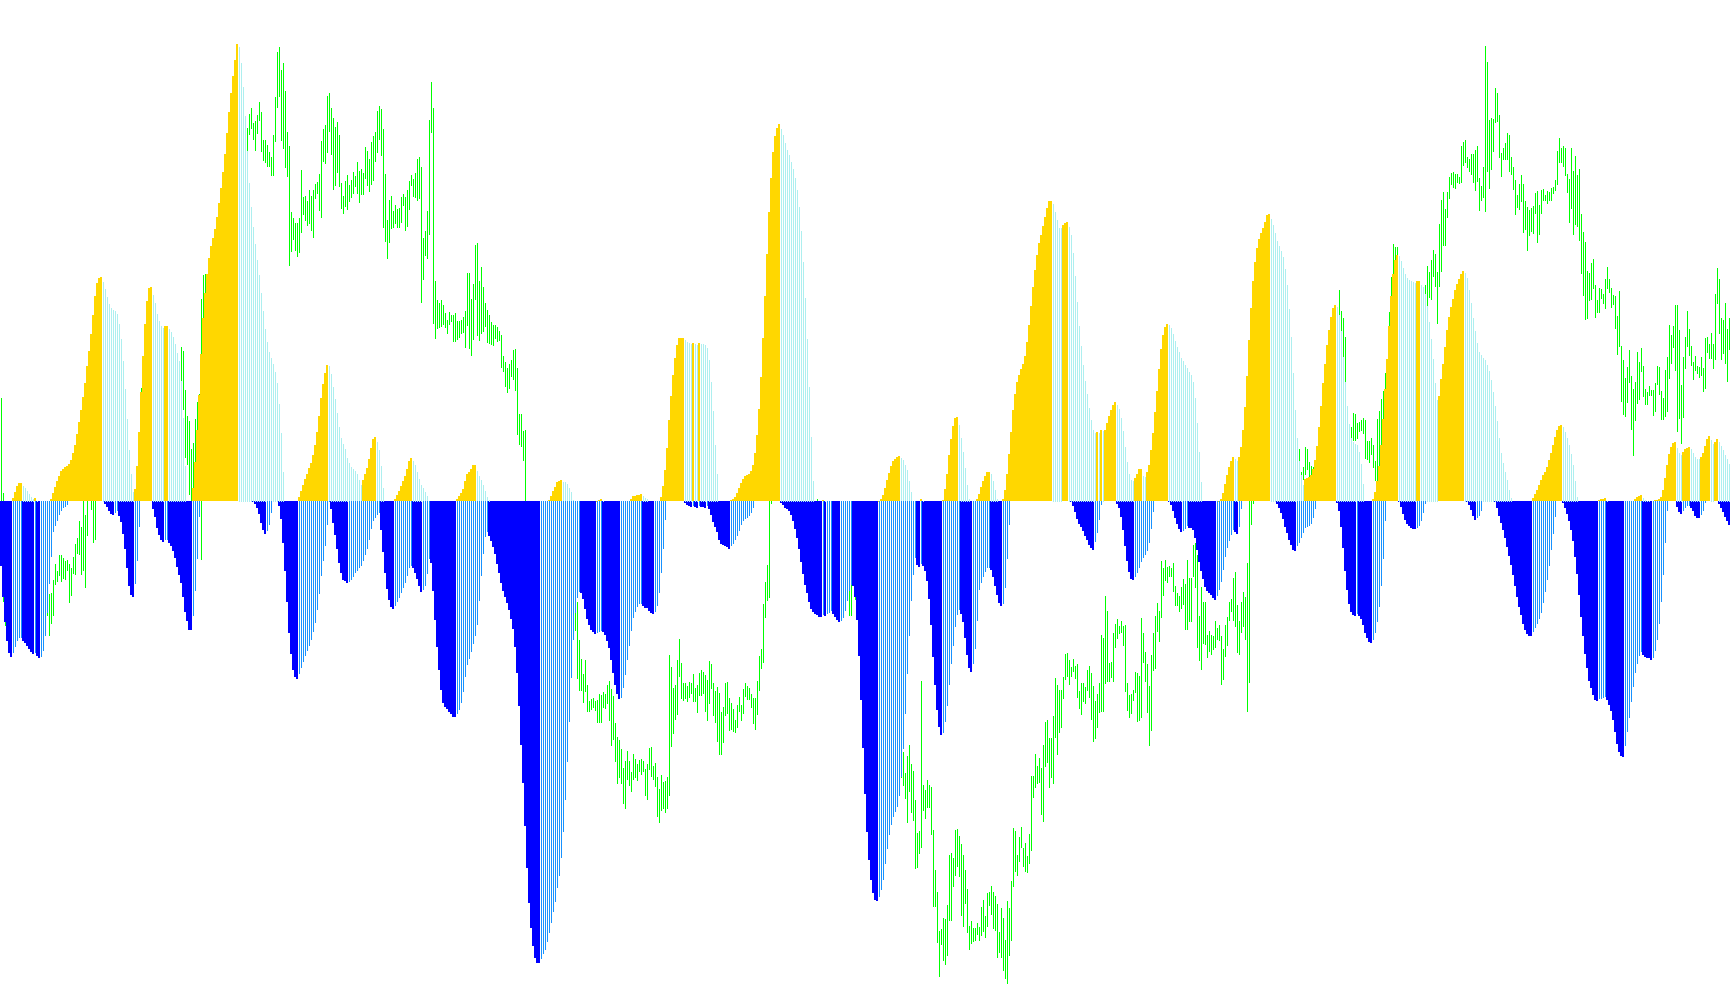
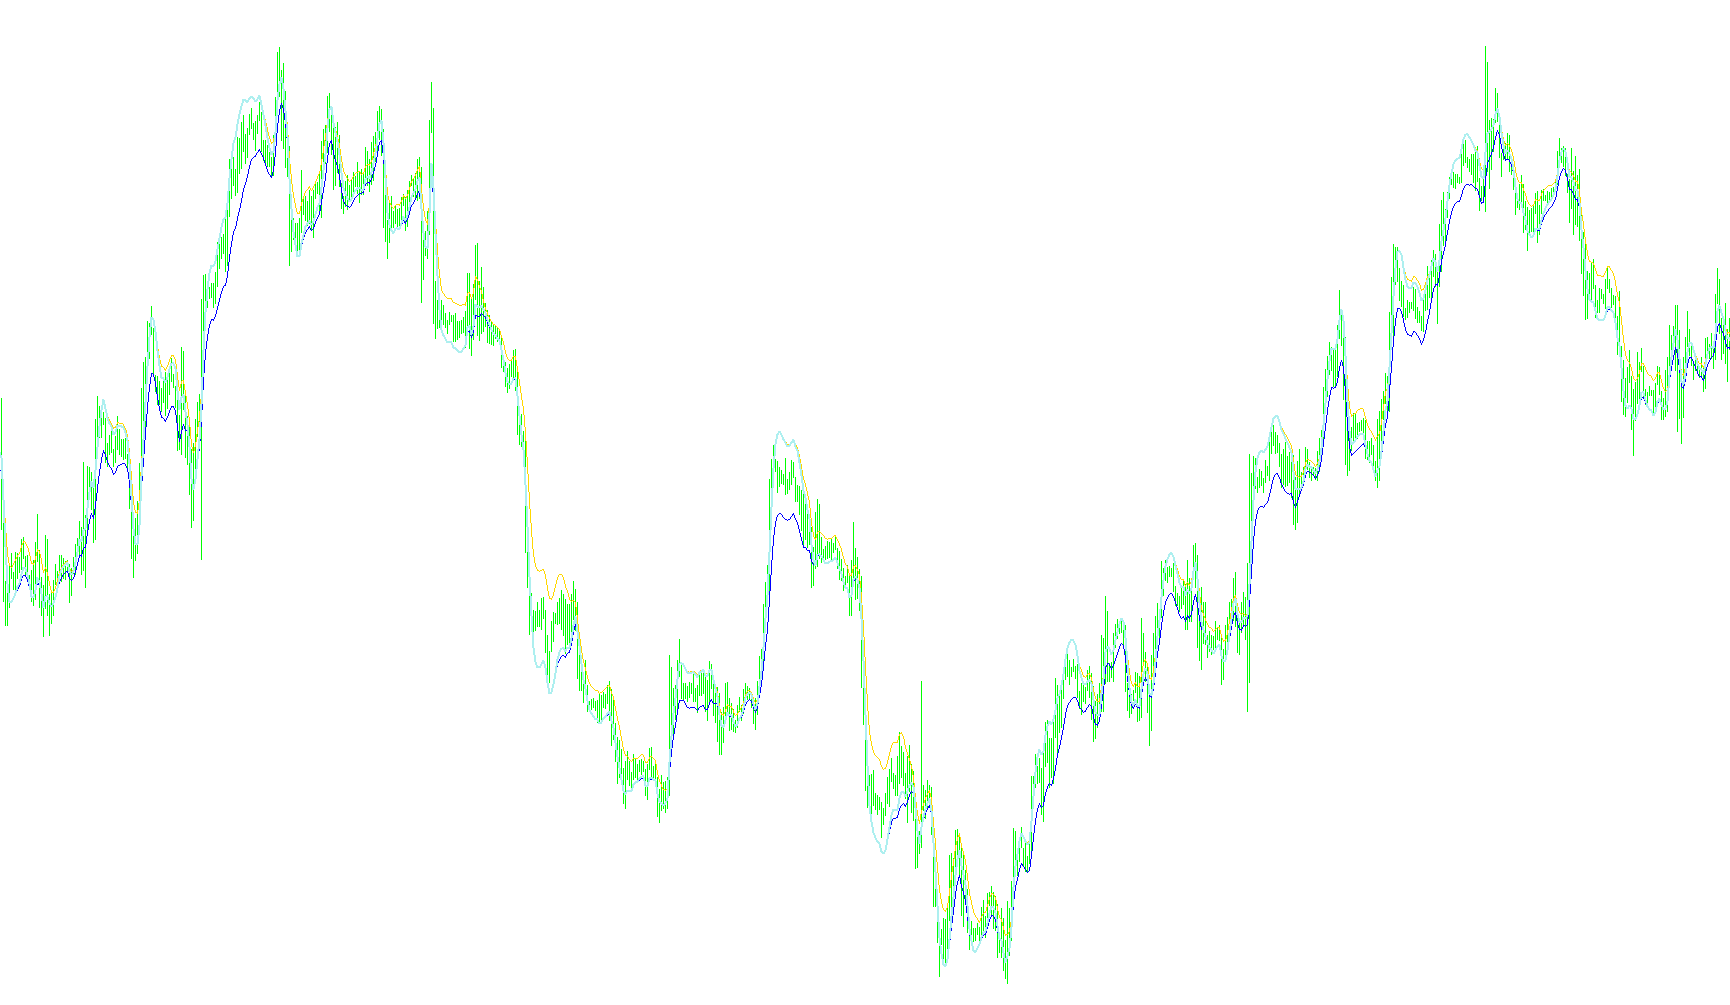
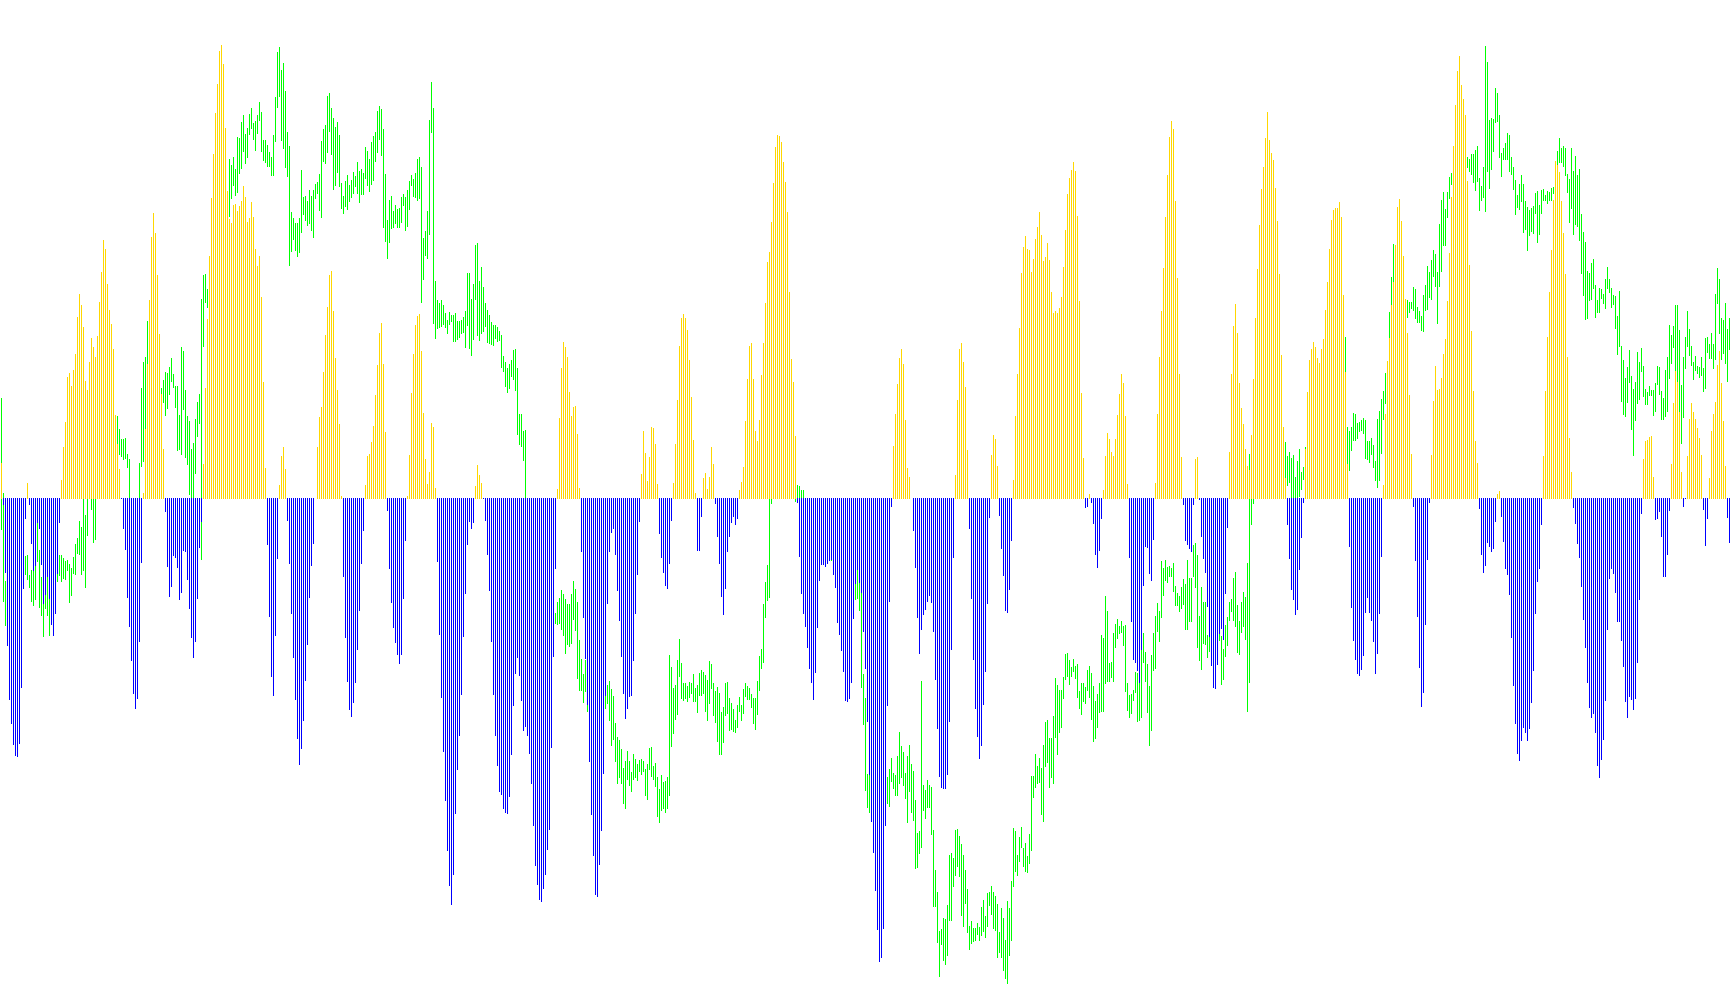
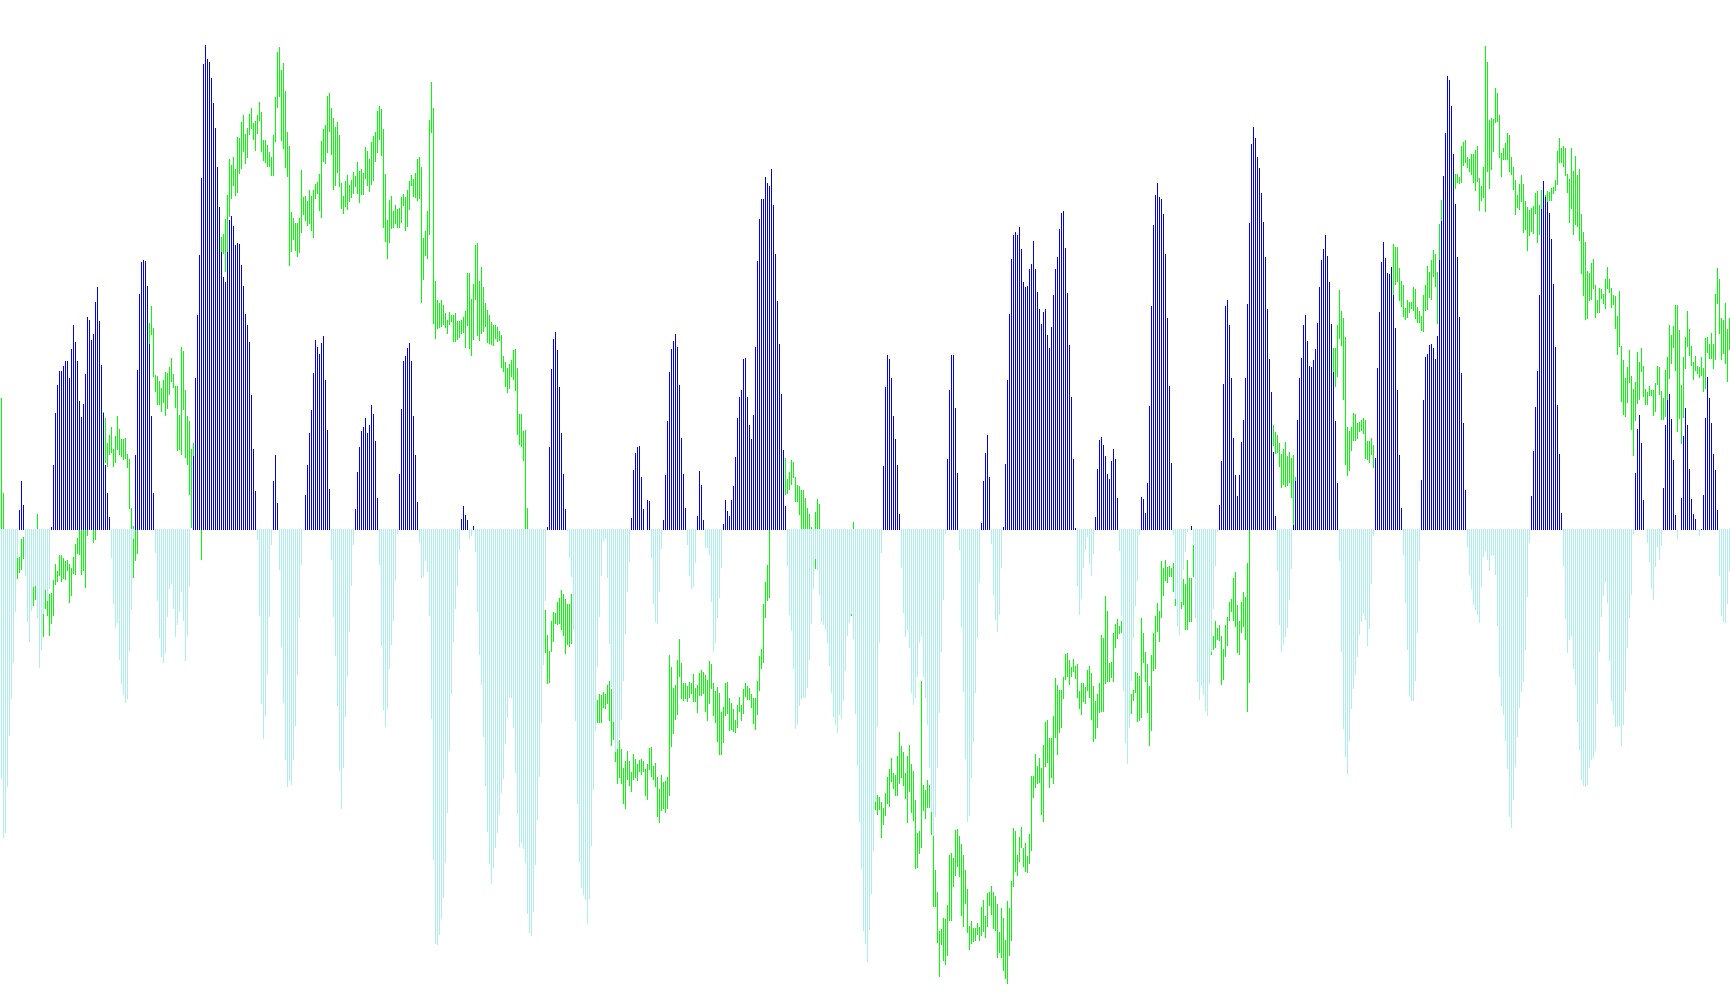
This indicator quantifies the directional slope of a Simple Moving Average to identify momentum strength or equilibrium states based on specific angular variance.

smC4Scalper_Candles_v3.1_trixBarsCW
Indicator

smC4Scalper_Candles_v3.1_trixBarsCW

iMAiMAOnArray

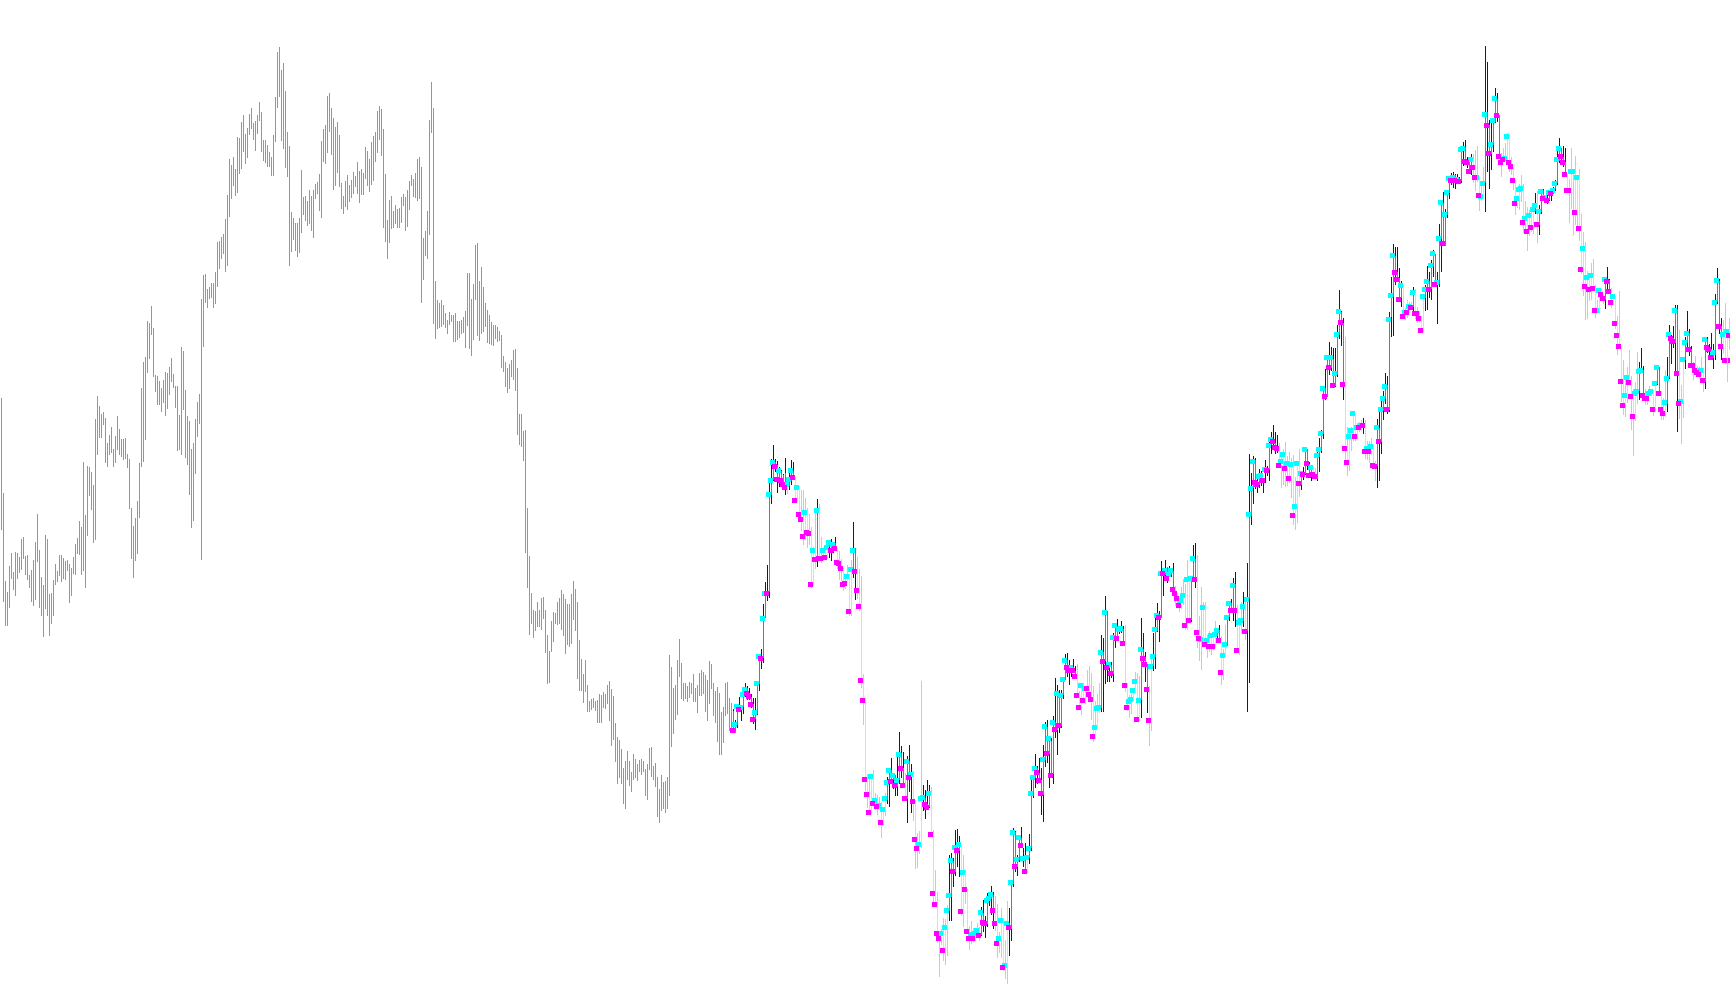
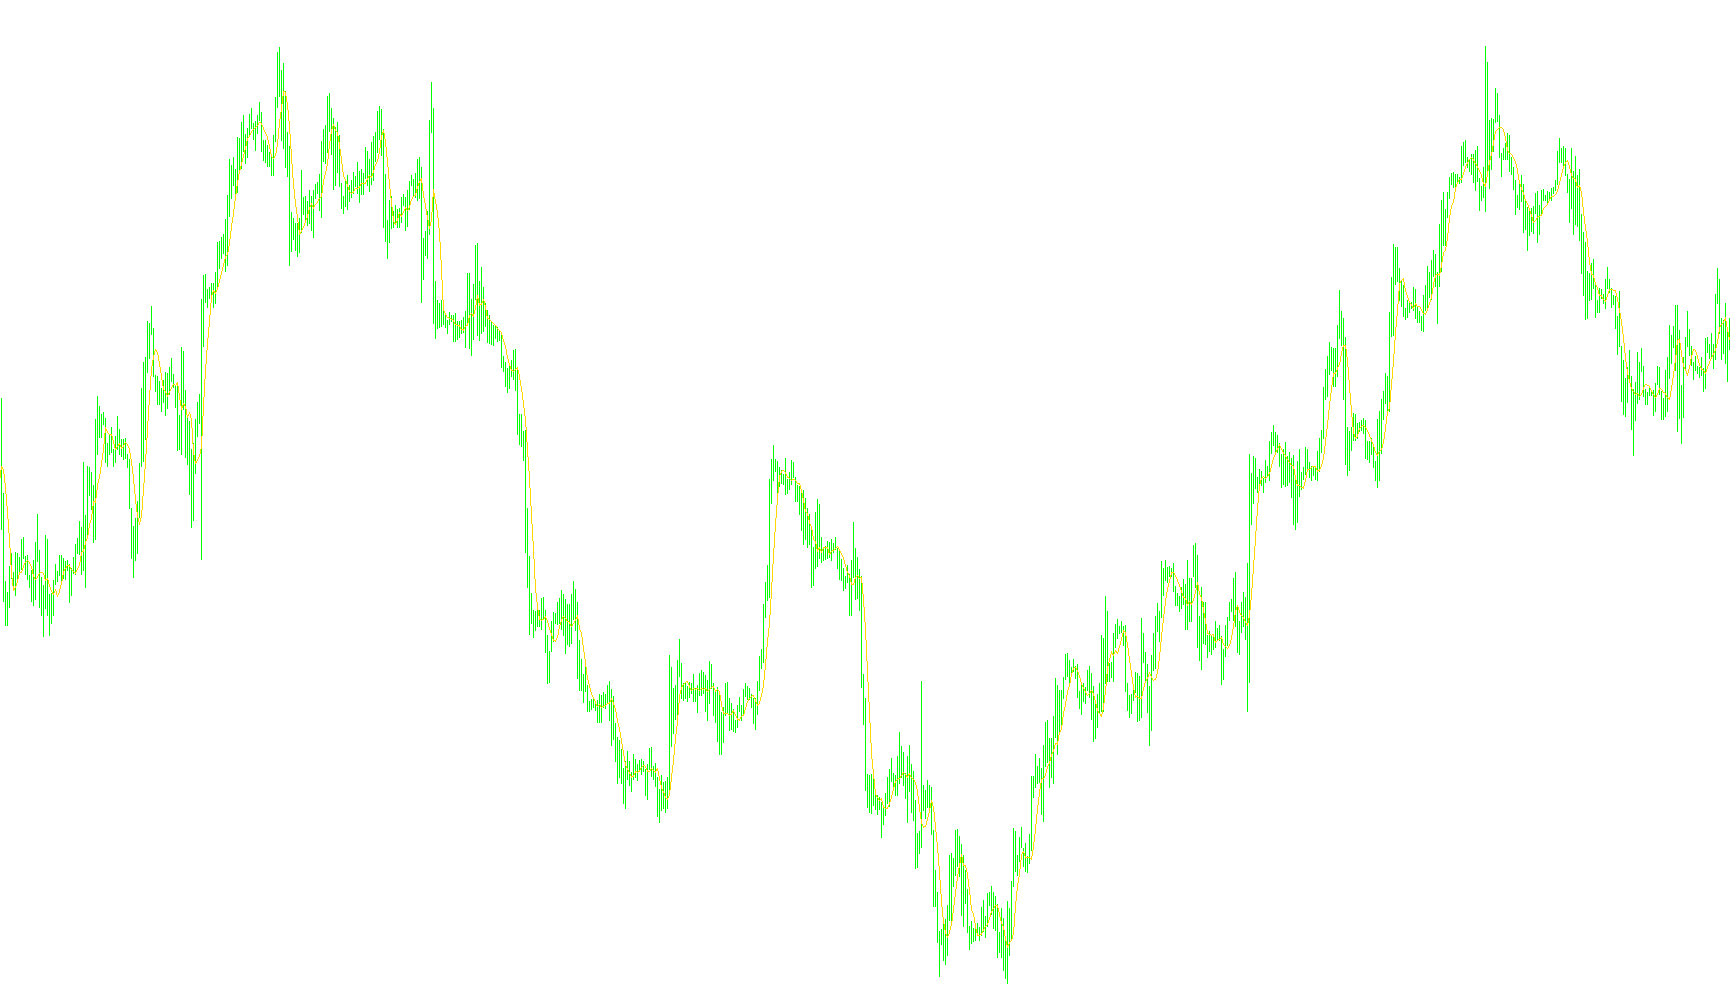
This indicator utilizes a nested Triple Exponential Moving Average (TRIX) architecture to calculate the rate of change and dynamically re-orient candle geometries based on bullish or bearish momentum shifts.

SmCCI-2
Indicator

SmCCI-2

iCCI

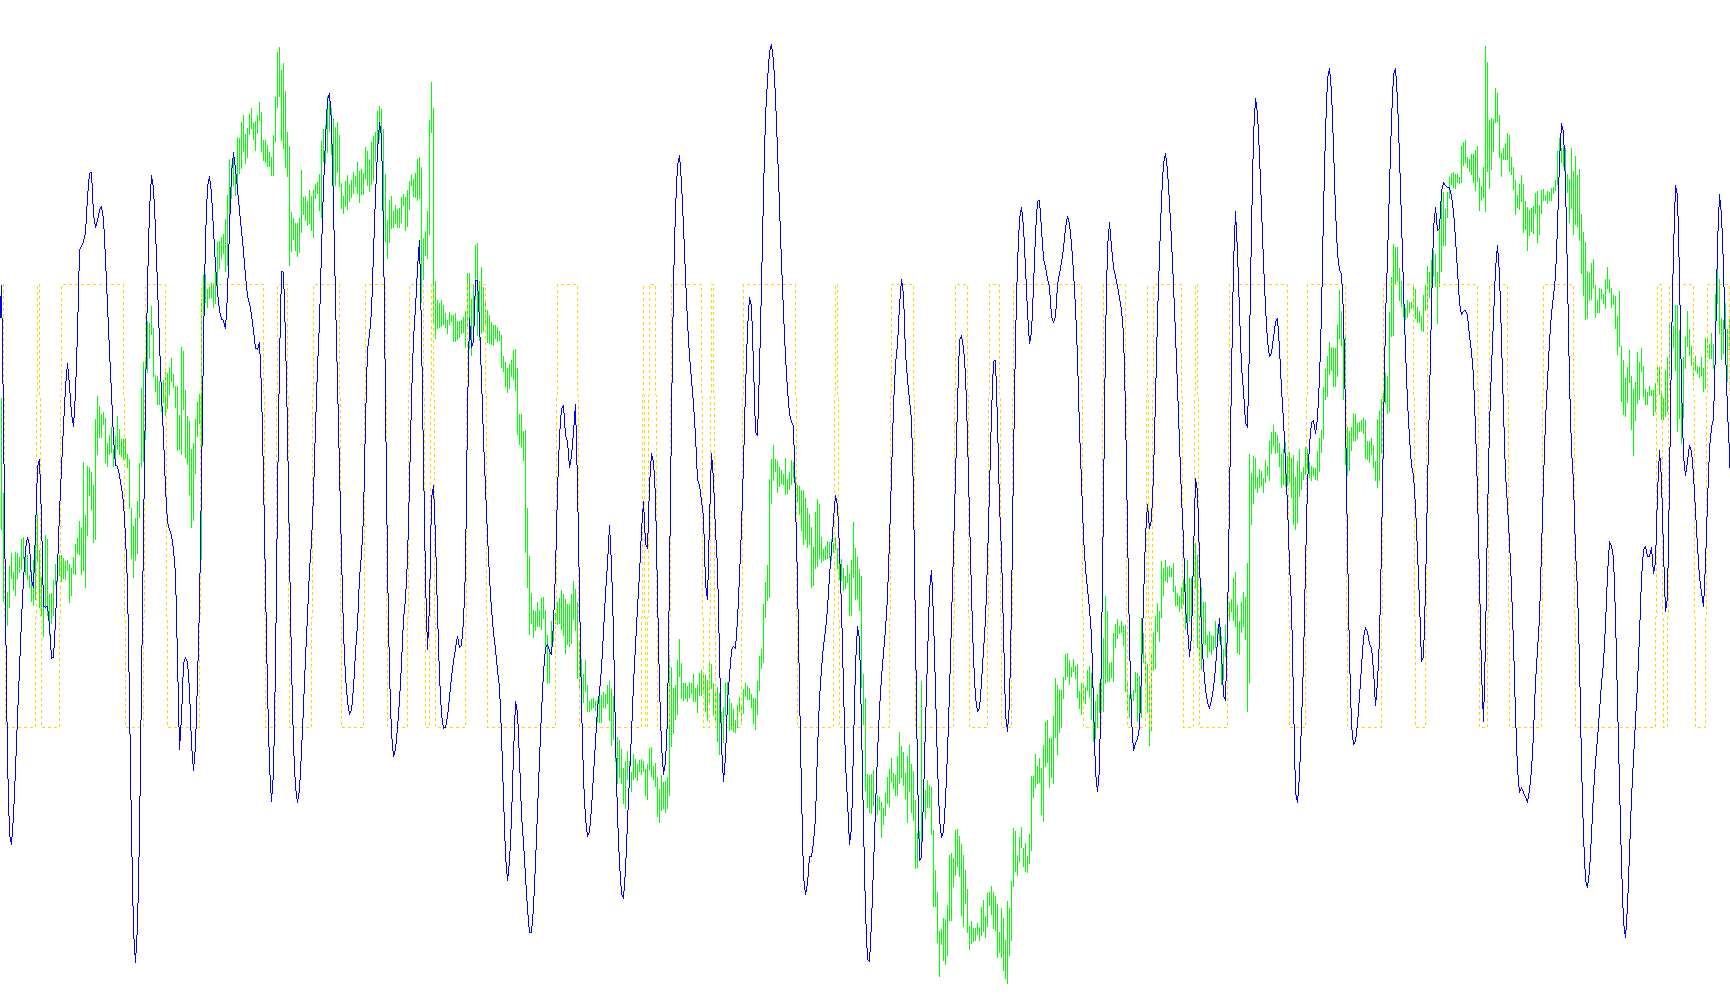
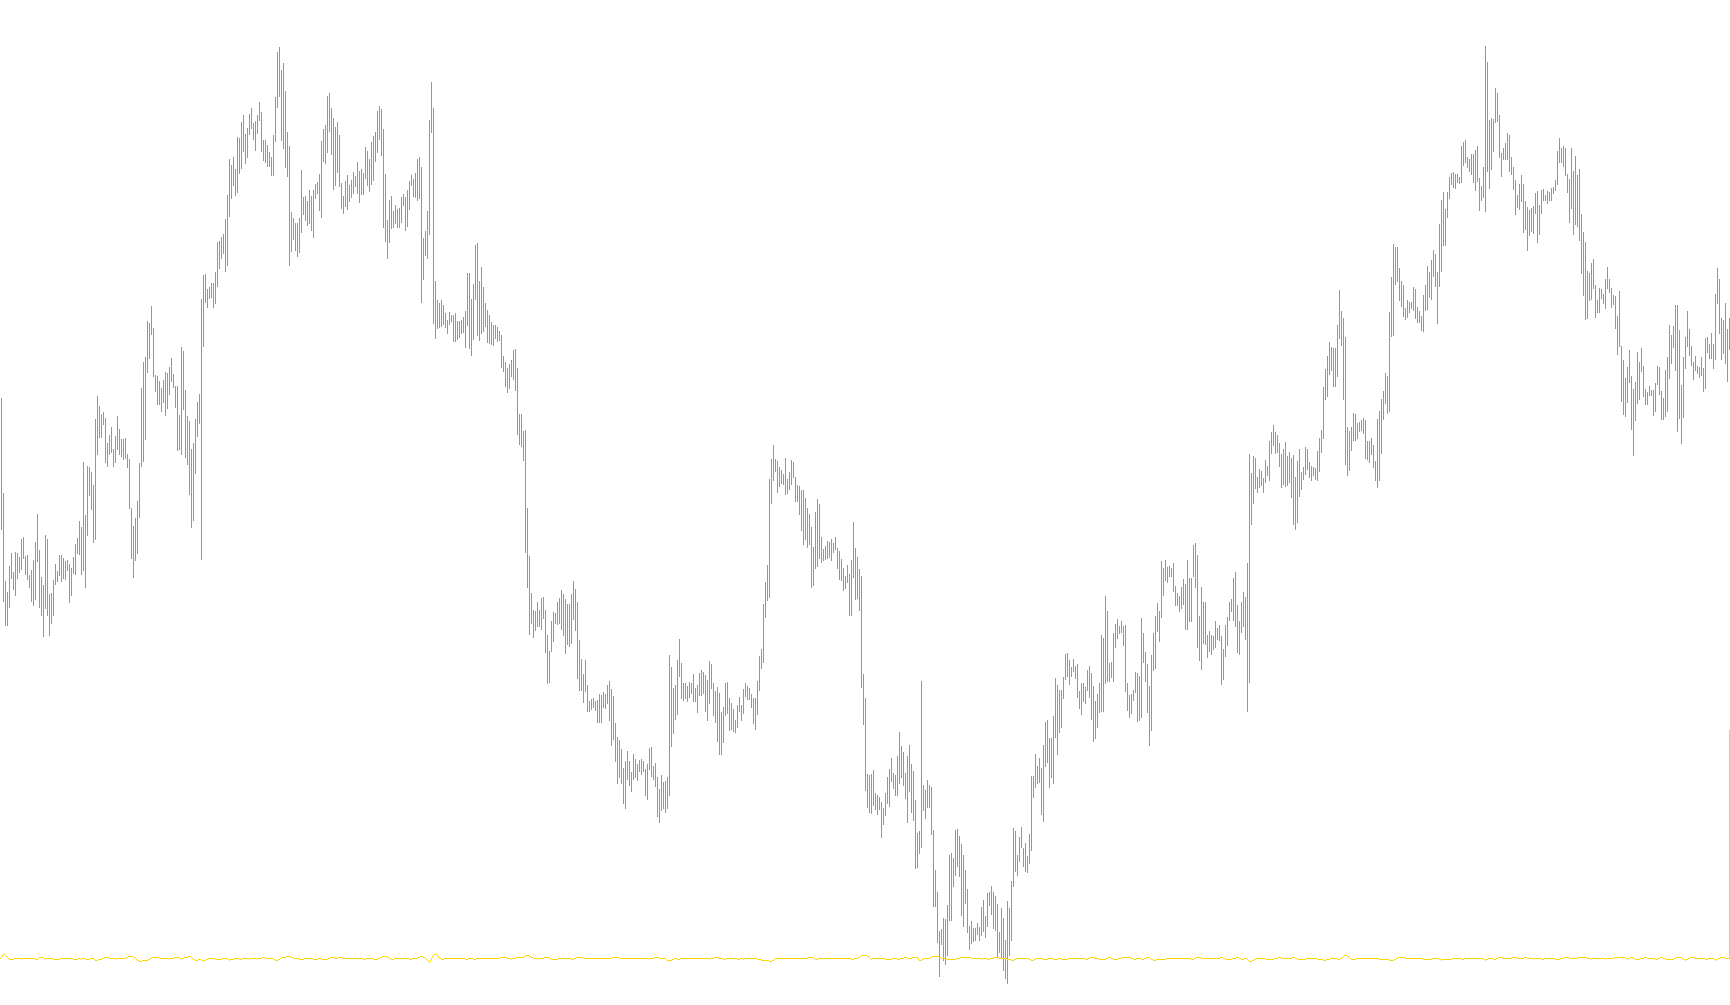
This indicator calculates a specialized momentum signal by applying a nested triple exponential moving average (T3) filter to the Commodity Channel Index (CCI) values.

SmCCI-RS
Indicator

SmCCI-RS

iCCI

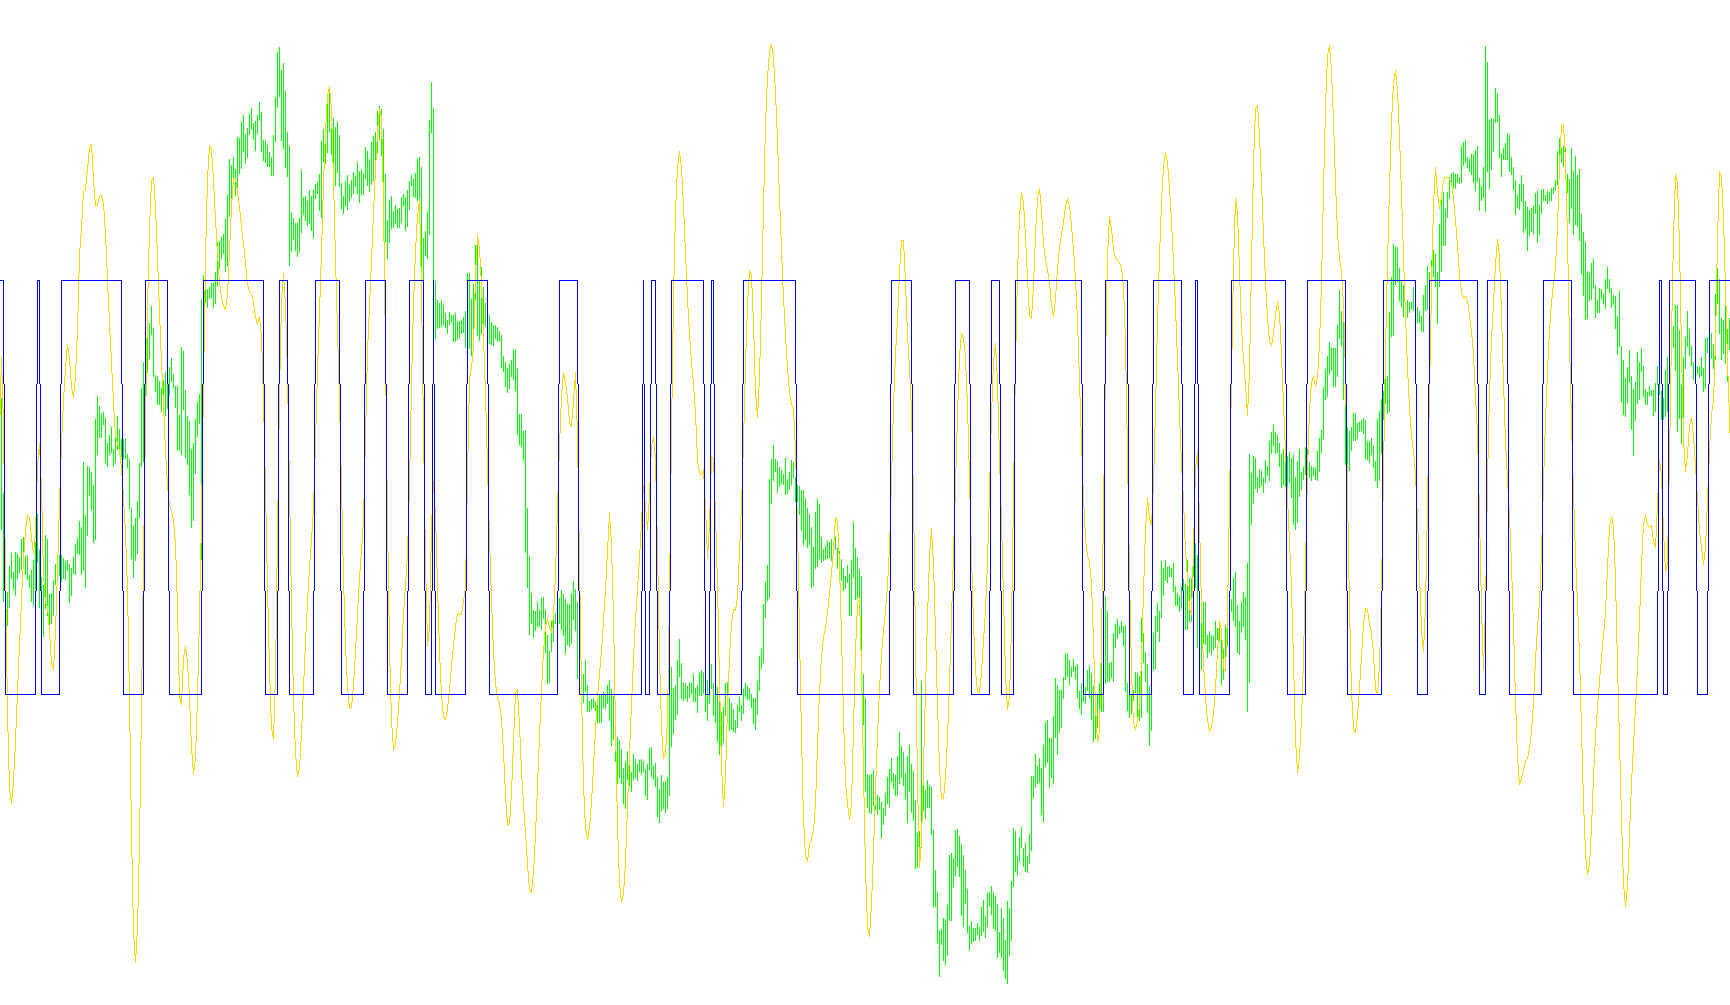
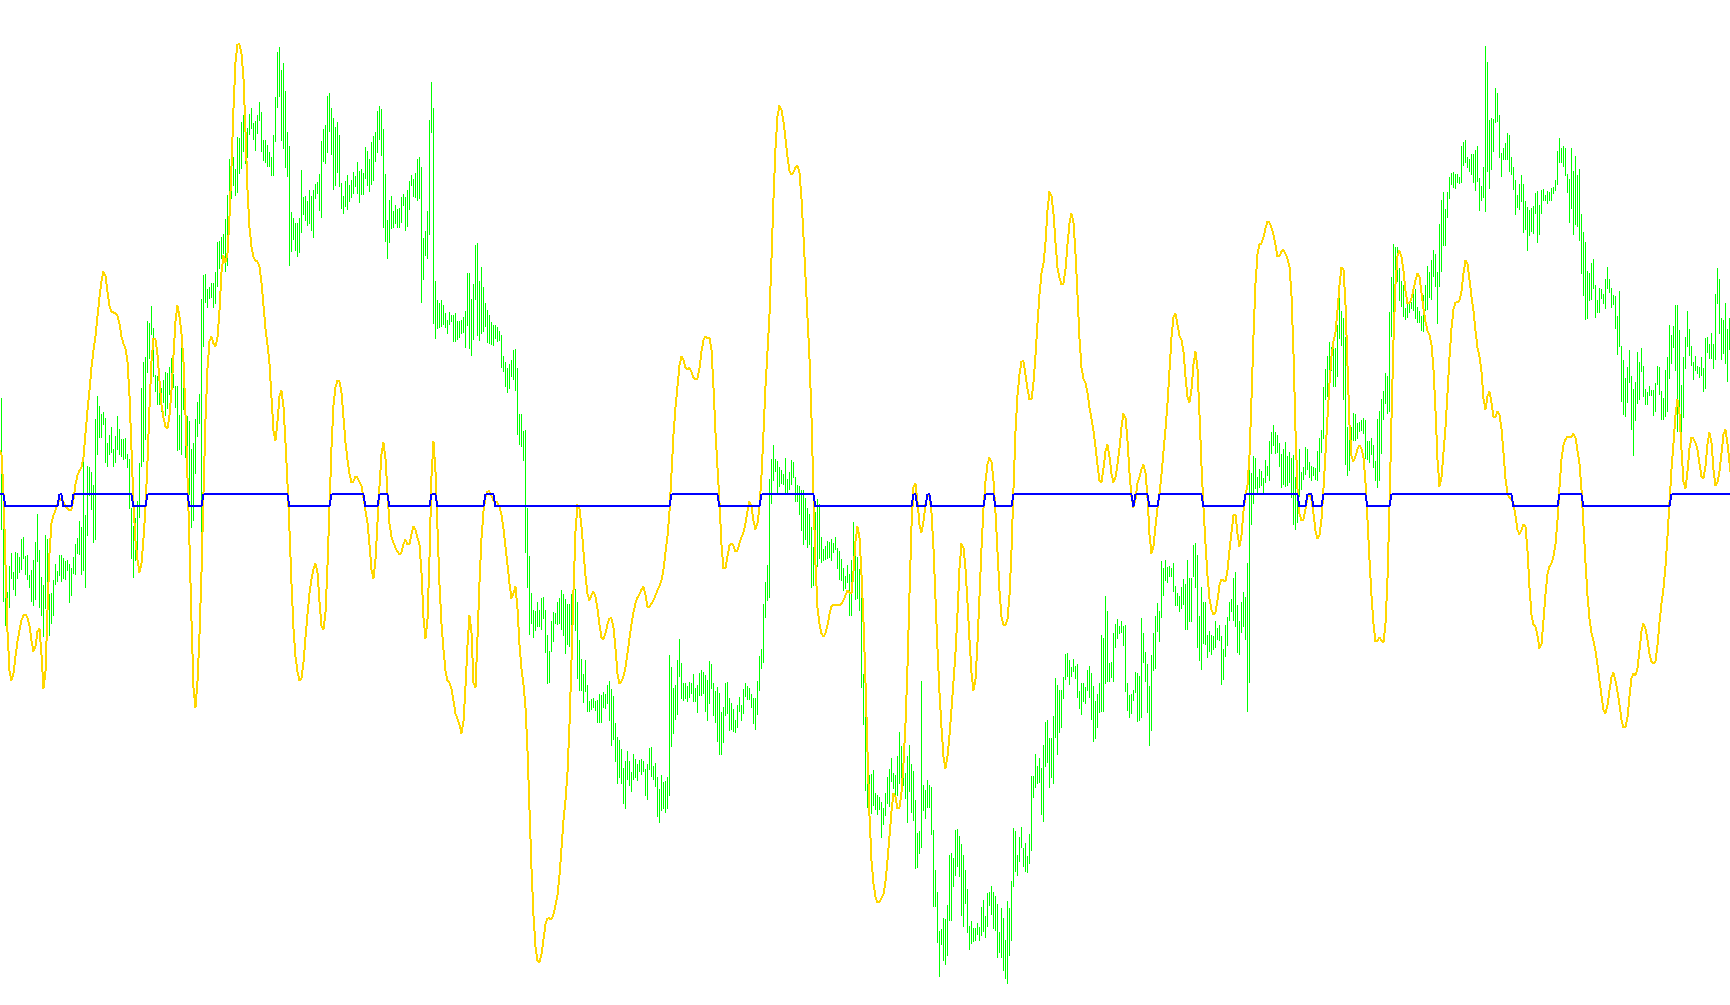
This indicator identifies market reversals by applying a triple-smoothed triple-exponential moving average (T3) filter to the Commodity Channel Index (CCI).

SmCCI_test
Indicator

SmCCI_test

iCCI

This indicator applies a multi-stage weighted moving average to the Commodity Channel Index, utilizing polynomial coefficients to filter noise and identify trend reversal thresholds.

smFisherTransform3_impr
Indicator

smFisherTransform3_impr

This indicator utilizes a modified Fisher Transform algorithm to smooth price action and identify momentum shifts by calculating the normalized position of price relative to recent highs and lows.

SMI
Indicator

SMI

iMAOnArray

This indicator calculates a momentum oscillator by computing the ratio of smoothed price deviations relative to historical high-low ranges using nested exponential moving averages.

SMI_Color
Indicator

SMI_Color

This indicator quantifies relative price momentum by scaling the ratio of high and smoothed moving averages into a three-state directional color matrix.

SMI_Correct-1
Indicator

SMI_Correct-1

iMAOnArray

This indicator calculates momentum by comparing the smoothed price position relative to its range using multi-layered exponential moving averages.

SMI_Correct
Indicator

SMI_Correct

iMAOnArray

Calculates momentum by normalizing the smoothed price distance from the midpoint relative to the expanding range of high and low extremes.

SMI_Helper
Indicator

SMI_Helper

iMAOnArray

This indicator calculates the relative position of the closing price against a dynamic high-low range and applies multi-stage moving average smoothing to filter noise from momentum shifts.

SMI_v1
Indicator

SMI_v1

iMAOnArray

This indicator calculates a normalized momentum value by applying nested Exponential Moving Averages to the difference between closing prices and price range midpoints.

SMI_v2
Indicator

SMI_v2

iMAOnArray

This indicator calculates a smoothed momentum ratio by evaluating the distance between current price and the median range, then applying nested exponential moving averages to filter noise.

SMI_v4
Indicator

SMI_v4

iMAOnArray

This indicator calculates a momentum oscillator by applying nested exponential moving averages to the ratio of smoothed price deviations relative to historical high-low ranges.

SMMA-Crossover_Signal
Indicator

SMMA-Crossover_Signal

iMA

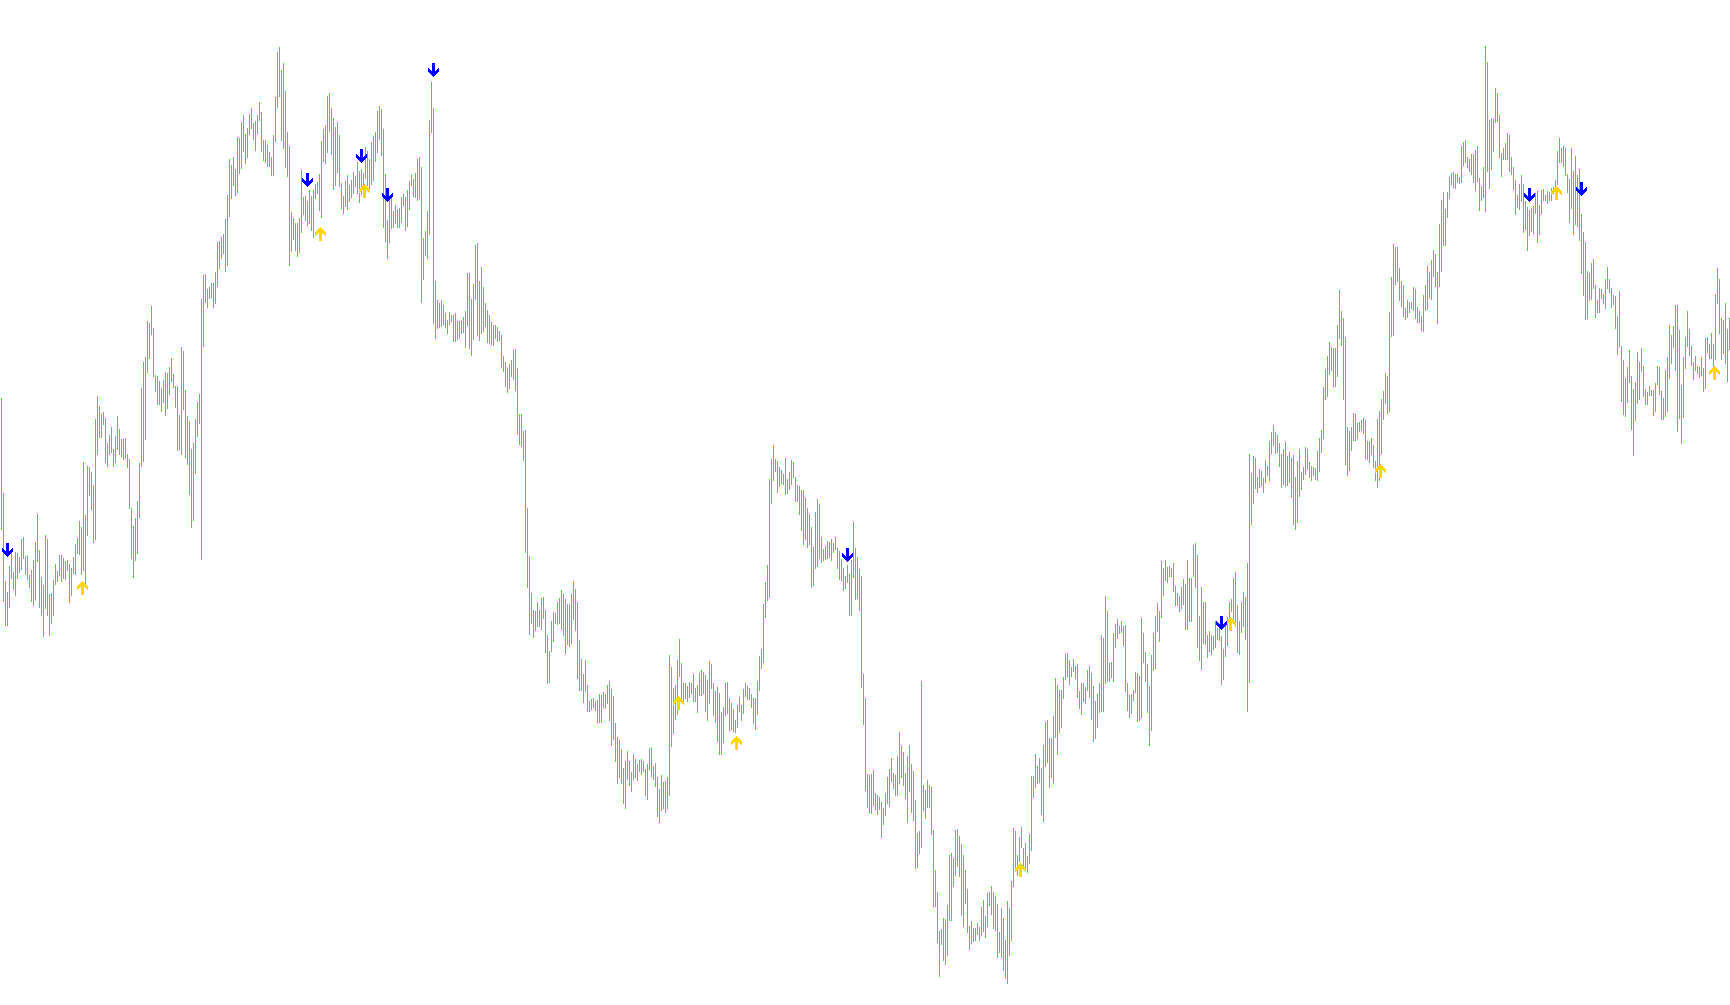
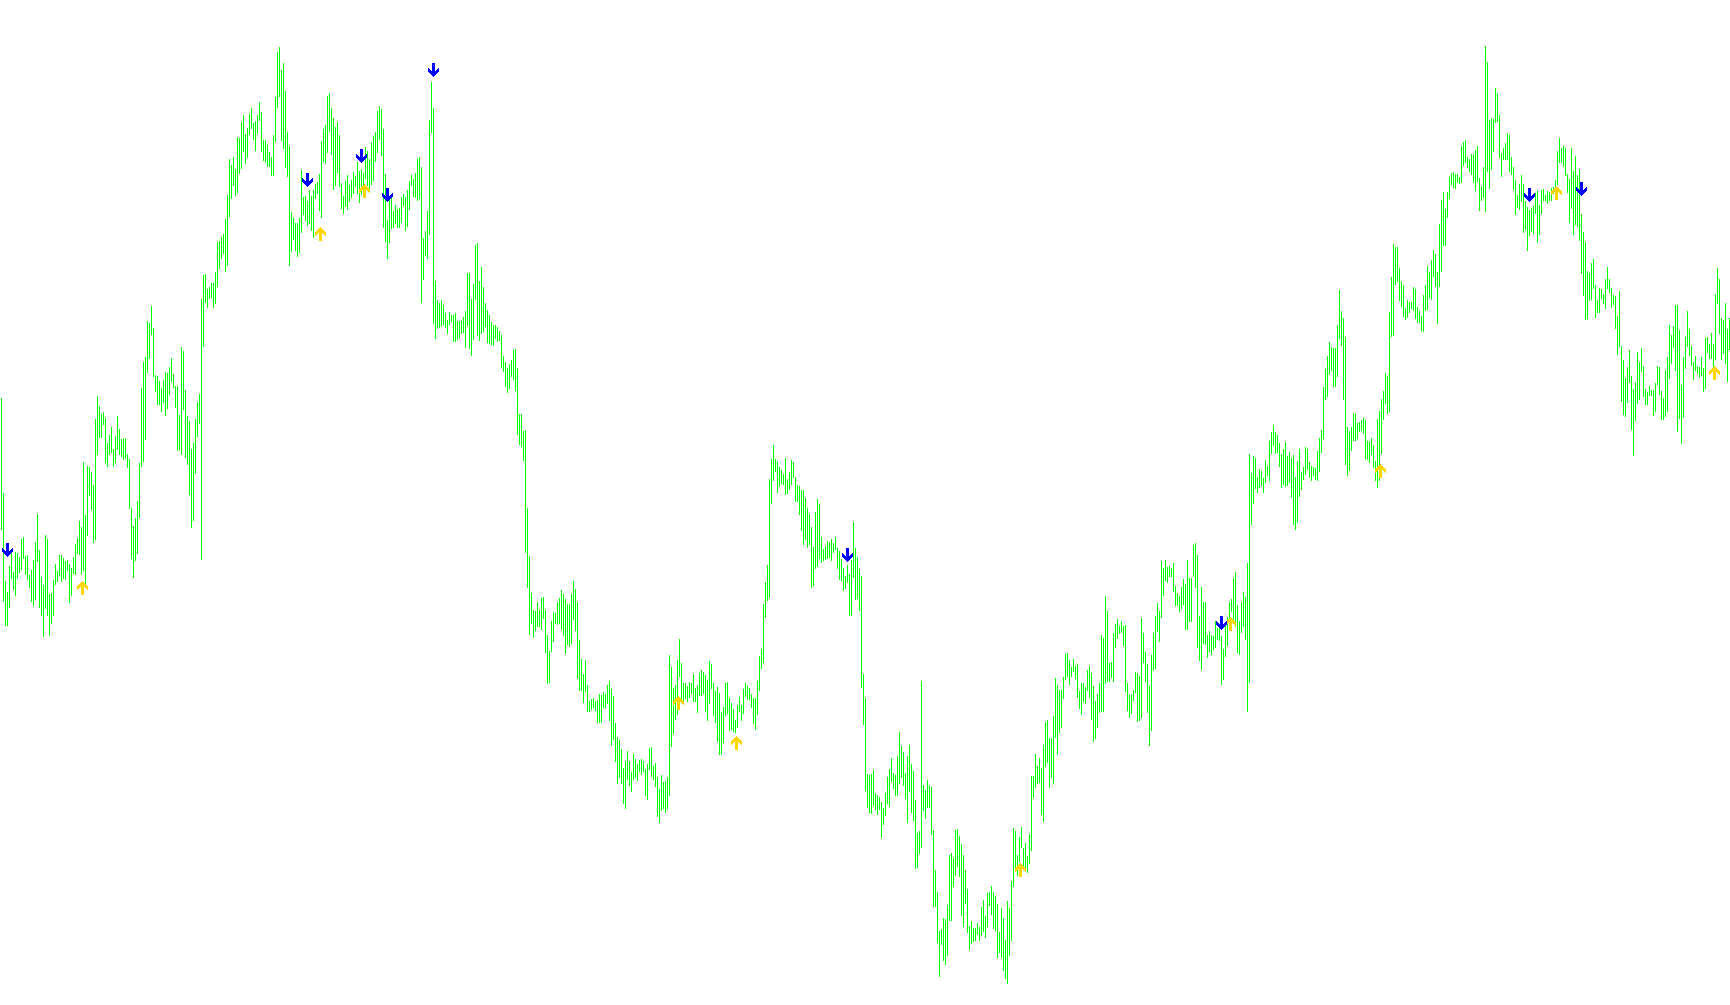
This indicator identifies precise bullish and bearish momentum shifts by plotting visual markers at the intersection points of two smoothed moving average periods.

SMMA-Crossover_Signal_v1
Indicator

SMMA-Crossover_Signal_v1

iMA

This indicator identifies precise price action reversal points by detecting momentum shifts where a fast Smoothed Moving Average intersects a slower baseline.

SMMA-Crossover_Signal_v3
Indicator

SMMA-Crossover_Signal_v3

iMA

This indicator identifies specific bull and bear reversals by plotting visual markers at the precise points where two smoothed moving average lines intersect.
SmoothCandle C v1.00
Indicator

SmoothCandle C v1.00

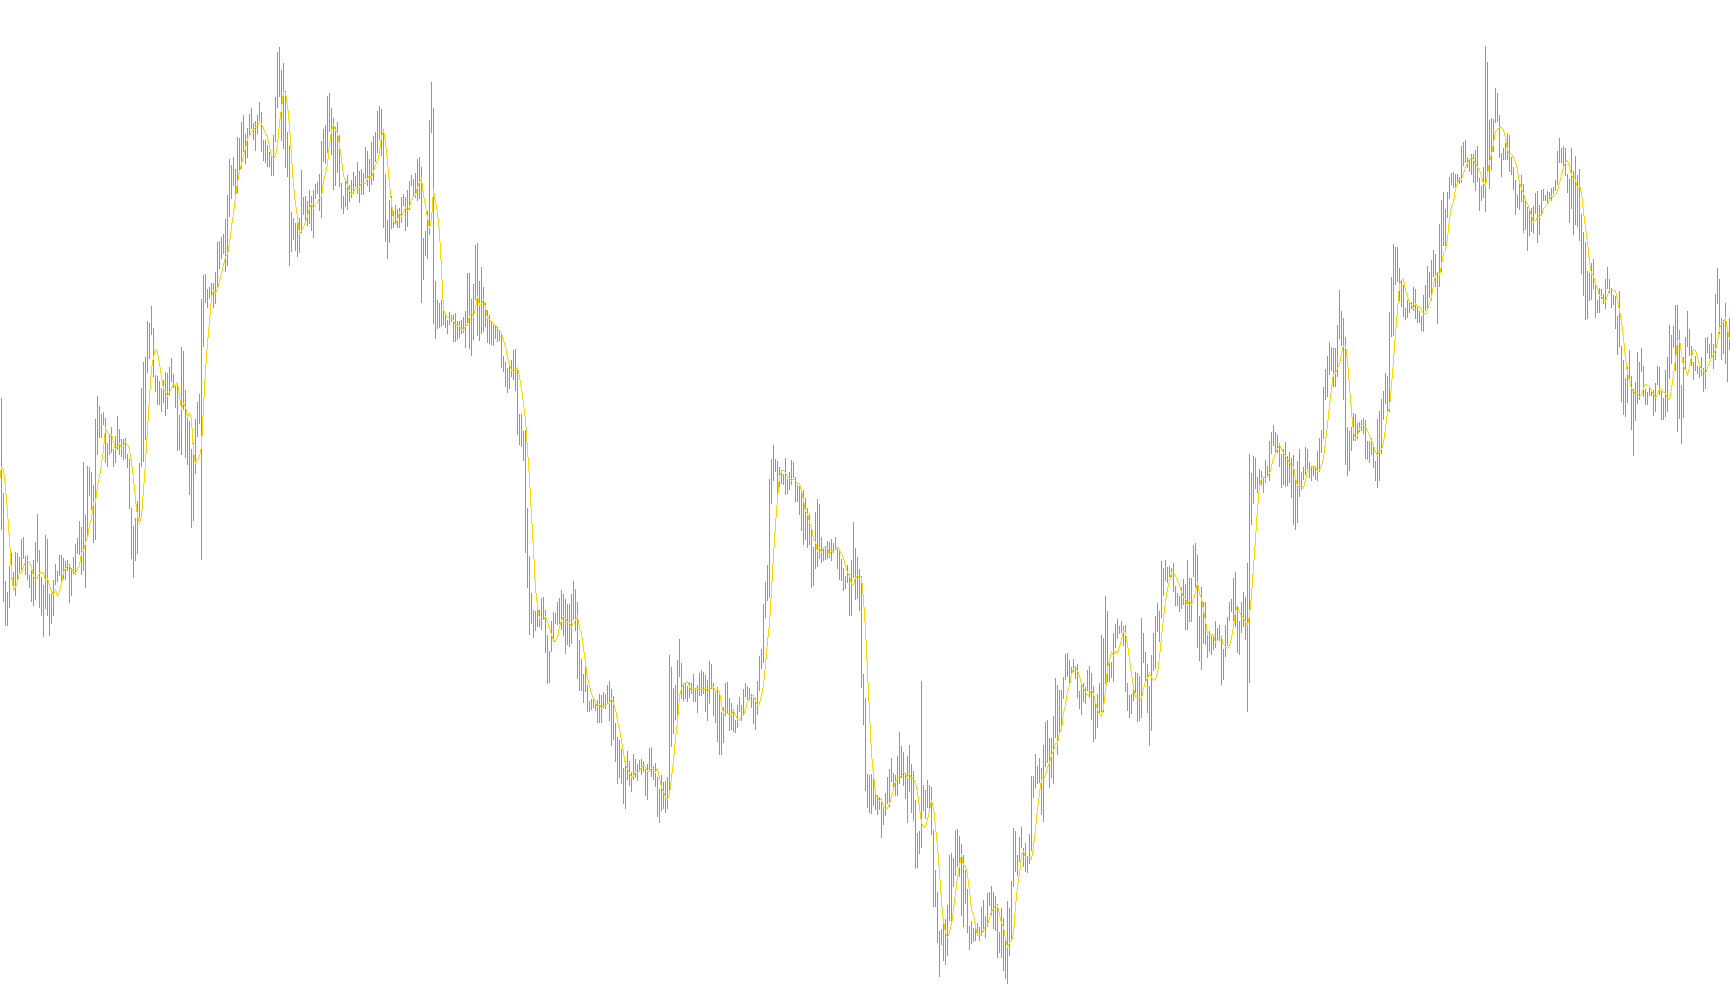
This indicator calculates a trailing arithmetic mean of the open, high, low, and close prices to generate smoothed price boundaries.
SmoothCandle C v1.00_v1
Indicator

SmoothCandle C v1.00_v1

This indicator calculates a multi-point arithmetic mean of OHLC price data to project smoothed trajectory lines offset by a user-defined period.

SmoothCandle S v1.00
Indicator

SmoothCandle S v1.00

This indicator generates a smoothed representation of candlestick components by calculating the arithmetic mean of price extremes over a designated historical window.

SmoothCandle_Cv1.1
Indicator

SmoothCandle_Cv1.1

iMA

This indicator calculates independent moving averages for the Open, High, Low, and Close price points to generate a stabilized structural overlay of candle geometry.

SmoothedAdaptiveMomentum
Indicator

SmoothedAdaptiveMomentum

This indicator calculates a smoothed momentum value by dynamically adjusting the lookback period based on cycle analysis and applying a four-point polynomial filter to minimize noise.

SmPriceBend-T01
Indicator

SmPriceBend-T01

iMA

This indicator quantifies price momentum by applying a weighted multi-stage smoothing filter to the directional delta between consecutive moving averages.

Indicator

SMSalert

smSuperTRIX_PV_v2
Indicator

smSuperTRIX_PV_v2

iMAiMAOnArray

This indicator identifies trend reversals by calculating a triple-smoothed rate of change and generating directional signals based on zero-line crossovers and histogram momentum shifts.

SmWPR
Indicator

SmWPR

iWPR

This indicator applies a multi-stage recursive smoothing filter to the Williams Percent Range (WPR) to generate a stabilized momentum signal and dynamic entry triggers.

SmWPRExp
Indicator

SmWPRExp

iWPR

This indicator processes the Williams Percent Range (WPR) through a triple exponential moving average filter to identify overextended price boundaries and trigger discrete buy/sell levels.

SmWPRExp_nR
Indicator

SmWPRExp_nR

iWPR

This indicator applies a triple exponential moving average smoothing technique to the Williams %R momentum oscillator to identify extreme oversold and overbought territories.

SmWPR_test
Indicator

SmWPR_test

iWPR

This indicator utilizes a multi-stage weighted smoothing algorithm on the Williams Percent Range to identify extreme overbought and oversold price momentum thresholds.

Snake
Indicator

Snake

iMA

This indicator calculates a multi-weighted smoothed axis to determine market sentiment and volatility boundaries based on high/low extremes and weighted price averages.

SnakeBorders
Indicator

SnakeBorders

iMA

This indicator identifies volatility corridors by calculating a weighted moving average of price action and establishing upper and lower boundaries based on local extrema within configurable historical periods.

SnakeForce
Indicator

SnakeForce

iMA

This indicator utilizes a weighted moving average to identify price momentum forces and define relative resistance levels by calculating the delta between current price action and historical extremes.

SnakeForce~
Indicator

SnakeForce~

iMA

This indicator utilizes a recursive moving average calculation to detect trend velocity and identifies momentum shifts by measuring price deviation relative to local extrema.

SnakeInBorders
Indicator

SnakeInBorders

iMA

The algorithm calculates a price corridor and a signaling axis based on weighted moving averages, where the signal line oscillates between boundaries to identify volatility contraction and directional expansion.

SnakeSMA
Indicator

SnakeSMA

iMA

This indicator calculates a balanced moving average by applying weighted coefficients to price data symmetrically around the current period to reduce lag and signal noise.

snake_001
Indicator

snake_001

iMA

The indicator computes a weighted moving average by applying a linear distribution of importance to price points surrounding a central anchor, facilitating smoother trend identification.

Snake_v2
Indicator

Snake_v2

iMA

This indicator calculates a weighted average of price points based on their proximity to the current candle, utilizing a sliding window sum to generate a smoothed trend line.

SnapShotEA
Indicator

SnapShotEA

Automates chronological visual capture at each new candle to detect repainting behavior or non-static indicator fluctuations.

SnapShotI
Indicator

SnapShotI

Automates the periodic generation of visual chart archives based on defined temporal intervals and bar-completion triggers.

SnapShotI1
Indicator

SnapShotI1

Captures automated periodic graphical screen captures based on specific bar intervals and user-defined tick delays.

SnapShotI_v1
Indicator

SnapShotI_v1

Automatically archives chronological visual snapshots of the price chart upon every new candle formation.

SnapShotI_v2
Indicator

SnapShotI_v2

Automatically captures time-sequenced visual snapshots of the price chart based on configurable bar intervals and tick delays.

SnapShotI_v3
Indicator

SnapShotI_v3

Automatically captures periodic graphical snapshots of the chart based on time-intervals and bar transitions to preserve visual price action history.

Snarl
Indicator

Snarl

This indicator monitors horizontal and vertical chart objects to trigger external system notifications via DLL calls when price action intersects predefined visual levels.

Indicator

snowseed-eCLV

iADX
snowseed-iClv
Indicator

snowseed-iClv

This indicator calculates a normalized deviation of the closing price relative to the high-low range over a rolling period, smoothed by an exponential moving average.

Solar Wind clean Mod1
Indicator

Solar Wind clean Mod1

The logic normalizes price action relative to recent highs and lows into a smoothed log-transformed oscillator to identify directional bias.

Solar Wind mod1
Indicator

Solar Wind mod1

This indicator calculates a smoothed momentum value by normalizing price action between dynamic high-low extremes and applying a logarithmic transformation to highlight trend reversals.

Solar Wind
Indicator

Solar Wind

This indicator calculates a normalized price relative to the highest high and lowest low within a specific period, applying a logarithmic transformation to visualize trend momentum shifts.

Solar Winds
Indicator

Solar Winds

This indicator transforms relative price positioning within a high-low range into a logarithmic momentum scale to identify trend reversals and directional shifts.