Induk@
Download script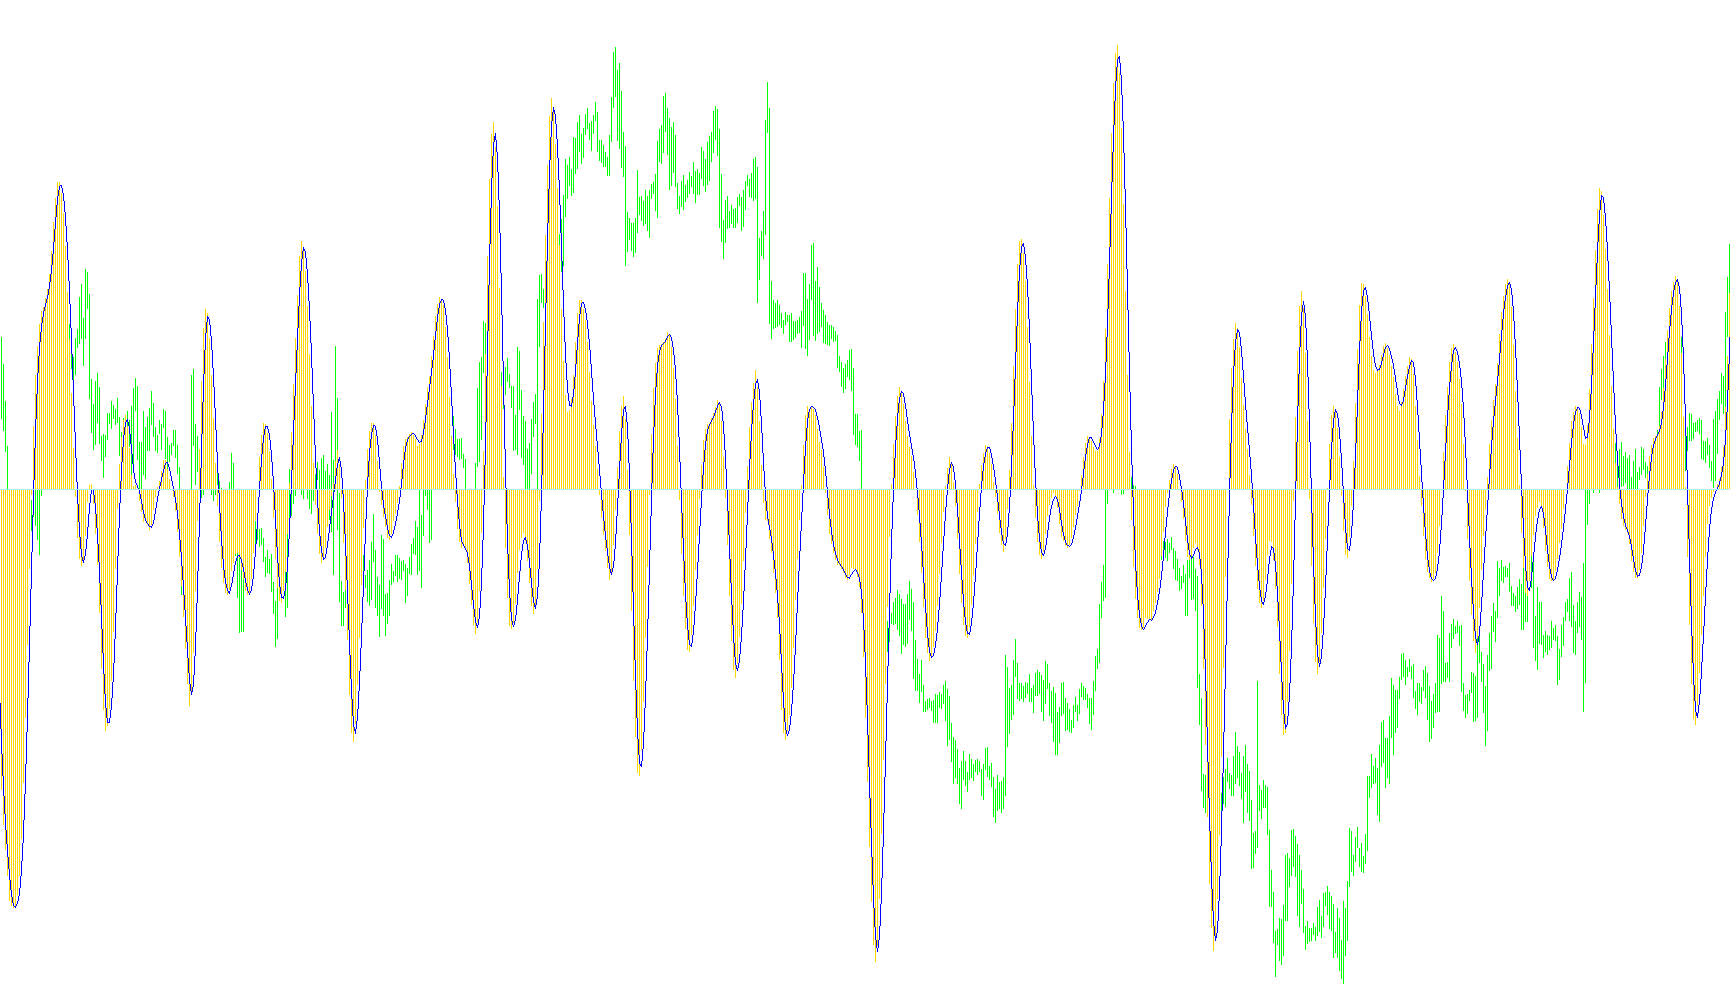
This indicator is designed to help traders identify market momentum and trend direction by processing price data through a series of mathematical layers. Instead of simply looking at current prices, it uses a multi-step calculation to "smooth out" market noise, making it easier to see the underlying movement of the asset.
How the Logic Works
1. Linear Regression (The Foundation) The script begins by applying a Linear Regression analysis to the closing prices over a specific timeframe. Think of this as finding the "best-fit line" through a series of price points. Rather than following every tiny zig-zag of the market, it calculates a steady trajectory of where the price is heading. This provides a much cleaner view of the trend than looking at raw candles alone.
2. Multi-Layered Smoothing Once the initial trend line is established, the script doesn't show it to you directly. Instead, it performs a sequence of "Moving Averages" on that data. By averaging the averages, the indicator filters out high-frequency volatility (the "jitter" in the price). It does this in three distinct stages:
- It takes the linear regression and calculates a primary moving average.
- It then takes that result and calculates a second moving average.
- Finally, it creates a third smoothed line to ensure the visual output is stable and not reactive to temporary spikes.
3. The Final Output (Momentum & Trend) The final visual elements on your chart represent two different things:
- The Histogram: This represents the difference between the first two layers of smoothing. Because it measures the distance between these smoothed values, it highlights the "velocity" or strength of the price move. When the histogram is large, momentum is strong; when it shrinks, the trend is losing steam.
- The Trend Line: The final smoothed line provides a clear visual guide of the overall market direction, helping traders stay on the right side of the primary trend.
Summary for Traders
In simple terms, this tool acts like a series of filters. It takes raw, messy price data, turns it into a steady mathematical trend line, smooths that line multiple times to remove "fake" signals, and then displays both the direction of the trend and the strength (momentum) of that move simultaneously.
//-----------at_ALR+ma2-------------
#property indicator_separate_window
#property indicator_buffers 3
#property indicator_color1 SkyBlue
#property indicator_color2 Red
#property indicator_color3 Silver
//-------------------------------------
extern int hrLR=14;
extern double k=0.5;
extern double k2=0.5;
extern double kma=0.25;
//----------------------
double at[],ma3[],a0[];
double lr[10000],sx,sy,sxy,sx2,aa,bb;
double sum,sum2,ma[10000],ma2,sum3;
int p,pma,pma2,pma3;
//******************************************************************
int init() {
   SetIndexStyle(0,DRAW_HISTOGRAM);
   SetIndexBuffer(0,at);
   SetIndexStyle(1,DRAW_LINE);
   SetIndexBuffer(1,ma3);
   SetIndexBuffer(2,a0);
//-------------------------------------------
p=hrLR*60/Period(); pma=p*k; pma2=p*k2; pma3=p*kma;
//-------------------------------------------
return(0);}
//******************************************************************
int start() {
int cbi,i,n;
//int counted_bars=IndicatorCounted();
//if (counted_bars<0) return (-1);
//if (counted_bars>0) counted_bars--;
cbi=Bars-IndicatorCounted()-2;
//------------------------------------
for(i=cbi; i>=0; i--) {
if (i<Bars-p-1) {sx=0; sy=0; sxy=0; sx2=0;
for (n=0; n<=p-1; n++) {sx=sx+i+n; sy=sy+Close[i+n]; sxy=sxy+(i+n)*Close[i+n]; sx2=sx2+MathPow(i+n,2);}
aa=(sx*sy-p*sxy)/(MathPow(sx,2)-p*sx2); bb=(sy-aa*sx)/p;
lr[i]=bb+aa*i;}
if (i<Bars-p-pma-1) { sum=0.0; for (n=0; n<=pma-1; n++) {sum+=lr[i+n];} ma[i]=sum/pma;}
if (i<Bars-p-pma-pma2-1) { sum2=0.0; for (n=0; n<=pma2-1; n++) {sum2+=ma[i+n];} ma2=sum2/pma2;
at[i]=(ma[i]-ma2)/Point; }
if (i<Bars-p-pma-pma2-pma3-1) { sum3=0.0; for (n=0; n<=pma3-1; n++) {sum3+=at[i+n];} ma3[i]=sum3/pma3;}
a0[i]=0.0000001;
}
//--------------------------------------------------------------------
   return(0);}
//********************************************************************
Comments