ind_StoColored_v1
Download script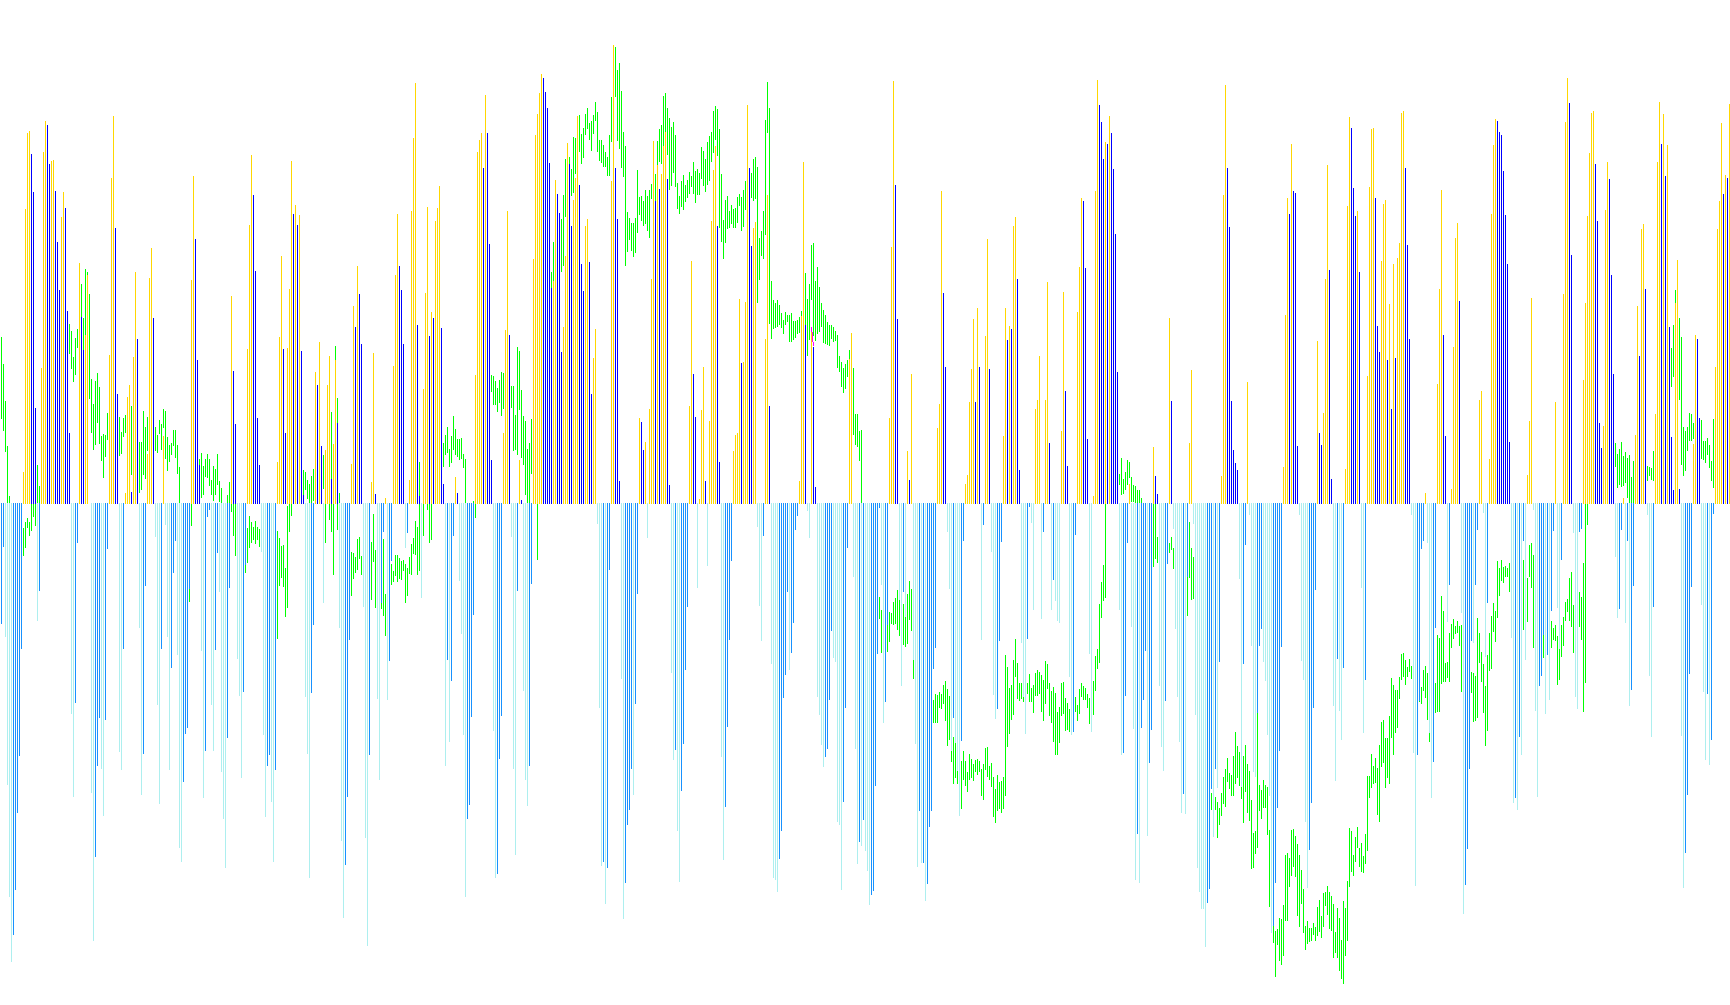
This script is a specialized technical analysis tool designed to provide visual insights into market momentum and price extremes. It functions by calculating specific oscillations and identifying "peaks" (high points) and "troughs" (low points) in price action, translating these movements into a clear visual format on your trading platform.
Core Logic and Functionality
Data Processing The script operates by analyzing price data over specific periods. It looks at different types of price information—such as the high, low, open, close, or median prices—depending on the user's configuration. By comparing current price movement against historical data within these timeframes, it generates a set of oscillation values.
Dynamic Identification The primary intelligence of this tool lies in how it categorizes market movement:
- Directional Tracking: The script monitors whether the current oscillation is rising or falling compared to its previous state.
- Polarity Analysis: It distinguishes between positive and negative momentum. When the data is above a certain threshold, it tracks upward movements; when below, it tracks downward movements.
- State Persistence: If the market enters a neutral zone where there is no immediate change in direction, the script intelligently "remembers" its previous state to ensure the visual data remains continuous and smooth rather than flickering or disappearing.
Visual Output The logic translates these complex calculations into several distinct visual components:
- Histogram Bars: These represent the magnitude of the momentum. They allow you to see at a glance the strength of a price move (e.g., how high a peak is or how deep a trough goes).
- Trend Lines: The script also produces two distinct lines that act as secondary data points, providing a smoother look at the underlying trend and helping to filter out market "noise."
Summary for the User
Essentially, this script acts as a momentum tracker that highlights where the market is overextending itself. By identifying these peaks and troughs, it helps traders visualize the cycle of price exhaustion. Instead of just showing you where the price is now, it interprets the strength and direction of the movement to help identify potential turning points in the market.
#property copyright "*"
#property link      "*"

#define IND "ind_DivPeakTroughSto_SW_v1"

#property indicator_separate_window
#property indicator_buffers 6
#property indicator_color1 LimeGreen
#property indicator_color2 Green
#property indicator_color3 Red
#property indicator_color4 Maroon
#property indicator_color5 Orange
#property indicator_color6 Orange

#property indicator_width1 2
#property indicator_width2 2
#property indicator_width3 2
#property indicator_width4 2


//---- input parameters
extern int StKPeriod=5;
extern int StDPeriod=3;
extern int StSPeriod=3;
extern int StMethod=0; // 0-Close, 1-Open, 2-High, 3-Low, 4-Median, 5-Typical, 6-Weighted
extern int StPrice=0; // 0 - Low/High, 1 - Close/Close
extern int ExtrLeftBars=2; // áàðîâ ñëåâà îò ýêñòðåìóìà
extern int ExtrRightBars=1; // áàðîâ ñïðàâà îò ýêñòðåìóìà
extern double PlusSens=0.0001;
extern double MinusSens=-0.0001;
       bool DrawLinesSW=false;
       bool DrawLinesChW=false;
       color Col_Peak_1=Red;
       color Col_Peak_2=DeepPink;
       color Col_Trough_1=LimeGreen;
       color Col_Trough_2=YellowGreen;
       string ShortName0="ZX";
extern string ShortName="DPTSto";


//---- buffers
double PlusUp[];
double PlusDn[];
double MinusDn[];
double MinusUp[];
double Dot1[];
double Dot2[];

//+------------------------------------------------------------------+
//| Custom indicator initialization function                         |
//+------------------------------------------------------------------+
int init()
  {
//---- indicators
   SetIndexStyle(0,DRAW_HISTOGRAM);
   SetIndexBuffer(0,PlusUp);
   SetIndexStyle(1,DRAW_HISTOGRAM);
   SetIndexBuffer(1,PlusDn);
   SetIndexStyle(2,DRAW_HISTOGRAM);
   SetIndexBuffer(2,MinusDn);
   SetIndexStyle(3,DRAW_HISTOGRAM);
   SetIndexBuffer(3,MinusUp);
   SetIndexStyle(4,DRAW_LINE);
   SetIndexBuffer(4,Dot1);
   SetIndexStyle(5,DRAW_LINE);
   SetIndexBuffer(5,Dot2);


   SetIndexLabel(0,"");
   SetIndexLabel(1,"");
   SetIndexLabel(2,"");
   SetIndexLabel(3,"");
   SetIndexLabel(4,"");
   SetIndexLabel(5,"");


   IndicatorShortName(ShortName);

//----
   return(0);
  }
//+------------------------------------------------------------------+
//| Custom indicator deinitialization function                       |
//+------------------------------------------------------------------+
int deinit()
  {
//----

//----
   return(0);
  }
//+------------------------------------------------------------------+
//| Custom indicator iteration function                              |
//+------------------------------------------------------------------+
int start(){

         int limit=Bars-IndicatorCounted();

            for(int i=limit-1;i>=0;i--){

               PlusUp[i]=0;
               PlusDn[i]=0;
               MinusDn[i]=0;
               MinusUp[i]=0;

               double osc1=iCustom(NULL,0,IND,StKPeriod,StDPeriod,StSPeriod,StMethod,StPrice,ExtrLeftBars,ExtrRightBars,PlusSens,MinusSens,DrawLinesSW,DrawLinesChW,Col_Peak_1,Col_Peak_2,Col_Trough_1,Col_Trough_2,ShortName0,0,i);
               double osc2=iCustom(NULL,0,IND,StKPeriod,StDPeriod,StSPeriod,StMethod,StPrice,ExtrLeftBars,ExtrRightBars,PlusSens,MinusSens,DrawLinesSW,DrawLinesChW,Col_Peak_1,Col_Peak_2,Col_Trough_1,Col_Trough_2,ShortName0,0,i+1);
               Dot1[i]=iCustom(NULL,0,IND,StKPeriod,StDPeriod,StSPeriod,StMethod,StPrice,ExtrLeftBars,ExtrRightBars,PlusSens,MinusSens,DrawLinesSW,DrawLinesChW,Col_Peak_1,Col_Peak_2,Col_Trough_1,Col_Trough_2,ShortName0,1,i);
               Dot2[i]=iCustom(NULL,0,IND,StKPeriod,StDPeriod,StSPeriod,StMethod,StPrice,ExtrLeftBars,ExtrRightBars,PlusSens,MinusSens,DrawLinesSW,DrawLinesChW,Col_Peak_1,Col_Peak_2,Col_Trough_1,Col_Trough_2,ShortName0,2,i);

               int Case=0;
                  if(osc1>0){
                     if(osc1>osc2){
                        Case=1;
                     }
                     if(osc1<osc2){
                        Case=2;
                     }
                  }
                  if(osc1<0){
                     if(osc1<osc2){
                        Case=3;
                     }
                     if(osc1>osc2){
                        Case=4;
                     }
                  }
                  if(Case==0){
                     if(PlusUp[i+1]!=0){
                        Case=1;
                     }
                     if(PlusDn[i+1]!=0){
                        Case=2;
                     }
                     if(MinusDn[i+1]!=0){
                        Case=3;
                     }
                     if(MinusUp[i+1]!=0){
                        Case=4;
                     }
                  }
                  switch(Case){
                     case 1:
                        PlusUp[i]=osc1;
                     break;
                     case 2:
                        PlusDn[i]=osc1;
                     break;
                     case 3:
                        MinusDn[i]=osc1;
                     break;
                     case 4:
                        MinusUp[i]=osc1;
                     break;
                  }

            }

   return(0);
}
//+------------------------------------------------------------------+
Comments