INDInverse_EMAdirection
Download script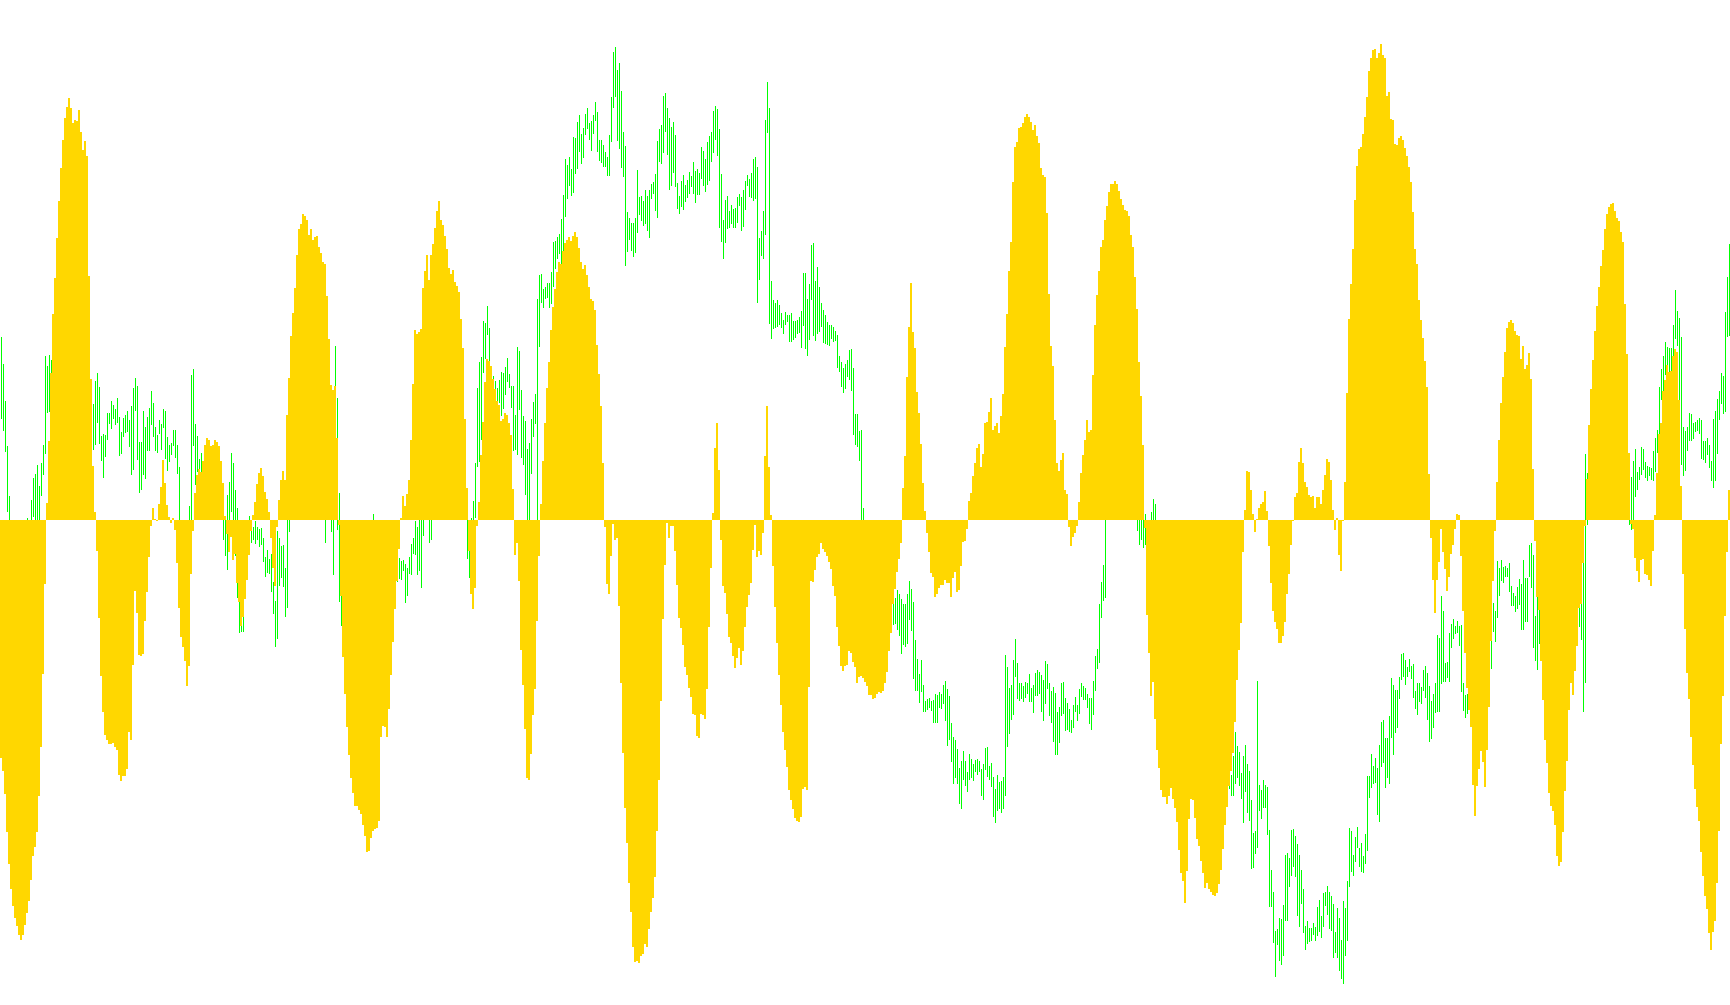
Overview
This technical indicator is designed to analyze market price action by measuring the relationship between current prices and historical volatility. Instead of simply looking at where the price is going, it evaluates the "intensity" of price movements relative to the highest and lowest points reached over a specific period.
Core Logic and Methodology
The script functions through a multi-layered calculation process:
1. Volatility Mapping The tool first identifies the highest high and the lowest low within a set range of recent price bars. By calculating the distance between these two extremes, it establishes the "amplitude" or the total territory the price has covered. It then determines where the current closing price sits relative to that territory.
2. Normalized Data Conversion Once the amplitude is established, the indicator converts the raw price into a normalized value. This means it scales the market data so that it can be compared more easily regardless of the asset's actual price (e.g., whether you are trading a low-value currency pair or a high-value commodity). This step creates a unique data stream that highlights how "stretched" or "compressed" the current price is compared to its recent boundaries.
3. Momentum Tracking via Moving Averages The final layer of logic applies two different types of moving averages to this normalized data:
- A Fast Moving Average: Designed to react quickly to sudden changes in market sentiment.
- A Slow Moving Average: Designed to smooth out the noise and show the broader trend.
Visual Representation
The indicator displays the difference between these two moving averages as a histogram.
- When the fast average moves significantly above the slow average, it indicates strong upward momentum relative to the recent price territory.
- When it moves below, it suggests downward momentum.
- The height and direction of the histogram bars represent the speed and strength of these shifts, helping traders identify potential trend reversals or continuations by observing when the momentum begins to shift from one side to the other.
//+------------------------------------------------------------------+
//|                                        IND Inverse direction.mq4 |
//+------------------------------------------------------------------+
#property indicator_separate_window
#property indicator_buffers 2
#property indicator_color1 Silver
#property indicator_color2 Black
#property indicator_maximum 0.25
#property indicator_minimum -0.25


double Buffer[], hist[];

extern int FastEMA = 20;
extern int SlowEMA = 50;
extern int iPeriod = 1;


//----
//+------------------------------------------------------------------+
//| Init                                                             |
//+------------------------------------------------------------------+
int init()
{
//---- indicators
    IndicatorBuffers(2);
//    IndicatorDigits(Digits+2);

    SetIndexStyle(0,DRAW_HISTOGRAM,0,2);
    SetIndexBuffer(0,hist);
    SetIndexStyle(1,DRAW_NONE);
    SetIndexBuffer(1,Buffer);

//----
    return(0);
}

//+------------------------------------------------------------------+
//| Parabolic Sell And Reverse system                                |
//+------------------------------------------------------------------+
int start()
  {
   int limit, i;
   int counted_bars=IndicatorCounted();

//---- check for possible errors
   if(counted_bars<0)
   {
      return(-1);
   }
//---- last counted bar will be recounted
   if(counted_bars>0) counted_bars--;
   limit=Bars-counted_bars;

//---- do it


    for (i=limit-1; i>=0; i--)
    {
        // Easy to read
        double HD = High[Highest(NULL,0,MODE_HIGH,(iPeriod* 20),i)];
        double LD = Low[Lowest(NULL,0,MODE_LOW,(iPeriod* 20),i)];
        double amplitude = HD - LD;
        Buffer[i]= ((Close[i]-(HD-(amplitude/2)))/amplitude) * iPeriod;

    }

    for (i=limit-1-SlowEMA; i>=0; i--)
      hist[i] = iMAOnArray (Buffer,0,FastEMA,0,MODE_EMA,i) - iMAOnArray (Buffer,0,SlowEMA,0,MODE_EMA,i);

   return(0);
  }
//+------------------------------------------------------------------+
Comments