INERCIA_bars_v1
Download script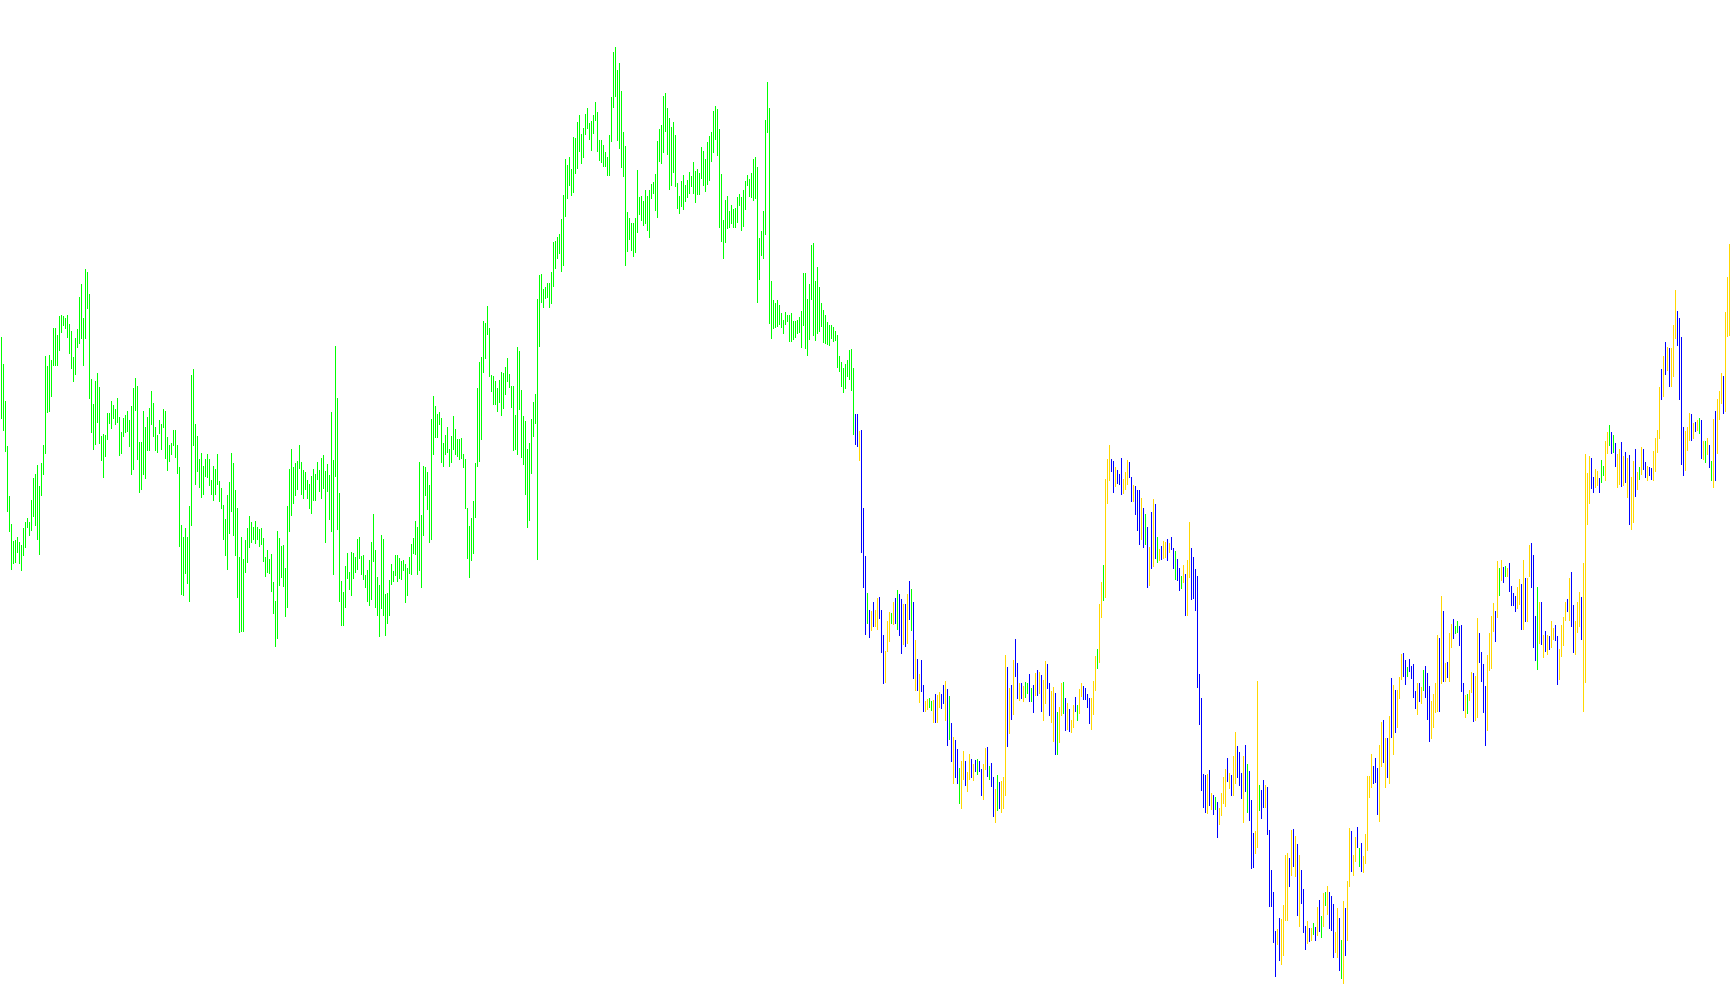
This tool is designed to visually filter and highlight significant price movements on a trading chart by identifying specific types of "high-impact" candles. Rather than showing every minor fluctuation in the market, it focuses exclusively on bars that exhibit a certain level of momentum or strength.
Core Logic Overview
The script scans through a specific number of past candles (which you can customize) to look for clear directional trends. It distinguishes between bullish movements (where the price closes higher than it opened) and bearish movements (where the price closes lower than it opened).
How It Identifies Signals
To ensure that only meaningful price action is highlighted, the script applies a specific "strength" rule:
- Magnitude Threshold: The tool does not react to small, insignificant price wiggles. It requires the difference between the opening and closing price of a candle to exceed a minimum size (defined by a user-set "body" parameter).
- Bullish Detection: If a candle closes higher than it opened and meets the required size threshold, the script marks this as a strong upward movement.
- Bearish Detection: If a candle closes lower than it opened and meets the required size threshold, the script marks this as a strong downward movement.
Visual Representation
The indicator processes these findings and displays them as histograms on your chart:
- When a significant bullish move is detected, it plots a blue mark representing the price range of that candle.
- When a significant bearish move is detected, it plots a red mark representing the price range of that candle.
By using this logic, the indicator helps traders filter out market "noise," allowing them to see only the instances where the market has moved with enough force to potentially indicate a shift in trend or a period of high volatility.
//+------------------------------------------------------------------+
//|   INERCIA_bars.mq4                                               |
//|   Translated by KimIV                                            |
//|	Author := BOL                                                  |
//|   Name := INERCIA_bars                                           |
//|   http://www.kimiv.ru                                            |
//|                                                                  |
//| 10.11.2005  Øàáëîí èíäèêàòîðà ñ äâóìÿ ñèãíàëàìè                  |
//+------------------------------------------------------------------+
#property copyright "NICTRADER"
#property link      "http://nyctrader.ru/"
//----
#property indicator_chart_window
#property indicator_buffers 2
#property indicator_color1 Blue
#property indicator_color2 Red
//------- Âíåøíèå ïàðàìåòðû èíäèêàòîðà -------------------------------
extern int body        =7;
extern int NumberOfBars=400;     // Êîëè÷åñòâî áàðîâ îáñ÷¸òà (0-âñå)
//------- Áóôåðû èíäèêàòîðà ------------------------------------------
double buf0[];
double buf1[];
//+------------------------------------------------------------------+
//| Custom indicator initialization function                         |
//+------------------------------------------------------------------+
  void init()
  {
   SetIndexBuffer(0, buf0);
   SetIndexStyle (0, DRAW_HISTOGRAM);
   SetIndexEmptyValue(0, EMPTY_VALUE);
   //
   SetIndexBuffer(1, buf1);
   SetIndexStyle (1, DRAW_HISTOGRAM);
   SetIndexEmptyValue(1, EMPTY_VALUE);
  }
//+------------------------------------------------------------------+
//| Custom indicator iteration function                              |
//+------------------------------------------------------------------+
  void start()
  {
   int LoopBegin, sh;
//----
   if (NumberOfBars==0) LoopBegin=Bars-1;
   else LoopBegin=NumberOfBars-1;
   LoopBegin=MathMin(Bars-25, LoopBegin);
     for(sh=LoopBegin; sh>=0; sh--)
     {
      buf0[sh]=EMPTY_VALUE;
      buf1[sh]=EMPTY_VALUE;
        if (Close[sh]>Open[sh] && Close[sh]-Open[sh]>body*Point)
        {
         buf0[sh]=High[sh];
         buf1[sh]=Low[sh];
        }
        if (Close[sh]<Open[sh] && Open[sh]-Close[sh]>body*Point)
        {
         buf0[sh]=Low[sh];
         buf1[sh]=High[sh];
        }
     }
  }
//+------------------------------------------------------------------+
Comments