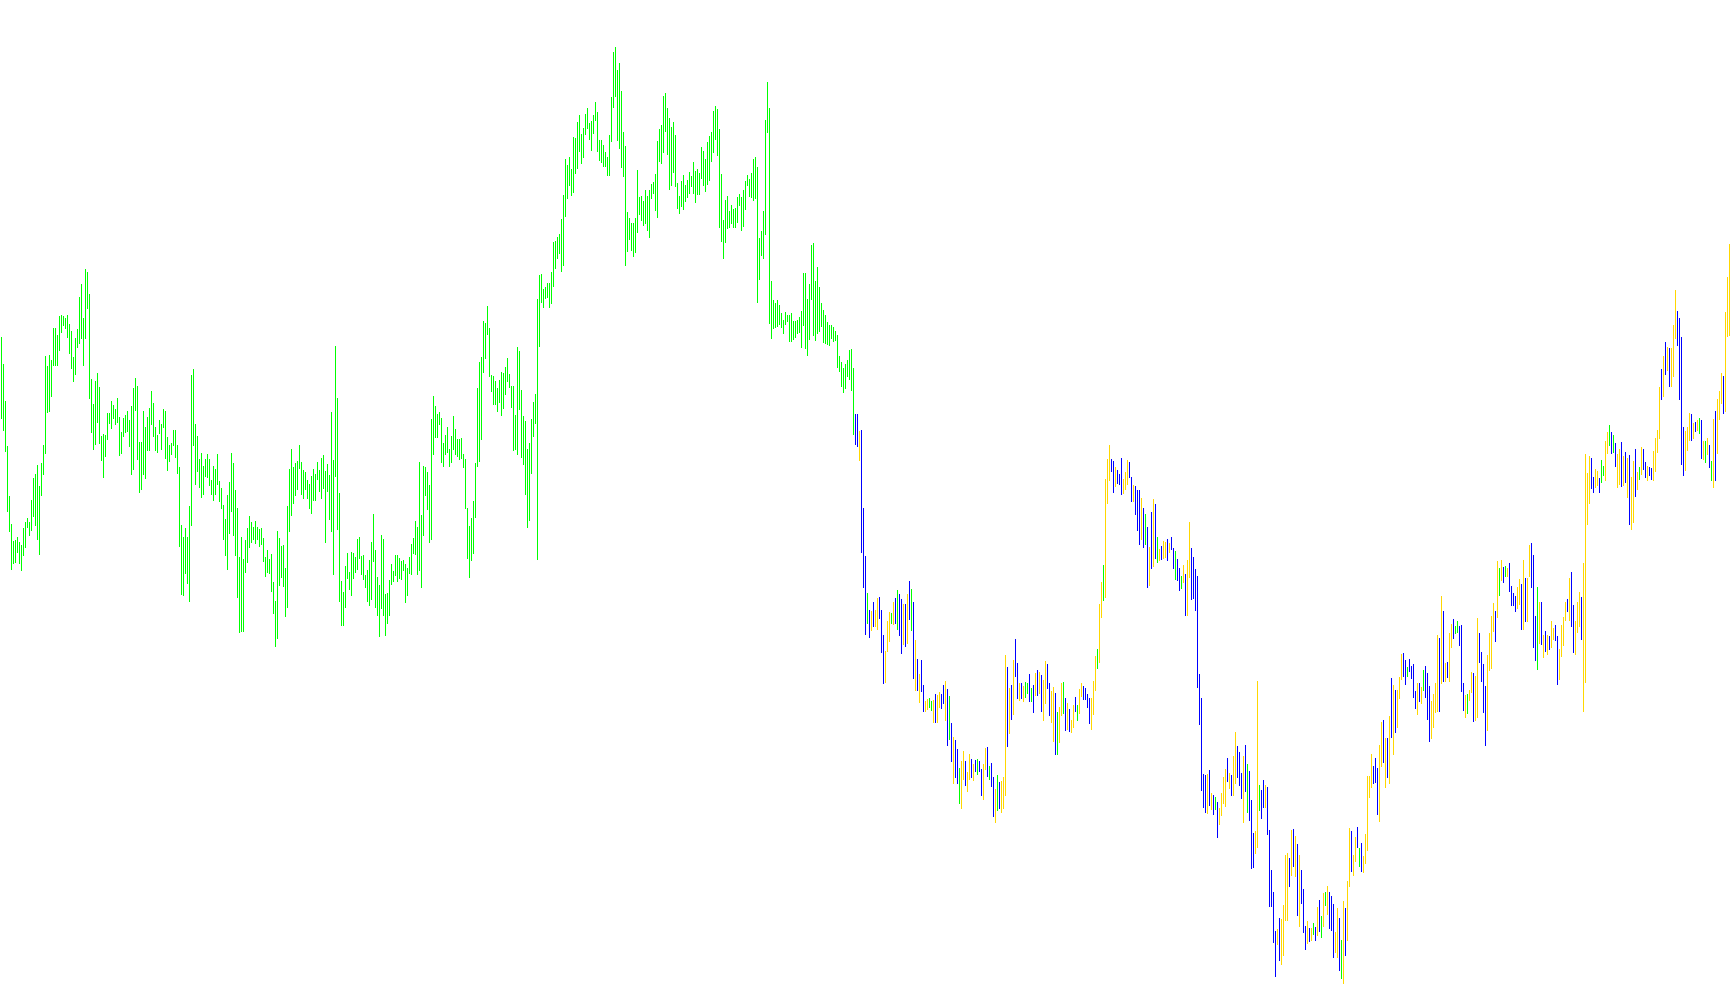
The INERCIA_bars indicator is designed to provide a visual representation of significant price movements on your trading chart. Instead of cluttering the screen with every minor price fluctuation, this tool filters the market data to highlight only the most impactful "active" candles based on their size and direction.
How it Works
The logic behind the indicator focuses on identifying high-momentum price bars that exceed a specific minimum threshold. Here is the breakdown of its operations:
- Filtering by Momentum: The script looks at each candle to determine if the price movement was substantial enough to be considered significant. It does this by comparing the size of the candle's "body" (the distance between the opening and closing price) against a user-defined minimum limit.
- Identifying Trends:
- Bullish Movement: When a candle closes higher than it opened and its body exceeds the required size, the indicator recognizes a significant upward move.
- Bearish Movement: When a candle closes lower than it opened and its body exceeds the required size, the indicator recognizes a significant downward move.
- Visual Representation: The tool then plots these specific movements on your chart using two distinct colors (Blue and Red). By highlighting the Highs and Lows of only these qualifying bars, the indicator helps traders visualize the "inertia" or the primary direction of the market, making it easier to distinguish between minor noise and genuine price trends.
Key Features
- Customizable Sensitivity: You can adjust the minimum size required for a bar to be highlighted, allowing you to tailor the indicator to different assets (e.g., volatile forex pairs vs. steady stock movements).
- Performance Focused: The script includes a setting to limit the number of bars processed at once, ensuring that your trading platform remains responsive while still providing a clear historical view of market momentum.
6
Views
0
Downloads
0
Favorites
INERCIA_bars
//+------------------------------------------------------------------+
//|                                                 INERCIA_bars.mq4 |
//|                                              Translated by KimIV |
//|                                              http://www.kimiv.ru |
//|                                                                  |
//| 10.11.2005  Øàáëîí èíäèêàòîðà ñ äâóìÿ ñèãíàëàìè                  |
//+------------------------------------------------------------------+
/*[[
	Name := INERCIA_bars
	Author := BOL
	Link := http://nyctrader.ru/
	Notes := NICTRADER
	Separate Window := No
	First Color := Blue
	First Draw Type := Histogram
	First Symbol := 217
	Use Second Data := Yes
	Second Color := Red
	Second Draw Type := Histogram
	Second Symbol := 218
]]*/
#property copyright "NICTRADER"
#property link      "http://nyctrader.ru/"

#property indicator_chart_window
#property indicator_buffers 2
#property indicator_color1 Blue
#property indicator_color2 Red

//------- Âíåøíèå ïàðàìåòðû èíäèêàòîðà -------------------------------
extern int body         = 7;
extern int NumberOfBars = 400;     // Êîëè÷åñòâî áàðîâ îáñ÷¸òà (0-âñå)

//------- Áóôåðû èíäèêàòîðà ------------------------------------------
double buf0[];
double buf1[];


//+------------------------------------------------------------------+
//| Custom indicator initialization function                         |
//+------------------------------------------------------------------+
void init() {
  SetIndexBuffer(0, buf0);
  SetIndexStyle (0, DRAW_HISTOGRAM);
  SetIndexEmptyValue(0, EMPTY_VALUE);

  SetIndexBuffer(1, buf1);
  SetIndexStyle (1, DRAW_HISTOGRAM);
  SetIndexEmptyValue(1, EMPTY_VALUE);
}

//+------------------------------------------------------------------+
//| Custom indicator iteration function                              |
//+------------------------------------------------------------------+
void start() {
  int LoopBegin, sh;

 	if (NumberOfBars==0) LoopBegin=Bars-1;
  else LoopBegin=NumberOfBars-1;
  LoopBegin=MathMin(Bars-25, LoopBegin);

  for (sh=LoopBegin; sh>=0; sh--) {
    buf0[sh]=EMPTY_VALUE;
    buf1[sh]=EMPTY_VALUE;
    if (Close[sh]>Open[sh] && Close[sh]-Open[sh]>body*Point) {
      buf0[sh]=High[sh];
      buf1[sh]=Low[sh];
    }
    if (Close[sh]<Open[sh] && Open[sh]-Close[sh]>body*Point) {
      buf0[sh]=Low[sh];
      buf1[sh]=High[sh];
    }
  }
}
//+------------------------------------------------------------------+
Comments