Indicator Volumes Buys_Sells
Download script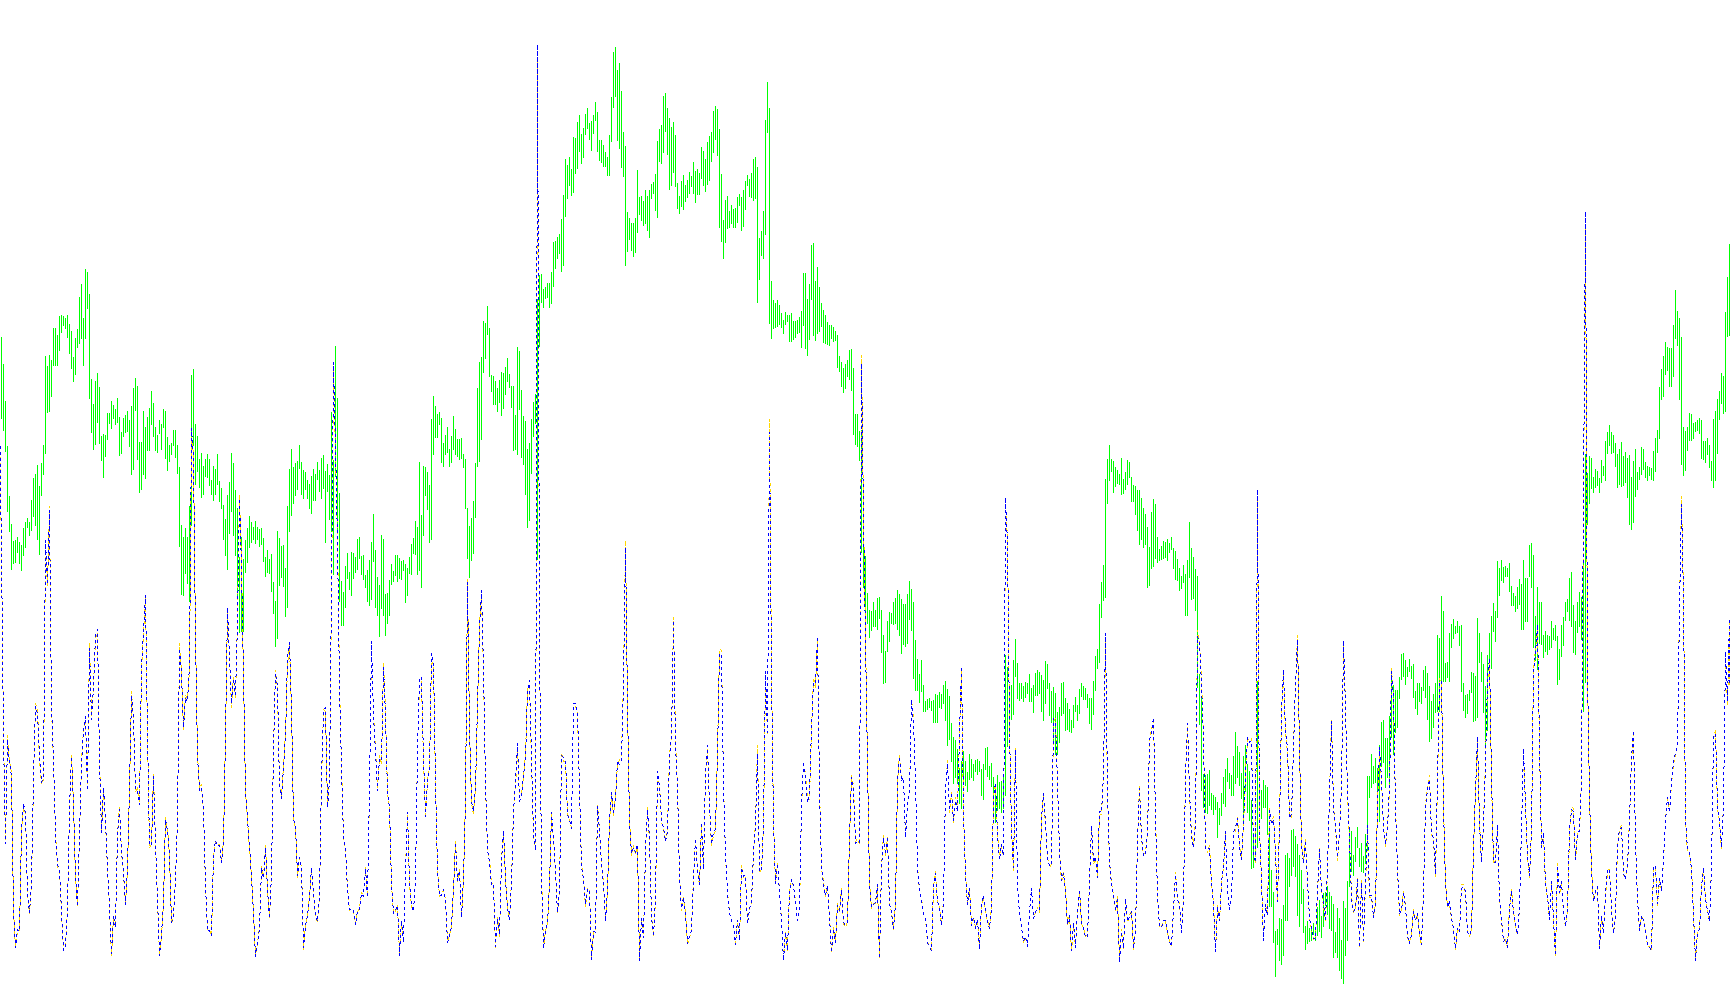
This indicator is designed to provide a visual representation of trading activity by breaking down the total trading volume into two distinct components. Instead of showing you a single volume bar, it analyzes price action during each candle to differentiate between specific types of market movement.
Core Logic and Functionality
The script monitors every candle on your chart and categorizes the behavior based on whether the price moved up, down, or remained unchanged. It then performs a mathematical distribution to split the total volume into two separate lines displayed in a dedicated window below your main chart.
How it processes each candle:
- Upward Movements (Bullish): When the closing price is higher than the opening price, the script calculates a value based on the "range" of the candle (the distance between the highest and lowest points). It uses this range to determine a proportional share of the volume. The total volume is then split into two parts: one representing the primary momentum and the other representing the secondary activity.
- Downward Movements (Bearish): When the closing price is lower than the opening price, the logic mirrors the upward movement but applies the math to account for selling pressure. It calculates the range of the candle and allocates the volume between two buffers to highlight the distribution of selling energy.
- Neutral Movements (Sideways): In instances where the opening and closing prices are exactly the same, the script takes a simplified approach. It ignores the range and simply splits the total volume of that candle into two equal halves.
Visual Representation
The results are plotted as two dotted lines:
- Red Line: Represents one portion of the calculated volume distribution.
- Green Line: Represents the remaining portion of the volume distribution.
By observing these two lines together, you can see how volume is being partitioned during different market phases. Rather than just seeing "how much" trading happened, this tool attempts to show a more nuanced "split" of that activity based on the price dynamics of each individual bar.
//+------------------------------------------------------------------+
//|                                            Indicador de algo.mq4 |
//|                                                          Gabito. |
//|                                        http://www.metaquotes.net |
//+------------------------------------------------------------------+
#property copyright "Gabito."
#property link      "http://www.metaquotes.net"

#property indicator_separate_window
#property indicator_buffers 2
#property indicator_color1 Red
#property indicator_color2 Green
//---- buffers
double Buffer1[];
double Buffer2[];
double cuenta;
double cuenta1;
int Periodo=11;

//+------------------------------------------------------------------+
//| Custom indicator initialization function                         |
//+------------------------------------------------------------------+
int init()
  {
//---- indicators
   SetIndexStyle(0,DRAW_LINE,STYLE_DOT);
   SetIndexBuffer(0,Buffer1);
   SetIndexStyle(1,DRAW_LINE,STYLE_DOT);
   SetIndexBuffer(1,Buffer2);


//----
   return(0);
  }
//----
int start()
  {
   int i,counted_bars=IndicatorCounted();
//----
   if(Bars<=Periodo) return(0);
//---- initial zero
   if(counted_bars<1)
      for(i=1;i<=Periodo;i++) Buffer1[Bars-i]=0.0;
//----
   i=Bars-Periodo-1;
   if(counted_bars>=Periodo) i=Bars-counted_bars-1;
   while(i>=0)
     {
     if(Close[i]>Open[i]) // up
     {
      cuenta=((((High[i]-Low[i]))*10000));
      cuenta1=(((Volume[i]-cuenta)));
      Buffer2[i]=((Volume[i]-(cuenta))/2)+cuenta;
      Buffer1[i]=Volume[i]-Buffer2[i];
     }
     if(Close[i]<Open[i]) // down
     {
      cuenta1=((((High[i]-Low[i]))*10000));
      cuenta=(((Volume[i]-cuenta1)));
      Buffer1[i]=((Volume[i]-(cuenta1))/2)+cuenta1;
      Buffer2[i]=Volume[i]-Buffer1[i];
     }
     if(Close[i]==Open[i]) // equal
     {
      cuenta=((Volume[i]/2));
      Buffer1[i]=cuenta;
      Buffer2[i]=Volume[i]-Buffer1[i];
     }
      i--;
     }
   return(0);
  }
//+------------------------------------------------------------------+
Comments