Indraws Volume Analysis v1.2
Download script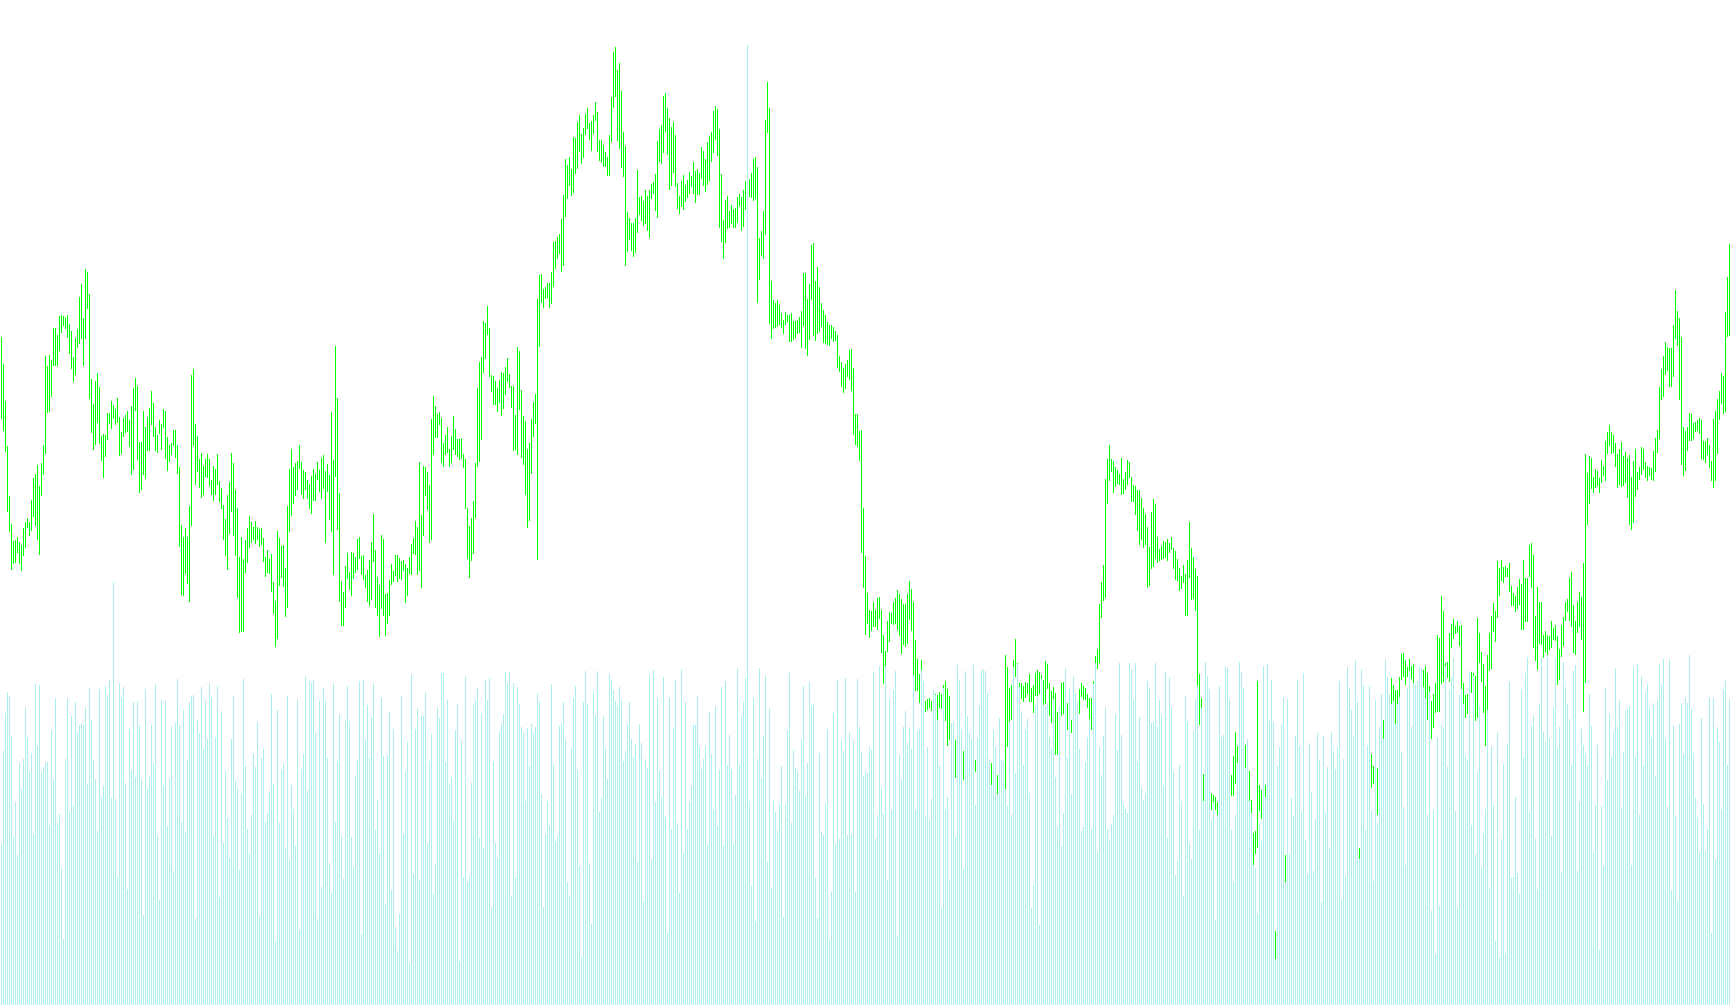
This tool is designed to provide traders with a deeper understanding of market volume by identifying and accumulating it between significant structural turning points. Rather than looking at volume in isolation, this script contextualizes trading activity based on the price action's peaks and valleys.
Core Logic Overview
The primary objective of the script is to measure "accumulated pressure." It treats major high and low points in the market as boundaries. When the market moves between these structural swing points, the script tracks the volume being traded during that specific move.
Key Functional Components
1. Structural Identification The script scans the historical price data to identify "Swing Points"—these are significant highs and lows where the market trend potentially shifts. By recognizing these landmarks, the tool can determine when a new movement cycle begins.
2. Volume Accumulation Once a new swing point is identified (either a high or a low), the script resets its internal counter. From that moment onward, it begins adding up the total volume of every candle until the next significant swing point is reached. This allows you to see the "total effort" behind a specific trend move.
3. Price Action Weighting (Normalization) To ensure the data is as accurate as possible, the script includes a normalization logic. It looks at the relationship between the candle's range (the distance between its highest and lowest price) and where the price actually closed.
- If the trend is strong and the candles are wide, it adjusts the calculation to reflect that relative scale.
- This helps in smoothing out the data so that you can better visualize the intensity of the volume relative to the actual movement of the price.
4. Visual Output The tool generates a histogram in a separate window below your main price chart. This visual representation allows you to see the building momentum of a trend. As the market moves toward a new peak or trough, the histogram builds, showing you exactly how much trading activity is backing that specific directional move.
Summary for the User
Think of this tool as a "momentum tracker." Instead of just telling you how much volume happened in the last five minutes, it tells you how much total volume has been traded since the last major market turn. This helps you identify whether a current price move is being supported by heavy trading activity or if the move is happening on low, potentially weak, participation.
//+------------------------------------------------------------------+
//|                                      Indraws Volume Analysis.mq4 |
//+------------------------------------------------------------------+

#property copyright "Copyright © 2007, Ryan Klefas"
#property link      "http://www.metaquotes.com"

#property indicator_separate_window
#property indicator_buffers 3
#property indicator_color1 DodgerBlue
#property indicator_color2 Red
#property indicator_color3 Violet


double directionUpBuffer[];
double directionDownBuffer[];
double outputBuffer[];


extern int  SwingPoint_Periods=50;
extern bool Backtesting=false;
extern bool ShowArrows=false;
extern bool Normalization=true;


int accumVol=0;


//+------------------------------------------------------------------+
//| Custom indicator initialization function                         |
//+------------------------------------------------------------------+
int init()
  {
//---- indicators
   SetIndexStyle(0, DRAW_ARROW, EMPTY, 2);
   SetIndexArrow(0, 233);
   SetIndexBuffer(0, directionUpBuffer);
   SetIndexStyle(1, DRAW_ARROW, EMPTY, 2);
   SetIndexArrow(1, 234);
   SetIndexBuffer(1, directionDownBuffer);
   SetIndexStyle(2,DRAW_HISTOGRAM);
   SetIndexBuffer(2,outputBuffer);


//----
   return(0);
  }
//+------------------------------------------------------------------+
//| Custom indicator deinitialization function                       |
//+------------------------------------------------------------------+
int deinit()
  {
//----
   Comment(" ");
//----
   return(0);
  }
//+------------------------------------------------------------------+
//| Custom indicator iteration function                              |
//+------------------------------------------------------------------+
int start()
{

//+------------------------------------------------------------------+

   int i, counter, limiter;
   double d, m;

   int counted_bars=IndicatorCounted();
   if(counted_bars<0) return(-1);
   if(counted_bars>0) counted_bars--;

   int limit=Bars-counted_bars;


   // Backtesting selection is to save the computer some processing time
   // Useful for more intensive indicators
   // Disabled by default


   if (Backtesting)
   {
      limiter = limit;
      Comment("Backtesting Mode Enabled");
   }
   else
   {
      limiter = 1000;
   }


   for(i = limiter; i > 0; i--)
   {
      if (highPoint(i))
      {
         if (ShowArrows)
            directionDownBuffer[i] = 0;

         accumVol=0;
      }


      if (lowPoint(i))
      {
         if (ShowArrows)
            directionUpBuffer[i] = 0;

         accumVol=0;
      }


         if (bearish(i))
            m = MathAbs(Low[i] - Close[i]);
         if (bullish(i))
            m = MathAbs(High[i] - Close[i]);

         d = (High[i]-Low[i]) / m;

         accumVol+=Volume[i];


         if (Normalization)
            outputBuffer[i]=accumVol/d;
         else
            outputBuffer[i]=accumVol;


   }

//+------------------------------------------------------------------+

   return(0);
}

//+------------------------------------------------------------------+
//| indicator functions                                              |
//+------------------------------------------------------------------+

double swingPoint(int shift)
{
   double val = iCustom(NULL, 0, "Swing_Point", SwingPoint_Periods, 0, shift);

   if (val < 99999999)     return (val);
   else                    return (-10);
}

//+------------------------------------------------------------------+

bool highPoint(int shift)
{  return (High[shift]==swingPoint(shift));  }

//+------------------------------------------------------------------+

bool lowPoint(int shift)
{  return (Low[shift]==swingPoint(shift));  }

//+------------------------------------------------------------------+

bool bearish(int shift)
{  return (Open[shift] < Close[shift]);  }

//+------------------------------------------------------------------+

bool bullish(int shift)
{  return (Open[shift] > Close[shift]);  }

//+------------------------------------------------------------------+

//+------------------------------------------------------------------+

//+------------------------------------------------------------------+

//+------------------------------------------------------------------+

//+------------------------------------------------------------------+

//+------------------------------------------------------------------+
Comments