in&out_v1
Download script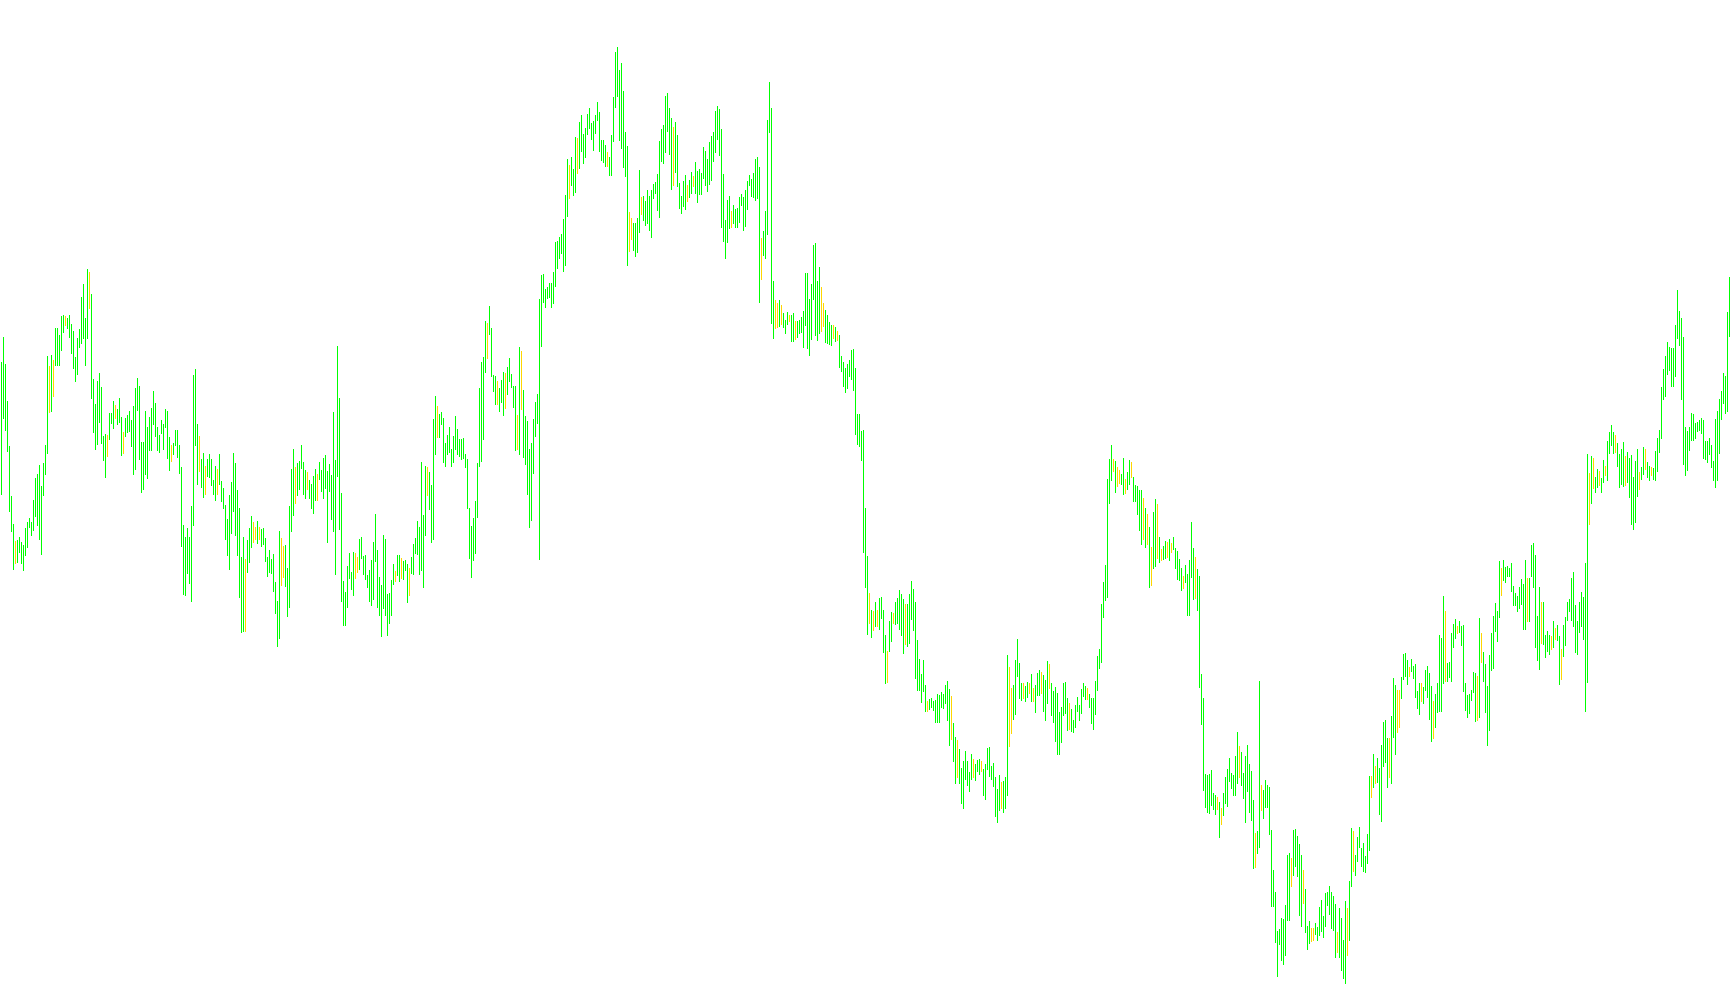
This technical tool is designed to identify and visualize specific price action patterns on a trading chart by analyzing the relationship between consecutive candles. It focuses on detecting moments where the market expands or contracts in terms of its high and low boundaries relative to the previous candle.
Core Logic and Functionality
The script scans the historical price data to identify two distinct types of movements:
1. "Out" Pattern Identification The tool looks for instances where a new candle's price range is broader than the one immediately preceding it. Specifically, it identifies a situation where the current candle reaches a higher high than the previous candle while simultaneously reaching a lower low. This signifies a move of expansion or increased volatility in both directions.
2. "In" Pattern Identification Conversely, the tool looks for instances where a new candle's price range is narrower or "nested" within the previous candle's boundaries. This occurs when the current candle fails to exceed the high of the previous candle and also fails to drop below its low. This signifies a contraction in price movement or a period of consolidation.
Visual and Alert Features
To help traders monitor these movements, the script provides several interactive options:
- Visual Mapping: Depending on your preferences, the tool can draw specific visual markers (histograms) on the chart to highlight where "In" or "Out" patterns have occurred. You can choose to display one, both, or neither of these signals.
- Timeframe Awareness: The script automatically recognizes the timeframe you are viewing (ranging from 1-minute charts up to monthly charts), ensuring the logic remains consistent regardless of the scale you use for analysis.
- Real-Time Notifications: The tool includes an alert system. When the script detects a new "In" or "Out" pattern forming in real-time, it can trigger an alert, allowing traders to react immediately to changes in market volatility without having to watch the screen constantly.
Summary of Purpose
Essentially, this tool acts as a filter for price action. It helps users distinguish between phases of market expansion (Out patterns) and market contraction (In patterns), providing a clearer picture of how momentum is shifting between individual candles.
//+------------------------------------------------------------------+
//|                                                        inout.mq4 |
//+------------------------------------------------------------------+
#property copyright "Copyright © 2006, free84"
#property link      "free84@laposte.net"

#property indicator_chart_window
#property indicator_buffers 2
#property indicator_color1 Yellow
#property indicator_width1 2
#property indicator_color2 Red
#property indicator_width2 1

extern bool Show_Alert = true;
extern bool Display_Out = false;
extern bool Display_In = true;

//---- buffers
double val1[];
double val2[];


//+------------------------------------------------------------------+
//| Custom indicator initialization function                         |
//+------------------------------------------------------------------+
int init()
  {

//---- indicator line
   IndicatorBuffers(3);
   SetIndexStyle(0,DRAW_HISTOGRAM,0,1);
   SetIndexStyle(1,DRAW_HISTOGRAM,0,1);
   SetIndexBuffer(0,val1);
   SetIndexBuffer(1,val2);

//----
   return(0);
  }
//+------------------------------------------------------------------+
//| Custom indicator deinitialization function                       |
//+------------------------------------------------------------------+
int deinit()
  {
//----

//----
   return(0);
  }
//+------------------------------------------------------------------+
//| Custom indicator iteration function                              |
//+------------------------------------------------------------------+
int start()
  {
   int    counted_bars=IndicatorCounted();
//----


   double Range, AvgRange;
   int counter, setalert;
   static datetime prevtime = 0;
   int shift;
   int shift1;
   int shift2;
   int shift3;
   string pattern, period;
   int setPattern = 0;
   int alert = 0;
   double O, O1, C, C1, L, L1, H, H1;

   if(prevtime == Time[0]) {
      return(0);
   }
   prevtime = Time[0];

   switch (Period()) {
      case 1:
         period = "M1";
         break;
      case 5:
         period = "M5";
         break;
      case 15:
         period = "M15";
         break;
      case 30:
         period = "M30";
         break;
      case 60:
         period = "H1";
         break;
      case 240:
         period = "H4";
         break;
      case 1440:
         period = "D1";
         break;
      case 10080:
         period = "W1";
         break;
      case 43200:
         period = "MN";
         break;
   }

   for (int j = 0; j < Bars; j++) {

   }

   for (shift = 0; shift < Bars; shift++) {

      setalert = 0;
      counter=shift;
      Range=0;
      AvgRange=0;
      for (counter=shift ;counter<=shift+9;counter++) {
         AvgRange=AvgRange+MathAbs(High[counter]-Low[counter]);
      }
      Range=AvgRange/9;
      shift1 = shift ;
      shift2 = shift + 1;

      O = Open[shift1];
      O1 = Open[shift2];
      H = High[shift1];
      H1 = High[shift2];
      L = Low[shift1];
      L1 = Low[shift2];
      C = Close[shift1];
      C1 = Close[shift2];


      // Check for Out pattern
      if ((H>H1)&&(L<L1)) {
         if (Display_Out == true)
           	{
		val1[shift]=Low[shift]; val2[shift]=High[shift];
		}


         if (setalert == 0 && Show_Alert == true) {
            pattern = "Out";
            setalert = 1;
         }
      }

      // Check for In pattern
      if ((H<H1)&&(L>L1)) {
         if (Display_In == true) {

         	{
		val1[shift]=High[shift]; val2[shift]=Low[shift];

         }
         if (setalert == 0 && Show_Alert == true) {
            pattern="In";
            setalert = 1;
         }
      }

      }
   } // End of for loop
//----
   return(0);
  }
//+------------------------------------------------------------------+
Comments