iKarakatica_v1
Download script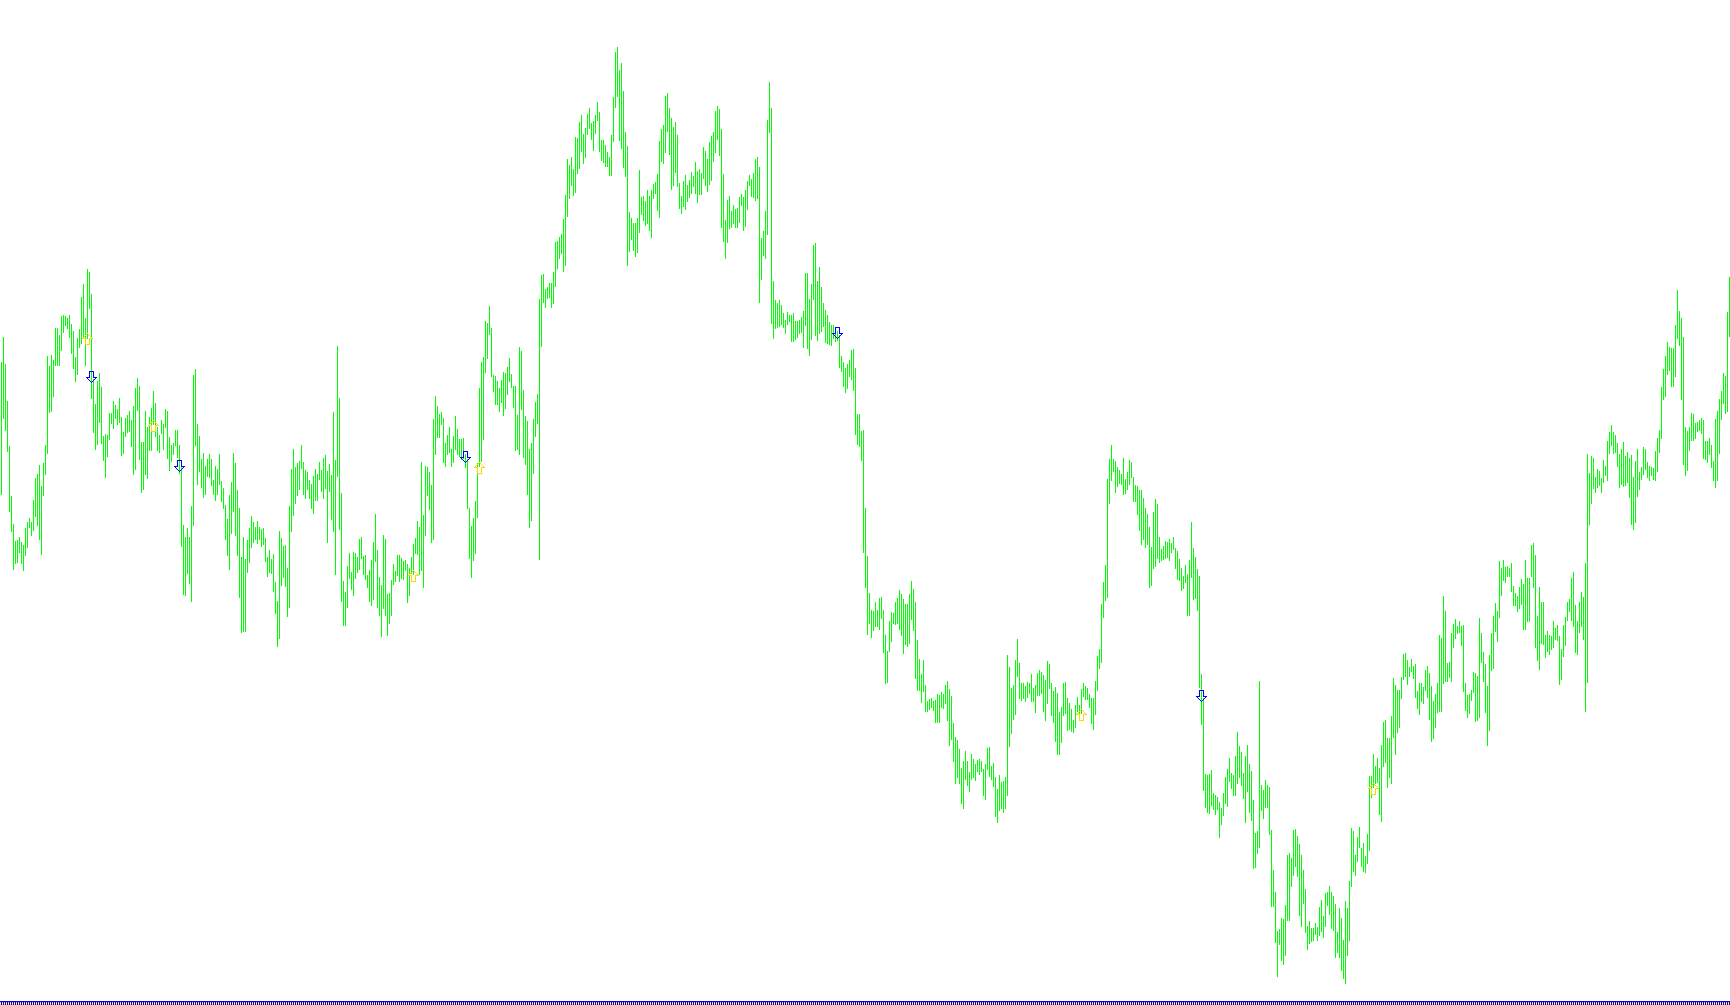
This tool is designed to provide visual signals on a trading chart by identifying specific momentum shifts and price trends. Instead of cluttering the screen with constant lines or bars, it acts as a filter that highlights potential entry points using directional arrows.
Core Logic & Functionality
The script works by analyzing three primary layers of market data simultaneously: price movement, momentum strength, and trend direction. Here is how it processes that information to generate signals:
1. Trend & Momentum Analysis The tool uses a specialized technical indicator (ADX) to separate the "buying pressure" from the "selling pressure." It monitors two specific values:
- Positive Directional Indicator: Measures the strength of upward movement.
- Negative Directional Indicator: Measures the strength of downward movement.
2. Price Comparison The script doesn't just look at the current price; it compares the current closing price against the closing price from a set period in the past (defined by the user). This allows the tool to confirm if the market is actually moving in a sustained direction or if it is just experiencing temporary noise.
3. Signal Generation Rules For a signal to appear on your chart, multiple conditions must be met at the same time:
- For Buy Signals (Blue): The current price must be higher than the price from the previous period, the positive momentum must be stronger than the negative momentum, and it ensures that a buy signal isn't repeated consecutively. When these conditions align, an arrow appears slightly below the current candle.
- For Sell Signals (Red): The current price must be lower than the price from the previous period, the negative momentum must be stronger than the positive momentum, and it prevents redundant sell signals. When these conditions align, an arrow appears slightly above the current candle.
How it Benefits the User
By combining price action with momentum filtering, the script aims to identify "high-probability" zones where the trend is confirmed by both the history of the price and the current strength of the market movement. It simplifies the decision-making process by translating complex mathematical data into clear, visual cues on the chart.
//+------------------------------------------------------------------+
//|                        Karacatica                                |
//|                        Äìèòðèé                                   |
//+------------------------------------------------------------------+
#property indicator_chart_window
#property indicator_buffers 2
#property indicator_color1 Red
#property indicator_color2 Blue
//----
extern int       iPeriod=70;
double ExtMapBuffer1[];
double ExtMapBuffer2[];
//+------------------------------------------------------------------+
//|                                                                  |
//+------------------------------------------------------------------+
  int init()
  {
   SetIndexStyle(0,DRAW_ARROW);
   SetIndexArrow(0,241);
   SetIndexBuffer(0,ExtMapBuffer1);
   SetIndexEmptyValue(0,0.0);
   SetIndexStyle(1,DRAW_ARROW);
   SetIndexArrow(1,242);
   SetIndexBuffer(1,ExtMapBuffer2);
   SetIndexEmptyValue(1,0.0);
   return(0);
  }
//+------------------------------------------------------------------+
//|                                                                  |
//+------------------------------------------------------------------+
  int start()
  {
   int limit;
   int counted_bars=IndicatorCounted();  // îïðåäåëèì êîëè÷åñòâî ïðîñ÷èòàíûõ áàðîâ ó èíäèêàòîðà
   limit=Bars-counted_bars;              // îïðåäåëÿåì ãðàíèöó äî êîòîðîé ðàññ÷èòûâàåì çíà÷åíèÿ èíäèêàòîðà
   if(limit >Bars-2)limit=Bars-2;
   static int ltr;
     for(int i=limit-1;i>=0;i--)
     {
      if(ExtMapBuffer1[i+1]!=0 && ExtMapBuffer1[i+1]!=EMPTY_VALUE)ltr=1;
      if(ExtMapBuffer2[i+1]!=0 && ExtMapBuffer2[i+1]!=EMPTY_VALUE)ltr=2;
      double pdi=iADX(NULL,0,iPeriod,0,MODE_PLUSDI,i);
      double mdi=iADX(NULL,0,iPeriod,0,MODE_MINUSDI,i);
      ExtMapBuffer1[i]=EMPTY_VALUE;
      ExtMapBuffer2[i]=EMPTY_VALUE;
      if(Close[i]>Close[i+iPeriod] && pdi>mdi && ltr!=1)ExtMapBuffer1[i]=Low[i]-Point*5;
      if(Close[i]<Close[i+iPeriod] && pdi<mdi && ltr!=2)ExtMapBuffer2[i]=High[i]+Point*5;
     }
     //-----
   return(0);
  }
//+------------------------------------------------------------------+
Comments