in&out
Download script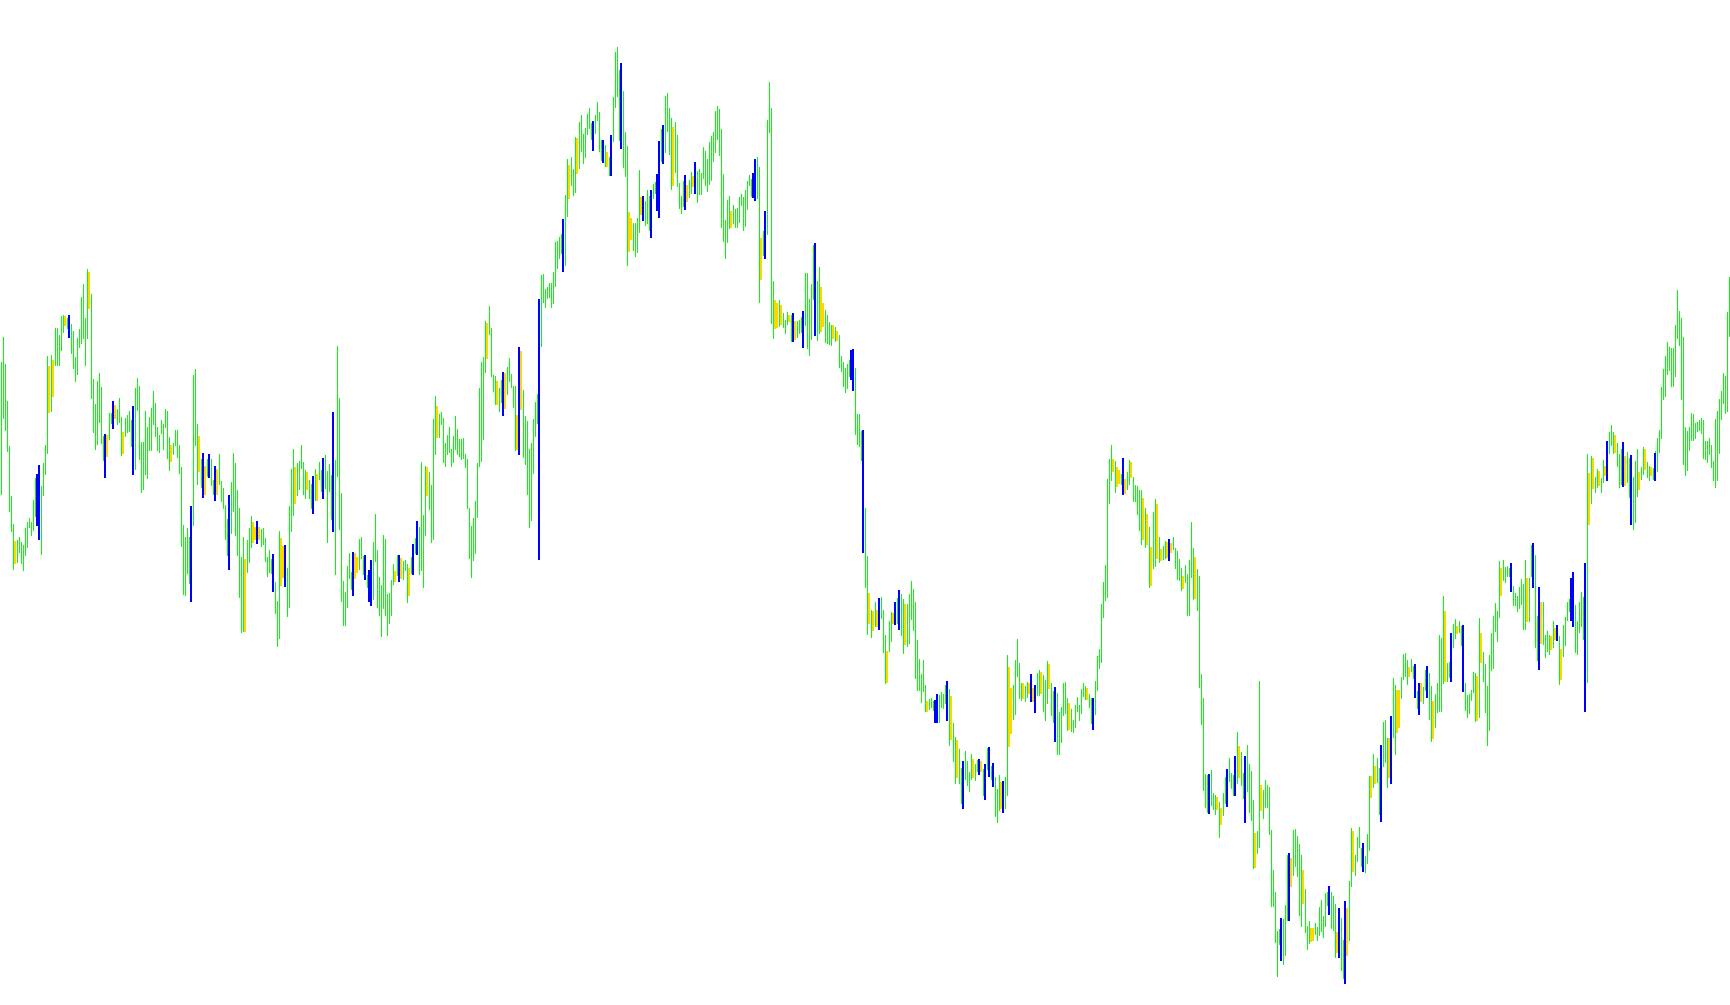
This tool is designed to help traders visually identify specific price action patterns on their trading charts by monitoring the relationship between consecutive candles. It focuses on detecting "Out" and "In" movements based on how the high and low points of the current candle compare to the previous one.
Core Logic & Functionality
The script scans the market history and identifies two distinct types of price behaviors:
- The "Out" Pattern: This is triggered when the current candle expands beyond the boundaries of the previous candle. Specifically, if the current candle has a higher high than the previous one and a lower low than the previous one, it is flagged as an "Out" pattern.
- The "In" Pattern: This occurs when the current candle stays within the boundaries of the previous candle. If the current candle has a lower high than the previous one and a higher low than the previous one (meaning it is "nested" inside the previous candle's range), it is flagged as an "In" pattern.
Visual and Notification Features
To make this information actionable for a trader, the script includes several customizable features:
- Visual Indicators: The tool places specific marks on the chart to highlight where these patterns occur. Depending on your settings, you can choose to see both "In" and "Out" patterns simultaneously or toggle them individually.
- Real-Time Alerts: The script is capable of sending notifications when these specific price movements occur in real-time, allowing traders to react quickly to market shifts without constantly staring at the screen.
- Multi-Timeframe Awareness: While it calculates based on the chart you are currently viewing, the logic is designed to be compatible across various timeframes (from 1-minute charts to monthly views), ensuring consistency regardless of your preferred trading style.
Summary for Traders
Essentially, this script acts as an automated "pattern spotter." It filters out market noise by highlighting moments where price volatility expands (Out) or contracts (In), providing a clear visual map of the market's immediate momentum and range dynamics.
//+------------------------------------------------------------------+
//|                                                        inout.mq4 |
//+------------------------------------------------------------------+
#property copyright "Copyright © 2006, free84"
#property link      "free84@laposte.net"

#property indicator_chart_window
#property indicator_buffers 2
#property indicator_color1 Blue
#property indicator_color2 Red

extern bool Show_Alert = true;
extern bool Display_Out = true;
extern bool Display_In = true;

//---- buffers
double val1[];
double val2[];


//+------------------------------------------------------------------+
//| Custom indicator initialization function                         |
//+------------------------------------------------------------------+
int init()
  {

//---- indicator line
   IndicatorBuffers(3);
   SetIndexStyle(0,DRAW_HISTOGRAM,0,4);
   SetIndexStyle(1,DRAW_HISTOGRAM,0,4);
   SetIndexBuffer(0,val1);
   SetIndexBuffer(1,val2);

//----
   return(0);
  }
//+------------------------------------------------------------------+
//| Custom indicator deinitialization function                       |
//+------------------------------------------------------------------+
int deinit()
  {
//----

//----
   return(0);
  }
//+------------------------------------------------------------------+
//| Custom indicator iteration function                              |
//+------------------------------------------------------------------+
int start()
  {
   int    counted_bars=IndicatorCounted();
//----


   double Range, AvgRange;
   int counter, setalert;
   static datetime prevtime = 0;
   int shift;
   int shift1;
   int shift2;
   int shift3;
   string pattern, period;
   int setPattern = 0;
   int alert = 0;
   double O, O1, C, C1, L, L1, H, H1;

   if(prevtime == Time[0]) {
      return(0);
   }
   prevtime = Time[0];

   switch (Period()) {
      case 1:
         period = "M1";
         break;
      case 5:
         period = "M5";
         break;
      case 15:
         period = "M15";
         break;
      case 30:
         period = "M30";
         break;
      case 60:
         period = "H1";
         break;
      case 240:
         period = "H4";
         break;
      case 1440:
         period = "D1";
         break;
      case 10080:
         period = "W1";
         break;
      case 43200:
         period = "MN";
         break;
   }

   for (int j = 0; j < Bars; j++) {

   }

   for (shift = 0; shift < Bars; shift++) {

      setalert = 0;
      counter=shift;
      Range=0;
      AvgRange=0;
      for (counter=shift ;counter<=shift+9;counter++) {
         AvgRange=AvgRange+MathAbs(High[counter]-Low[counter]);
      }
      Range=AvgRange/9;
      shift1 = shift ;
      shift2 = shift + 1;

      O = Open[shift1];
      O1 = Open[shift2];
      H = High[shift1];
      H1 = High[shift2];
      L = Low[shift1];
      L1 = Low[shift2];
      C = Close[shift1];
      C1 = Close[shift2];


      // Check for Out pattern
      if ((H>H1)&&(L<L1)) {
         if (Display_Out == true)
           	{
		val1[shift]=Low[shift]; val2[shift]=High[shift];
		}


         if (setalert == 0 && Show_Alert == true) {
            pattern = "Out";
            setalert = 1;
         }
      }

      // Check for In pattern
      if ((H<H1)&&(L>L1)) {
         if (Display_In == true) {

         	{
		val1[shift]=High[shift]; val2[shift]=Low[shift];

         }
         if (setalert == 0 && Show_Alert == true) {
            pattern="In";
            setalert = 1;
         }
      }

      }
   } // End of for loop
//----
   return(0);
  }
//+------------------------------------------------------------------+
Comments