Impulse CDC
Download script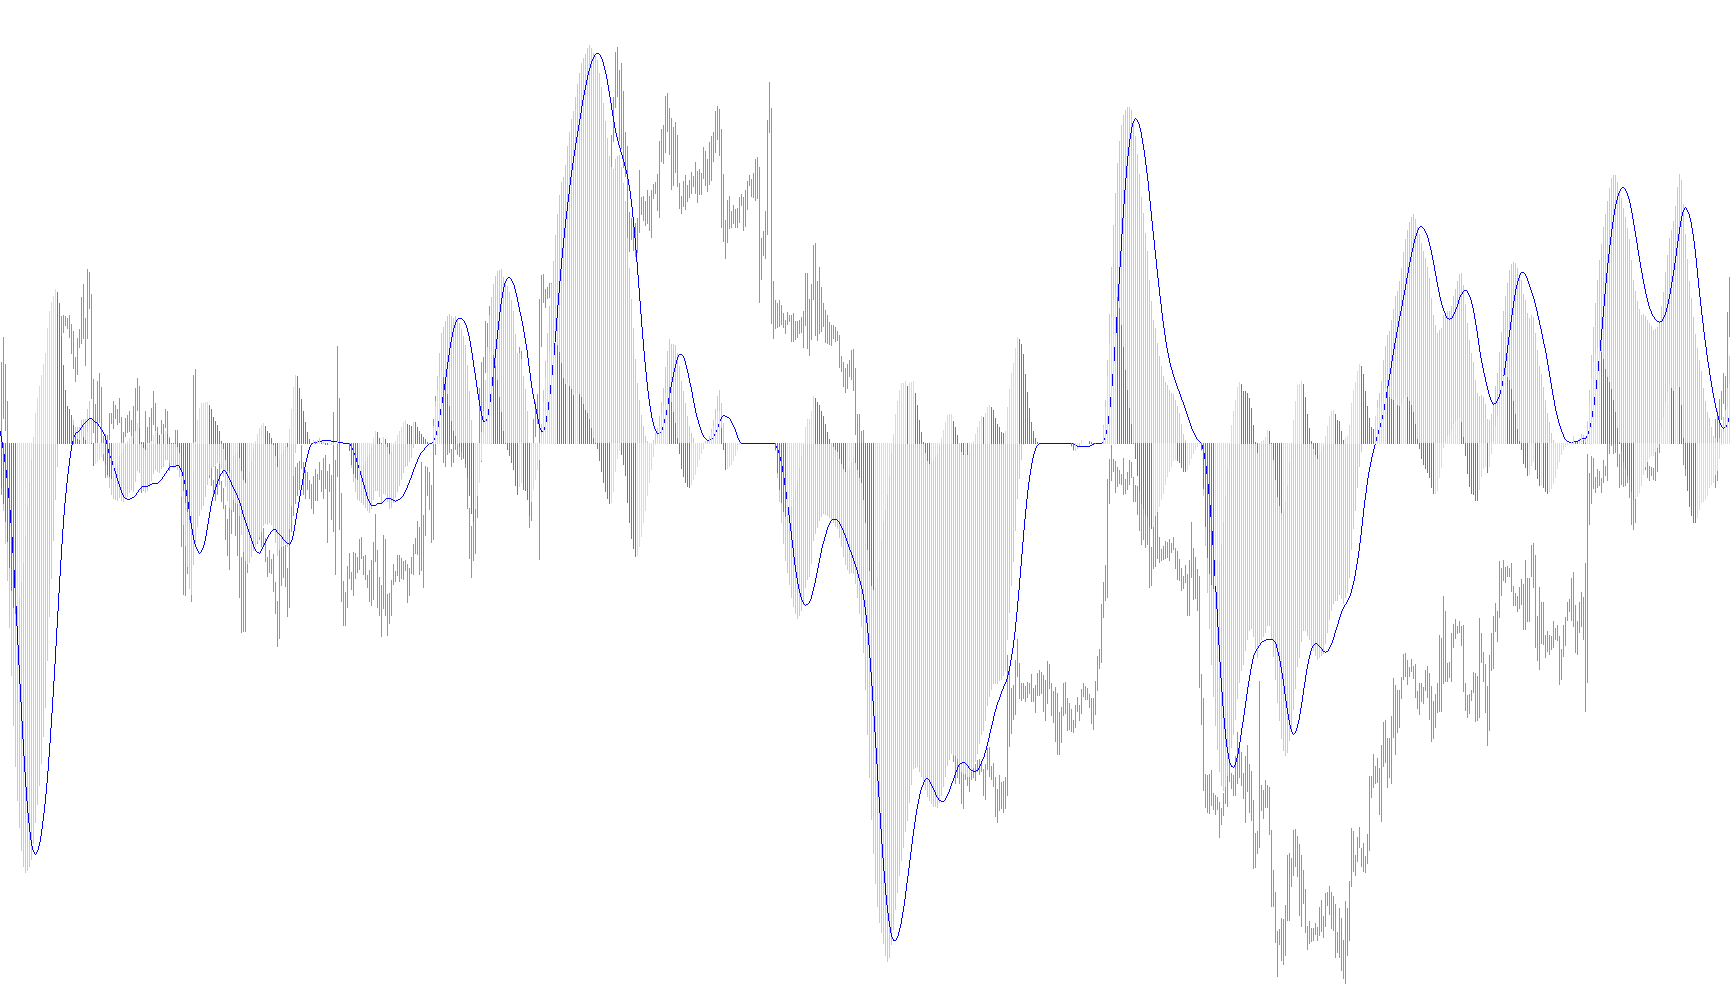
The Cronex Impulse CD Color is a technical analysis tool designed to help traders visualize price momentum and identify potential trend shifts by measuring the distance between moving averages. Unlike standard indicators that only track price, this script focuses on "impulse" movements—essentially identifying when the market is pushing aggressively in one direction.
How the Logic Works
The indicator operates through a three-step mathematical process to filter out market noise and highlight significant trends:
1. Establishing the Foundation (Impulse Calculation) The tool begins by calculating three different types of moving averages based on your chosen settings. It looks at high prices, low prices, and weighted prices to determine the "master" momentum of the market.
- If the master momentum rises above the high price average, it identifies an upward impulse.
- If the master momentum falls below the low price average, it identifies a downward impulse. The script then calculates the specific difference (the "gap") between these values, creating a base measurement of market strength.
2. Creating the Signal Baseline Once the primary impulse is established, the script calculates a "Signal Line." Think of this as a smoothed average of the impulses found in the first step. By averaging the momentum over time, it creates a stable baseline that allows the user to see whether the current momentum is accelerating, slowing down, or remaining steady.
3. Visualizing Trend Divergence (Color Coding) The final and most visible part of the logic compares the current impulse against the signal line to determine the direction of the trend:
- Upward Momentum: If the gap between the current impulse and the signal line is increasing, the indicator highlights this as upward movement.
- Downward Momentum: If that gap is shrinking or reversing in a negative direction, it highlights the downward pressure.
Summary for Traders
Instead of just showing you where the price is, this tool shows you how hard the price is moving. By monitoring the relationship between the impulse and its signal line, traders can better visualize the "strength" of a move. When the visual elements shift colors or change height, it suggests that the market momentum is actively expanding in a specific direction, helping to identify high-probability entry points and trend endurance.
//+------------------------------------------------------------------+
//|                                      Cronex Impulse CD Color.mq4 |
//|                                        Copyright © 2007, Cronex. |
//|                                       http://www.metaquotes.net/ |
//+------------------------------------------------------------------+
#property  copyright "Copyright © 2008, Cronex"
#property  link      "http://www.metaquotes.net/"
//---- indicator settings
#property  indicator_separate_window
#property  indicator_buffers 4
#property  indicator_color1  SteelBlue
#property  indicator_color2  DarkOrange
#property  indicator_color3  Green
#property  indicator_color4  Red
//---- indicator parameters
extern int SlowMA=34;
extern int FastMA=14;
extern int SignalMA=9;
//---- indicator buffers

double     MacdDivrBuffer[];
double     SignalBuffer[];
double     CDDivrBuffUP[];
double     CDDivrBuffDN[];

//+------------------------------------------------------------------+
//| Custom indicator initialization function                         |
//+------------------------------------------------------------------+
int init()
  {

  //---- indicator buffers mapping
   SetIndexBuffer(0,MacdDivrBuffer);
   SetIndexBuffer(1,SignalBuffer);
   SetIndexBuffer(2,CDDivrBuffUP);
   SetIndexBuffer(3,CDDivrBuffDN);
//---- drawing settings

   SetIndexStyle(0,DRAW_HISTOGRAM);
   SetIndexStyle(1,DRAW_LINE);
   SetIndexStyle(2,DRAW_HISTOGRAM);
   SetIndexStyle(3,DRAW_HISTOGRAM);

   SetIndexEmptyValue(0,0) ;
   SetIndexEmptyValue(1,0) ;
   SetIndexEmptyValue(2,0) ;
   SetIndexEmptyValue(3,0) ;
   IndicatorDigits(Digits);

//---- name for DataWindow and indicator subwindow label
   IndicatorShortName("Cronex Impulse CD("+SlowMA+","+FastMA+","+SignalMA+")");
   SetIndexLabel(0,"Impulse MACD");
   SetIndexLabel(1,"Signal");
   SetIndexLabel(2,"Impulse CD");
   SetIndexLabel(3,"Impulse CD");
//---- initialization done
   return(0);
  }
//+------------------------------------------------------------------+
//| Moving Averages Convergence/Divergence                           |
//+------------------------------------------------------------------+
int start()
  {
   int limit;
   int counted_bars=IndicatorCounted();
   double HiInd,LoInd,MasterInd,CDDivr;
//---- last counted bar will be recounted
   if(counted_bars>0) counted_bars--;
   limit=Bars-counted_bars;
//---- macd counted in the 1-st buffer
   for(int i=0; i<limit; i++)
    {
     HiInd=iMA(NULL,0,SlowMA,0,MODE_SMMA,PRICE_HIGH,i);
     LoInd=iMA(NULL,0,SlowMA,0,MODE_SMMA,PRICE_LOW,i);
     MasterInd=iMA(NULL,0,FastMA,0,MODE_LWMA,PRICE_WEIGHTED,i);

     if(MasterInd>HiInd)
      MacdDivrBuffer[i]=MasterInd-HiInd;

     if(MasterInd<LoInd)
      MacdDivrBuffer[i]=MasterInd-LoInd;
    }
//---- signal line counted in the 2-nd buffer
   for(i=0; i<limit; i++)
       SignalBuffer[i]=iMAOnArray(MacdDivrBuffer,Bars,SignalMA,0,MODE_SMA,i);

   for(i=0; i<limit; i++)
      {
       if((MacdDivrBuffer[i]-SignalBuffer[i])> (MacdDivrBuffer[i+1]-SignalBuffer[i+1]))CDDivrBuffUP[i]=MacdDivrBuffer[i]-SignalBuffer[i];
       if((MacdDivrBuffer[i]-SignalBuffer[i])< (MacdDivrBuffer[i+1]-SignalBuffer[i+1]))CDDivrBuffDN[i]=MacdDivrBuffer[i]-SignalBuffer[i];
      }

//---- done
   return(0);
  }
//+------------------------------------------------------------------+
Comments