i-Friday_Sig_v2
Indicator

i-Friday_Sig_v2

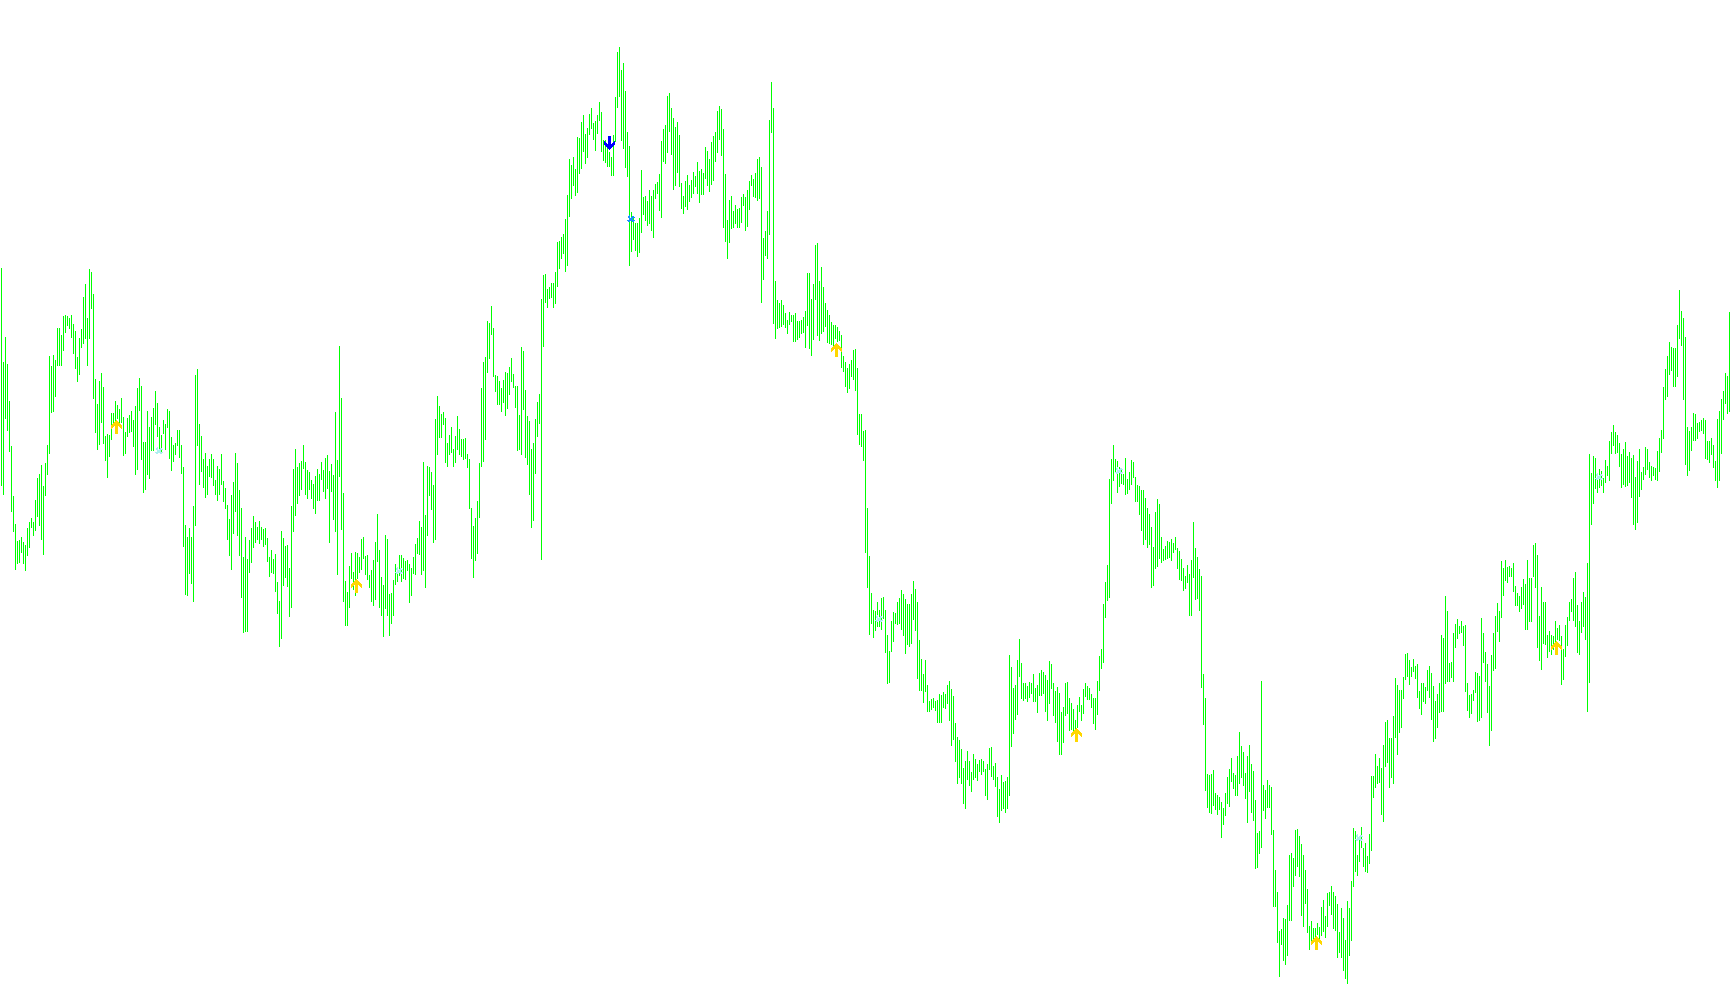
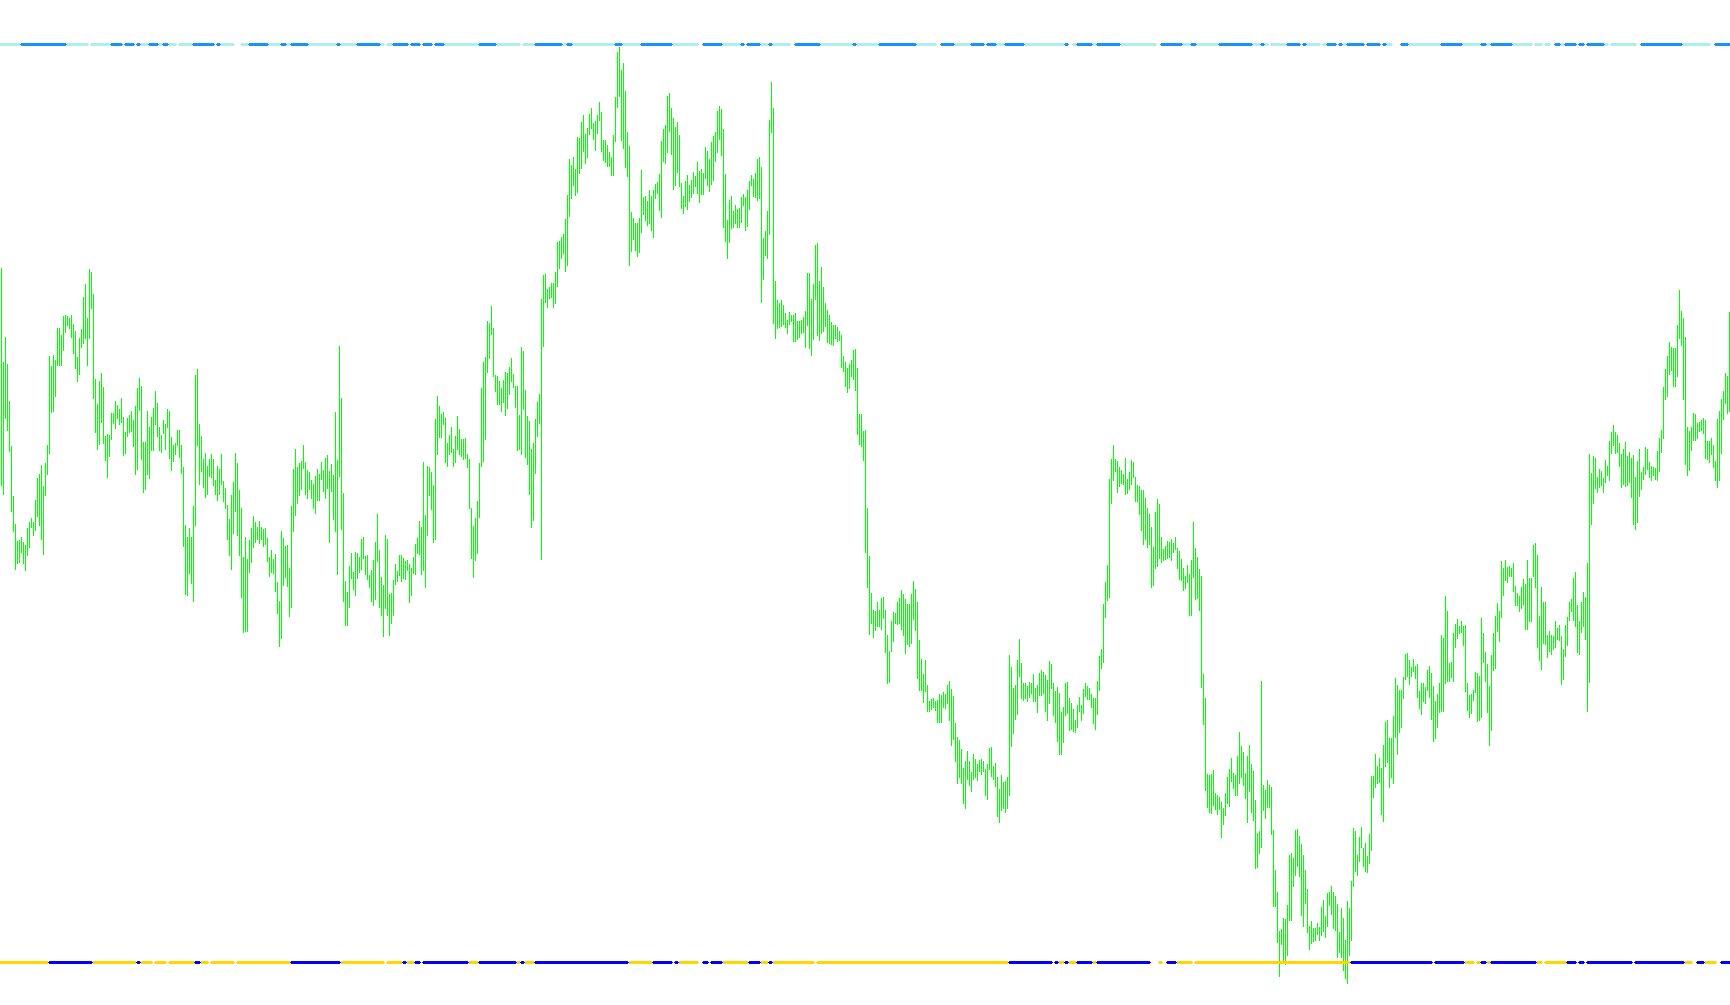
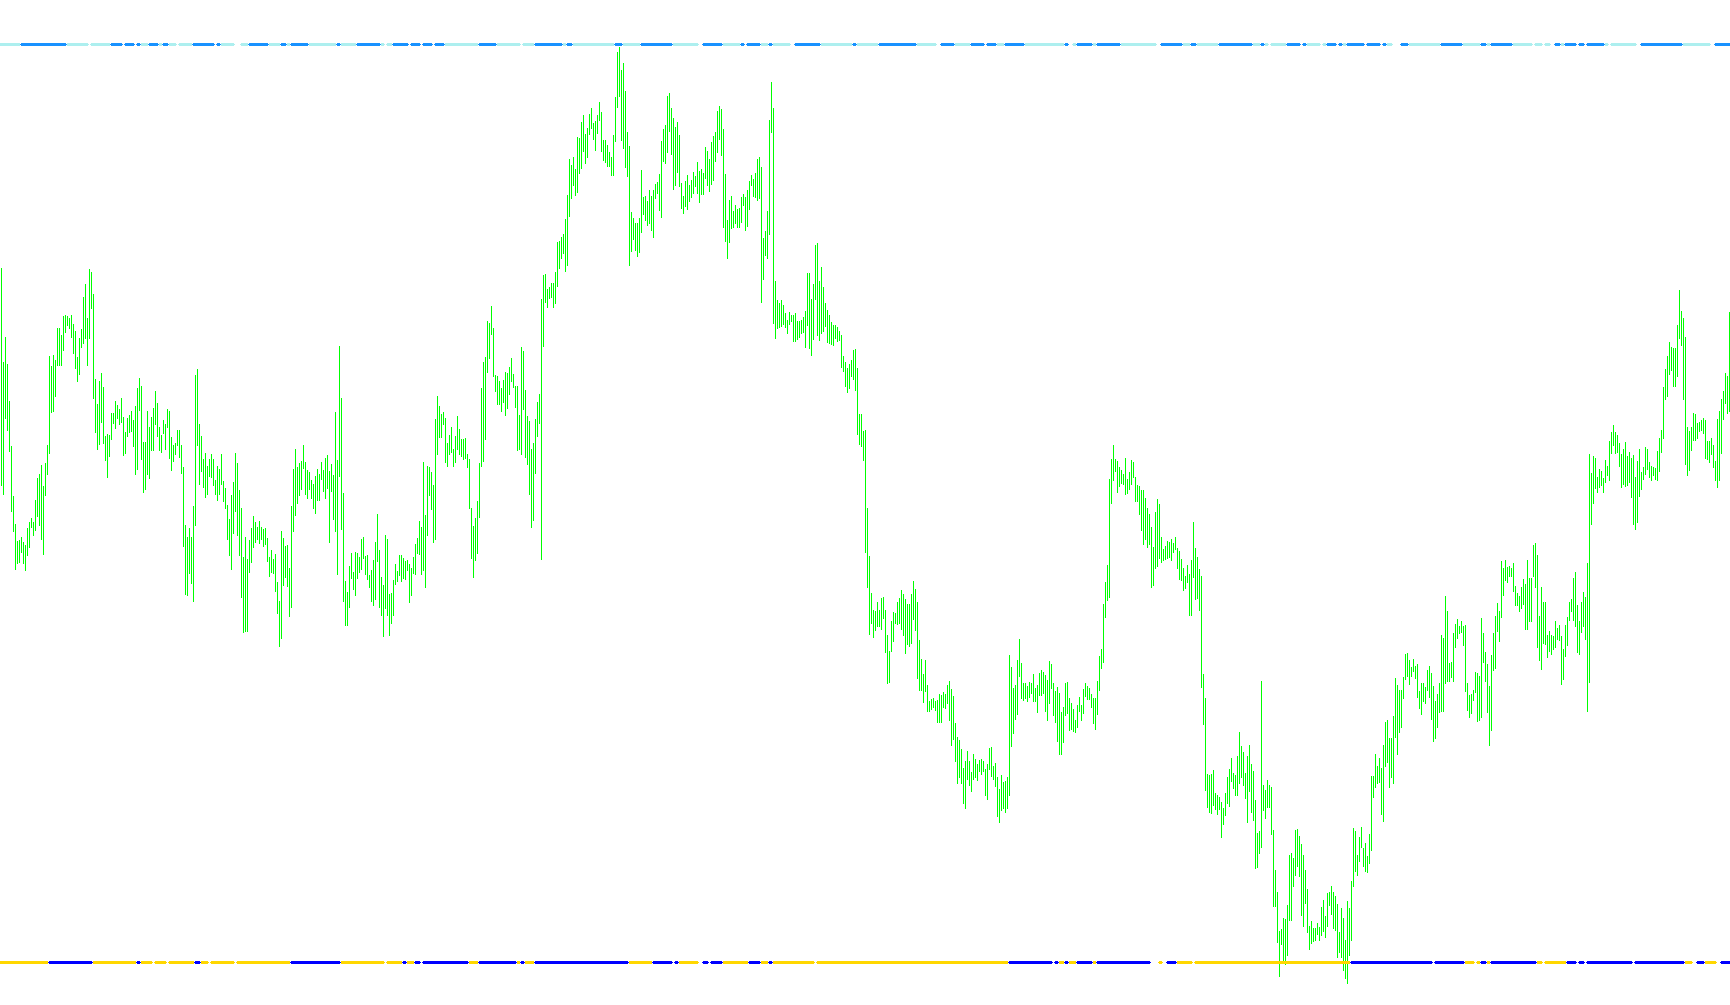
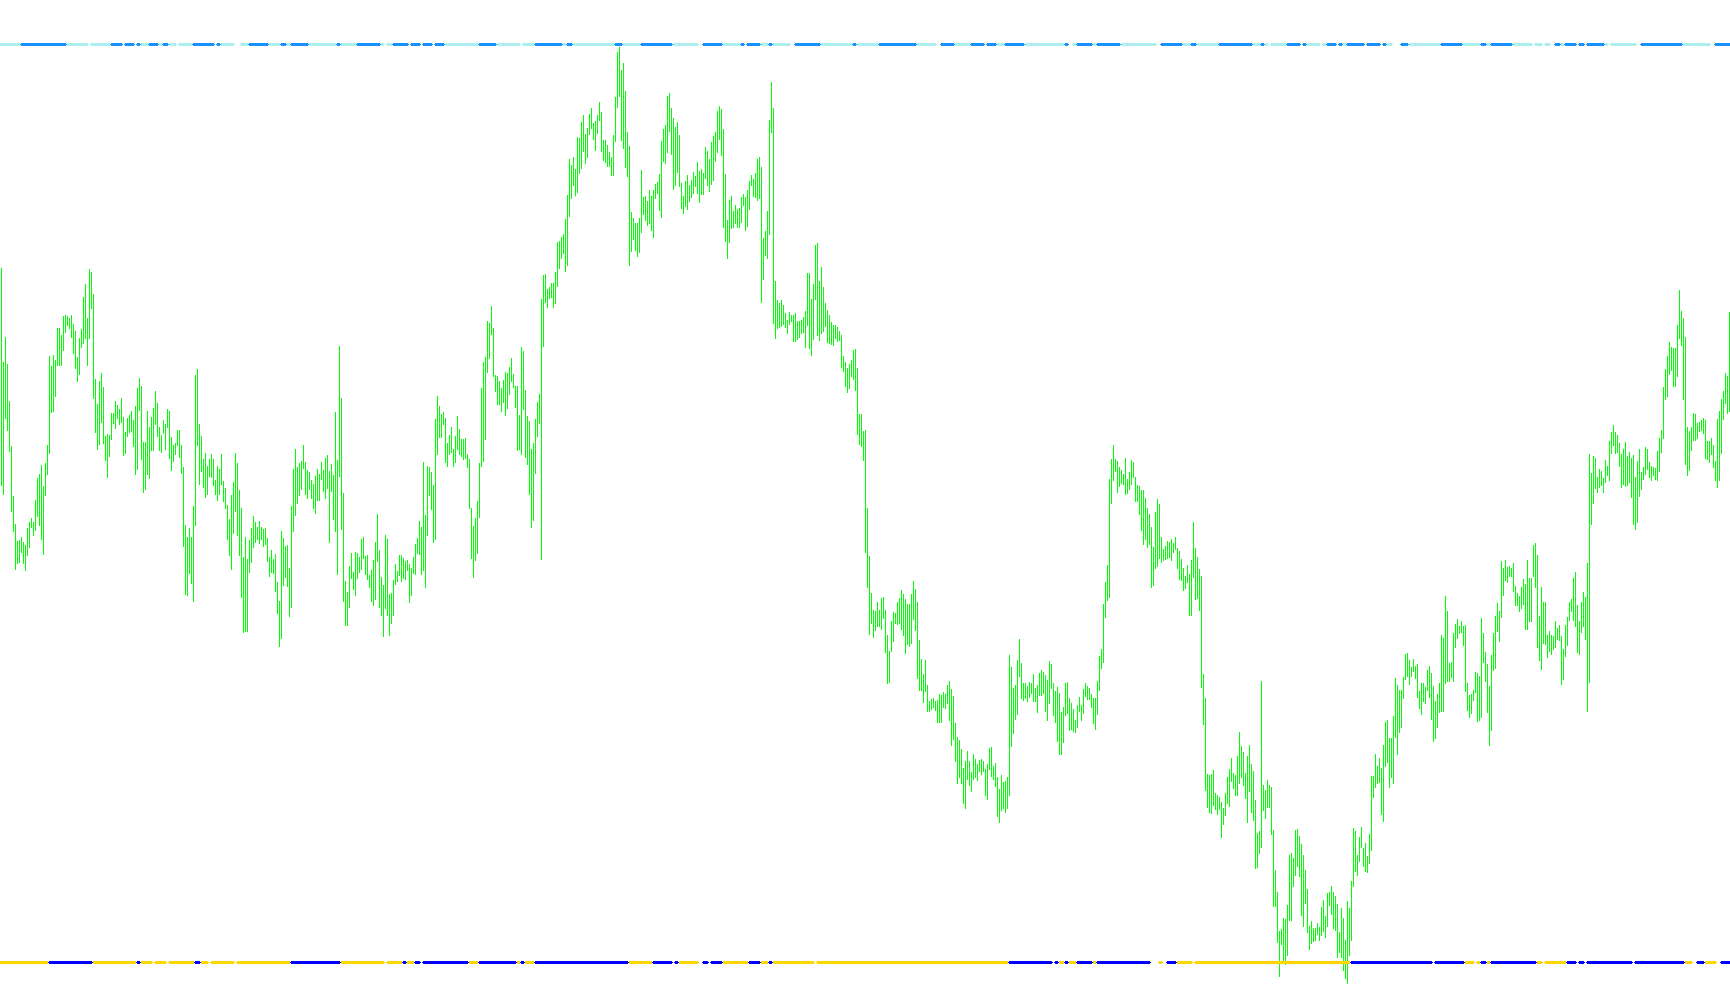
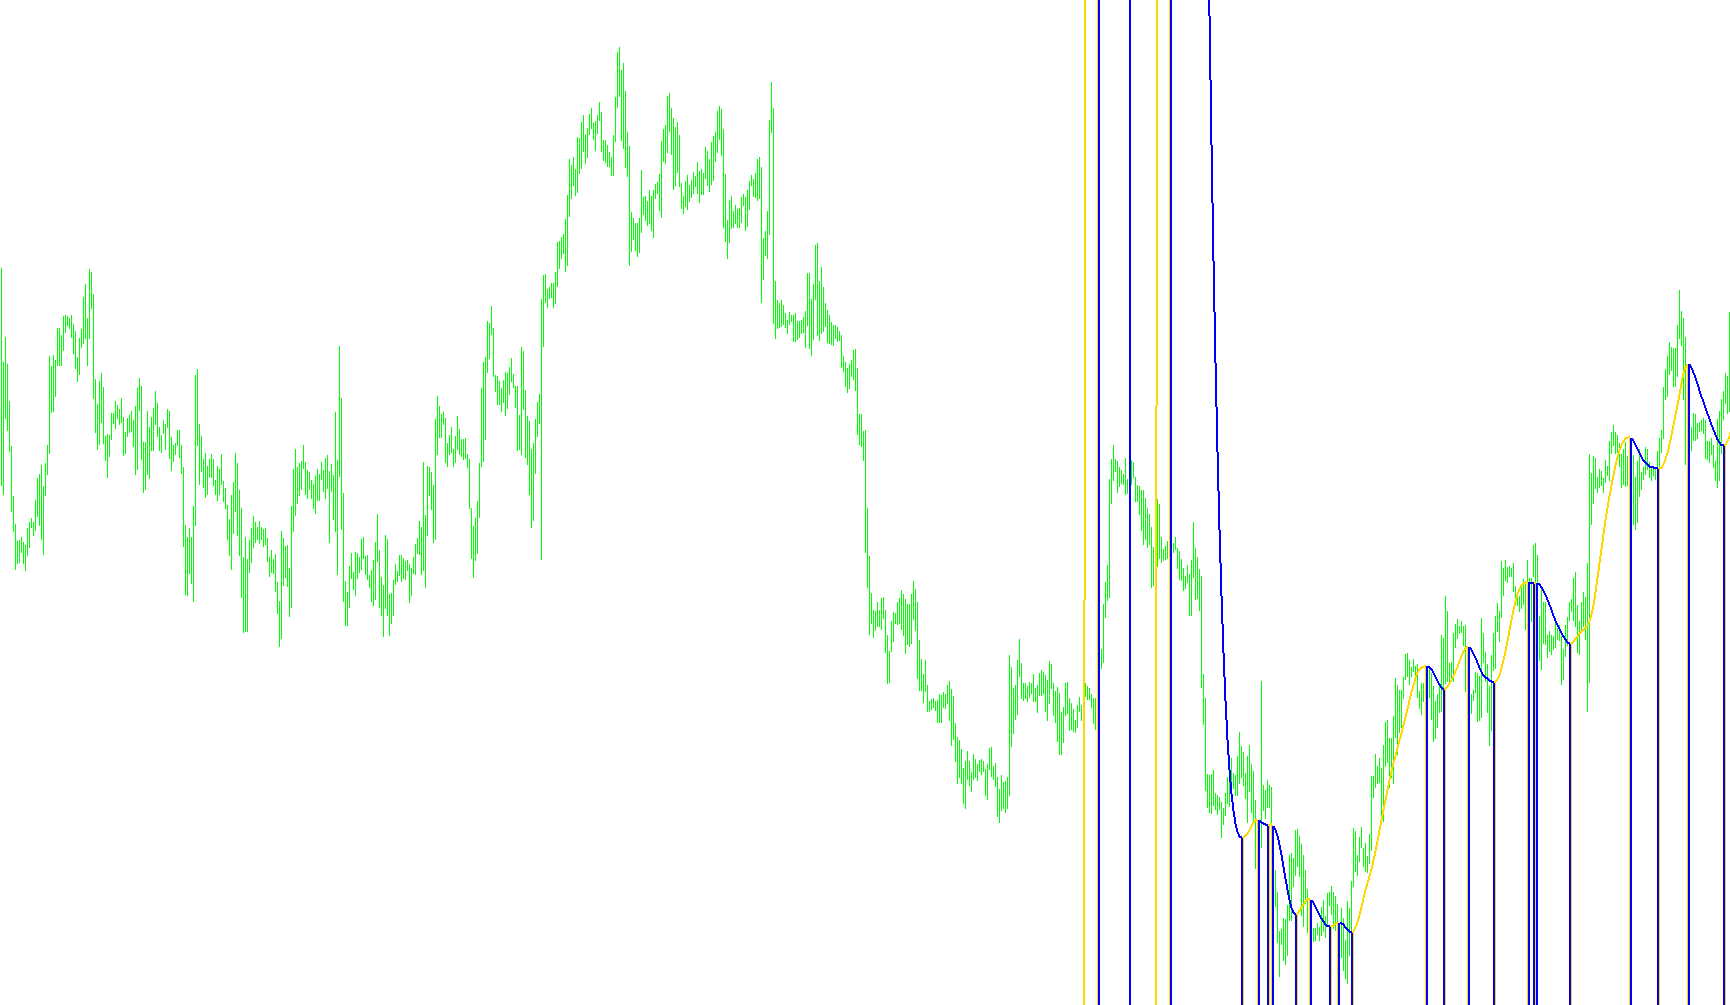
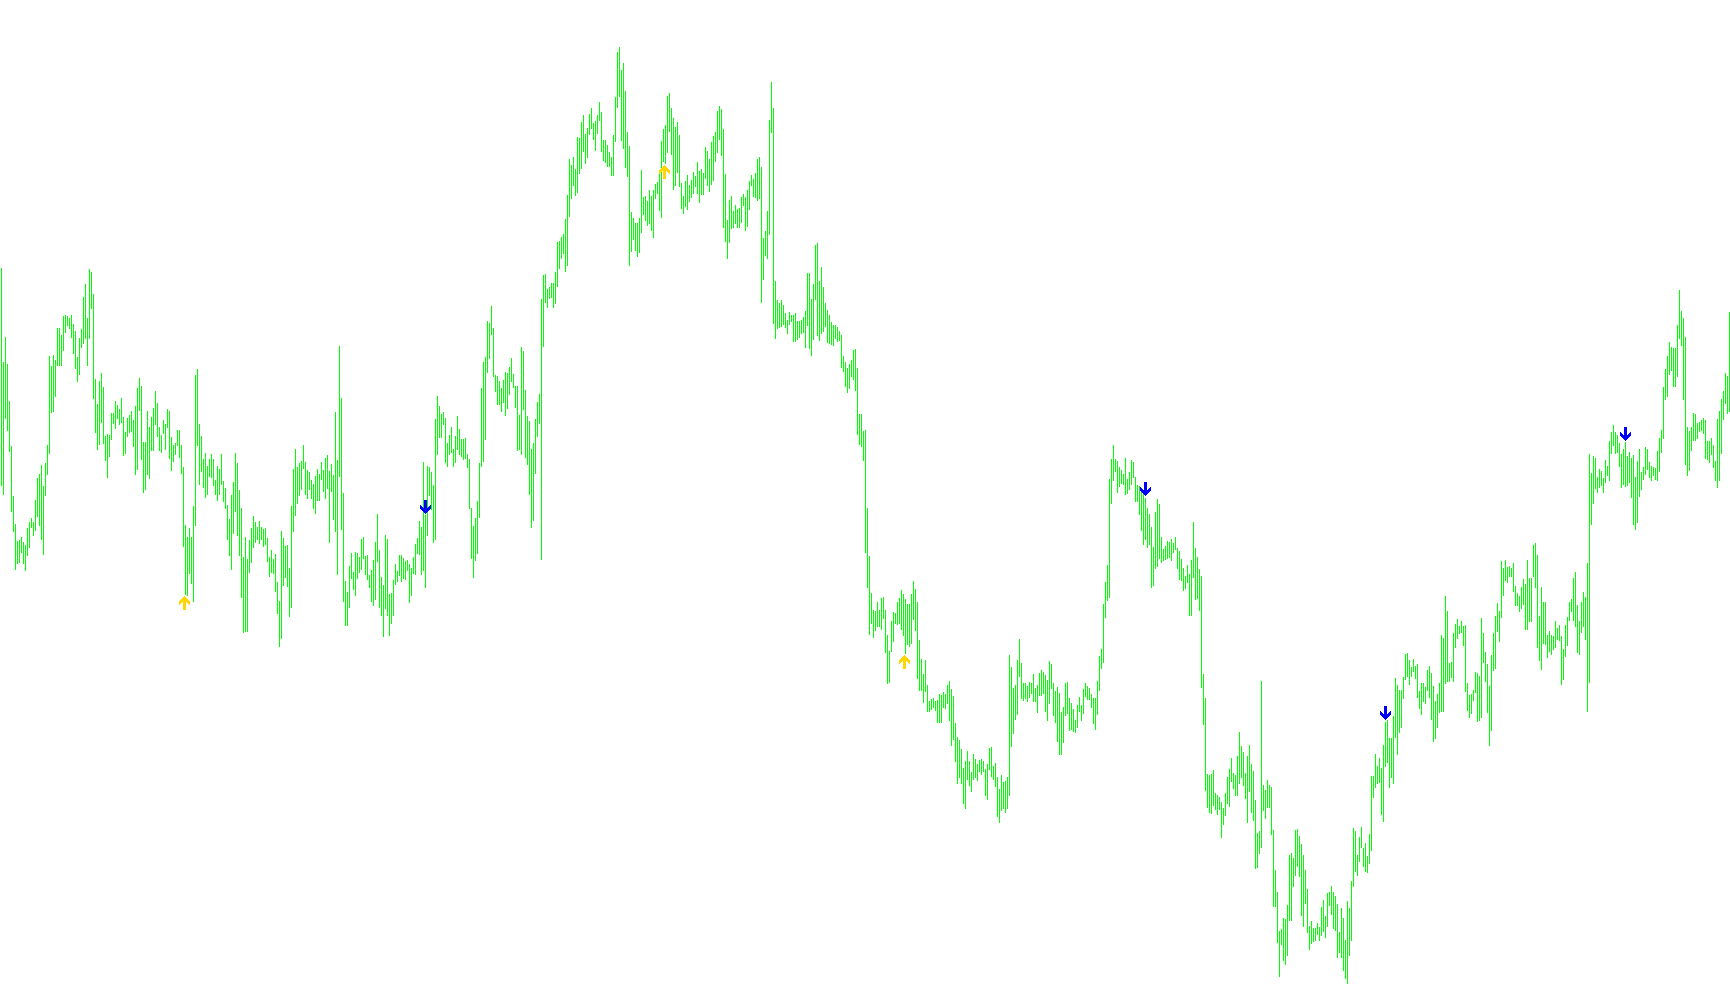
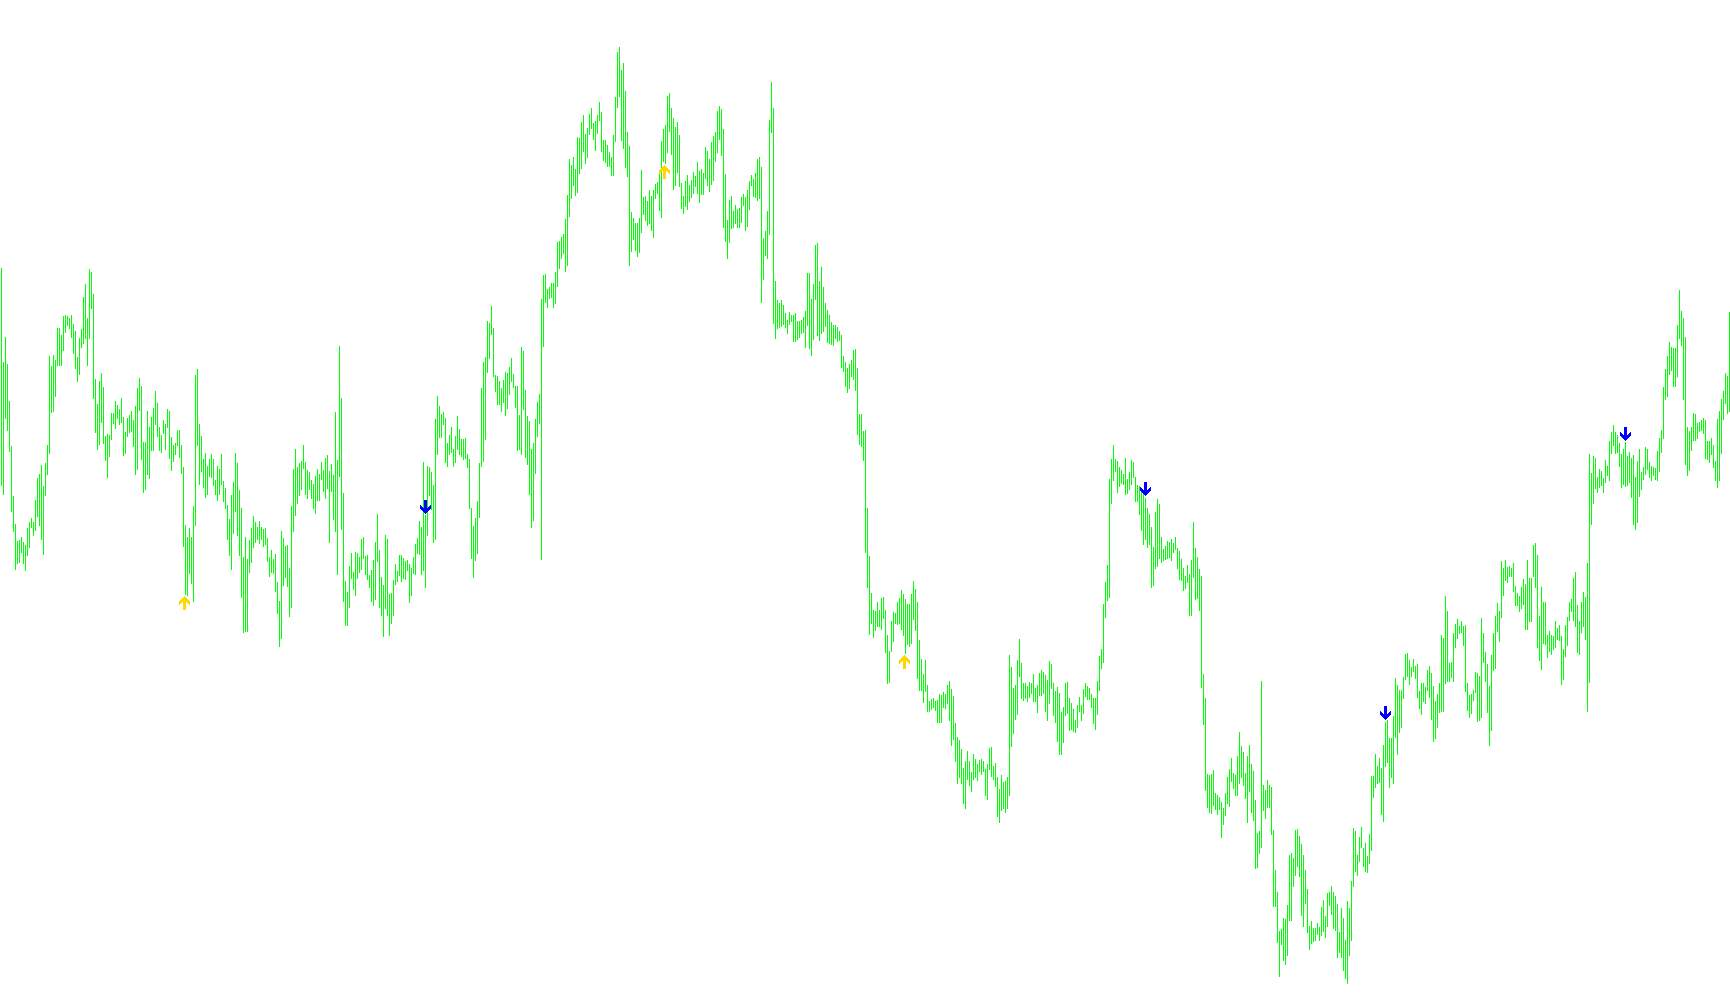
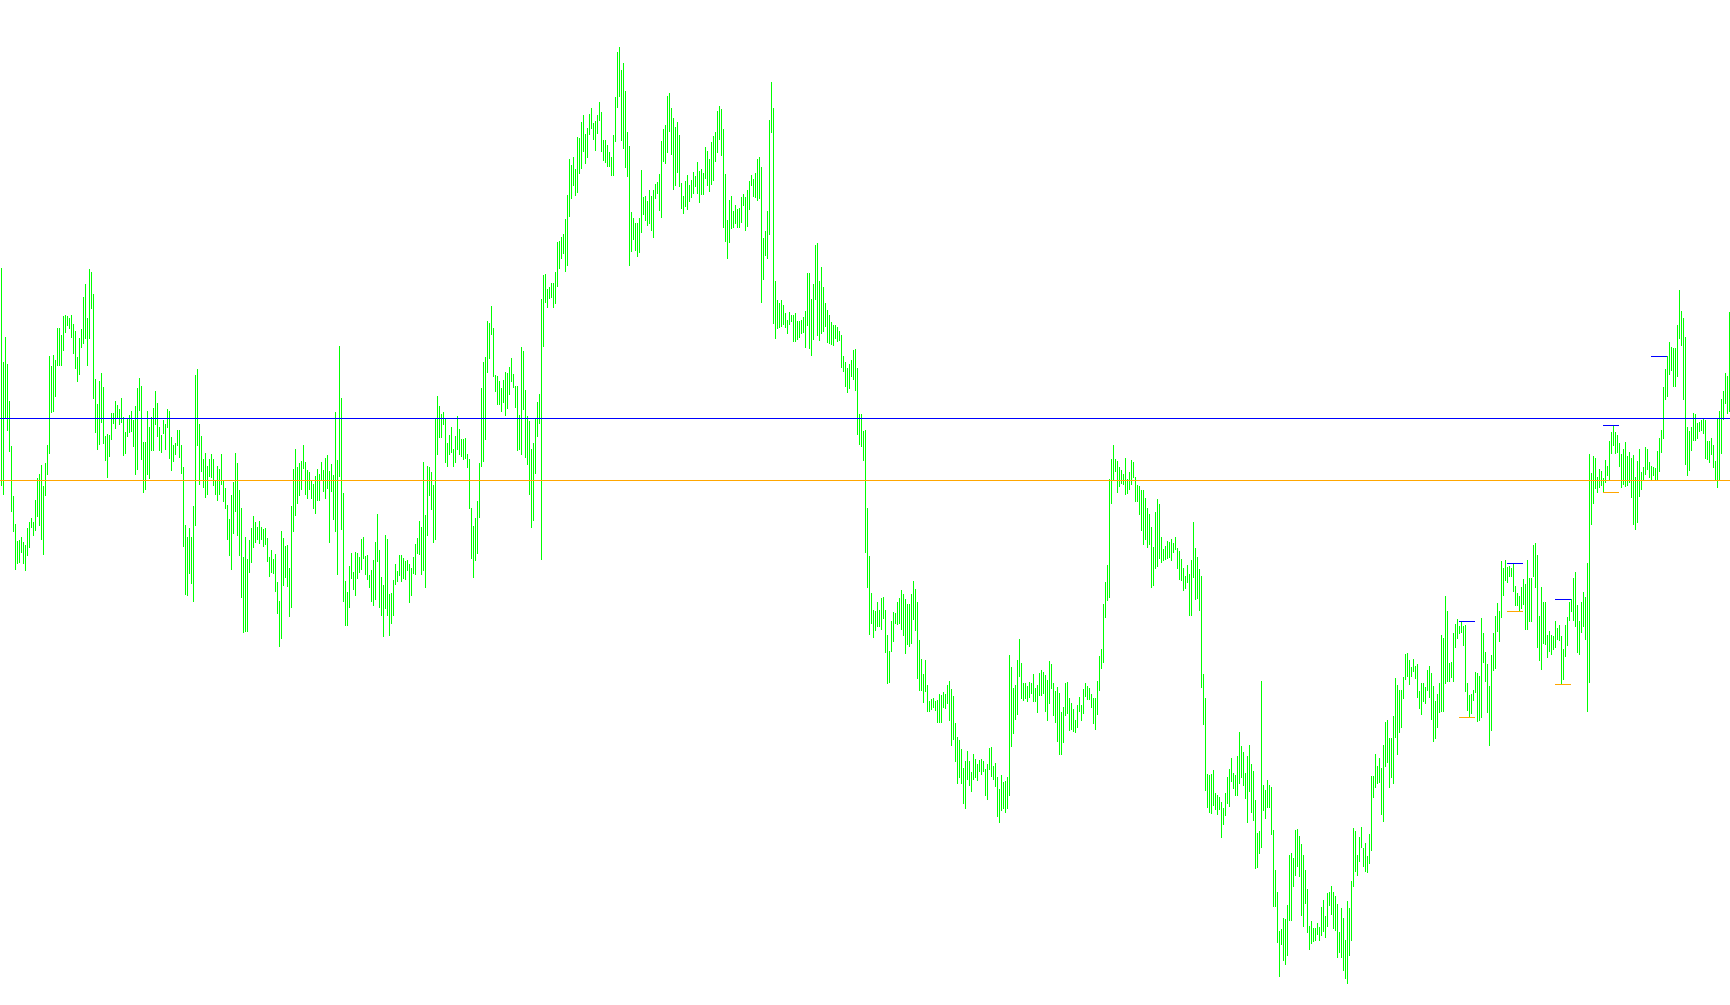
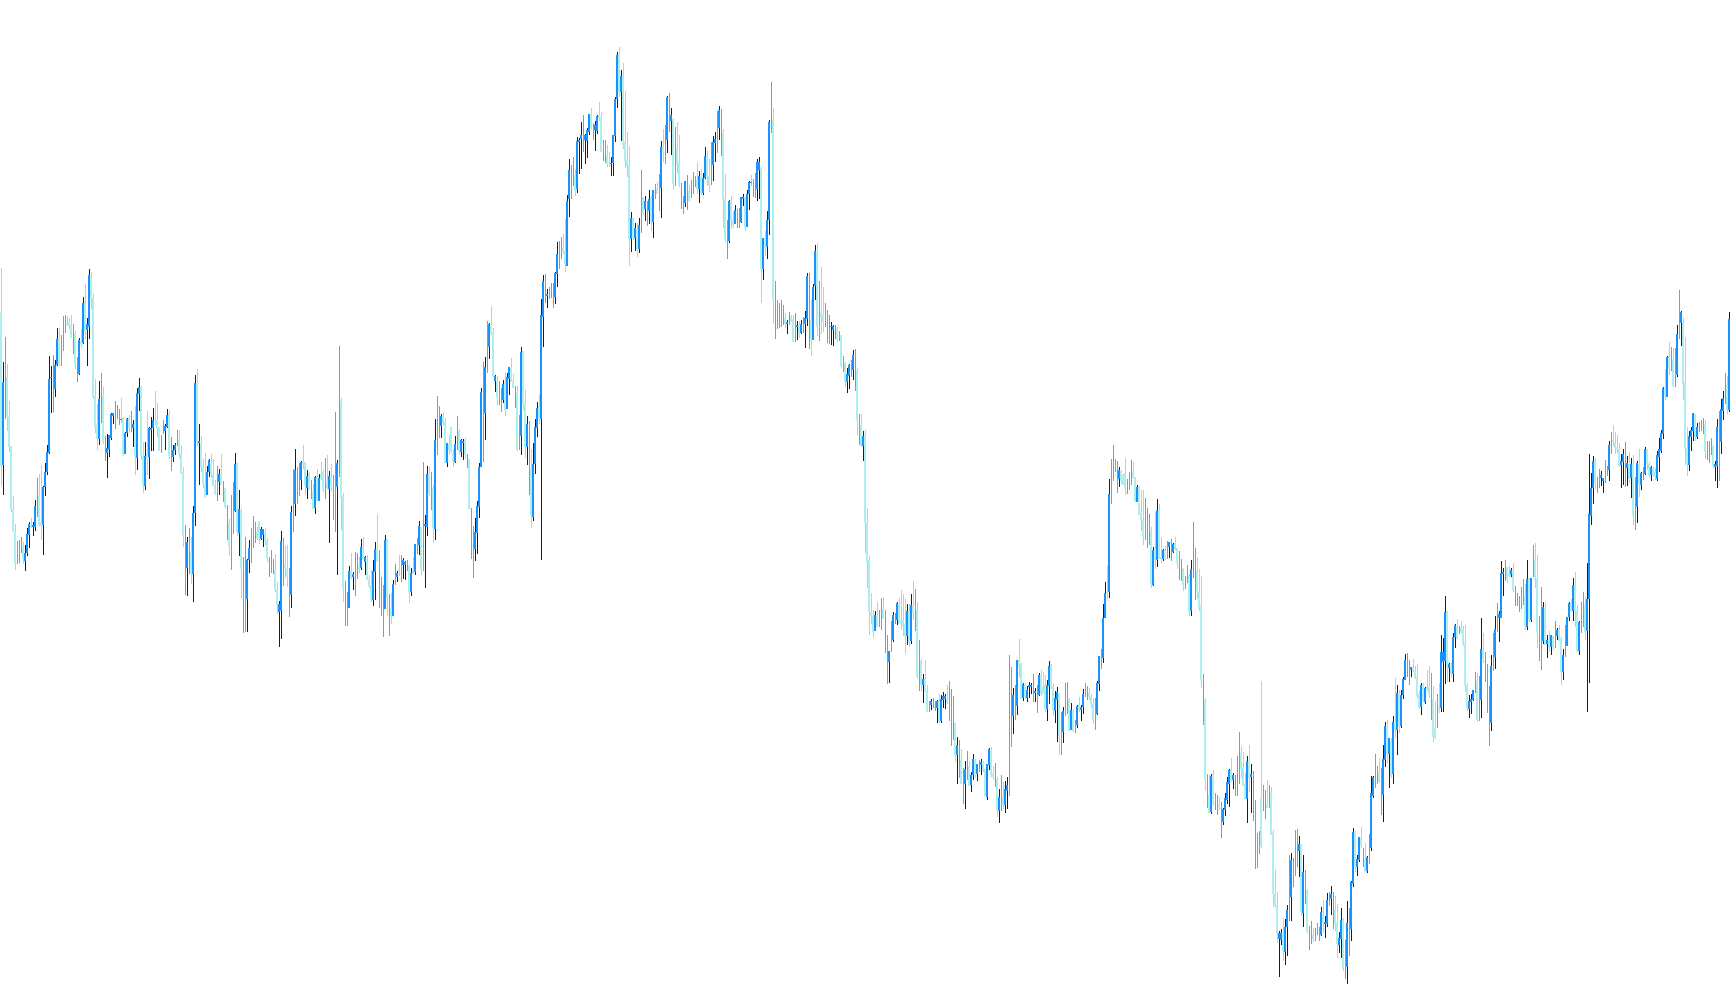
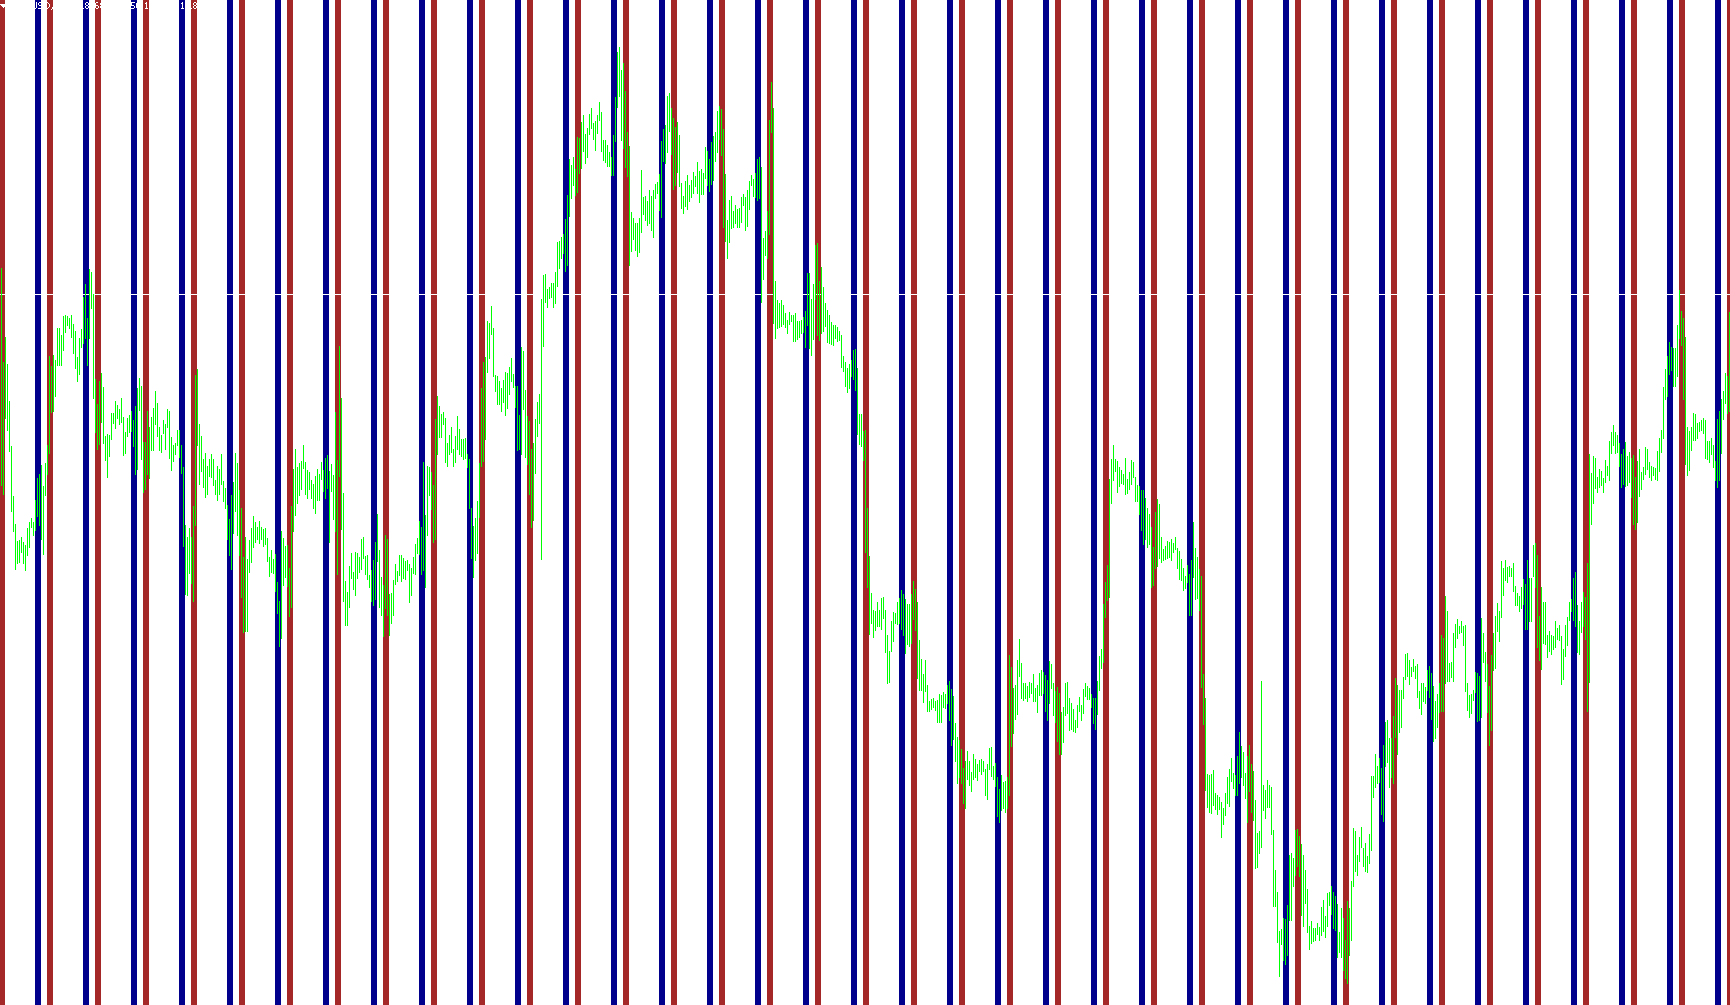
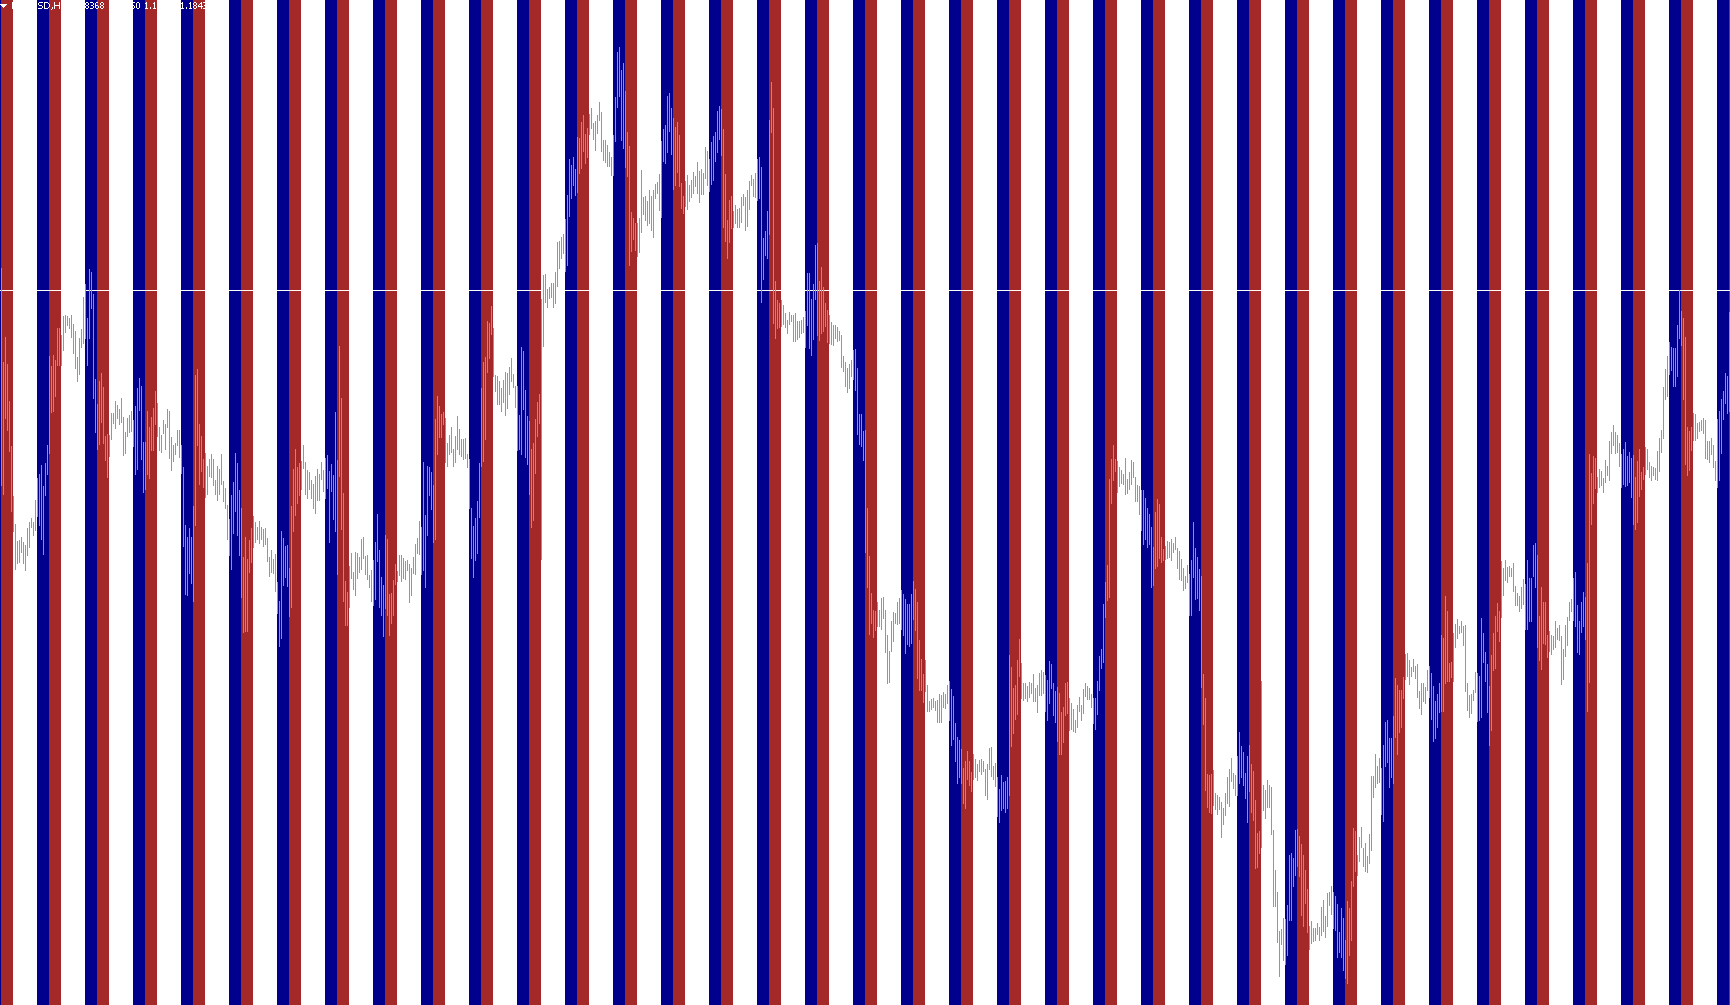
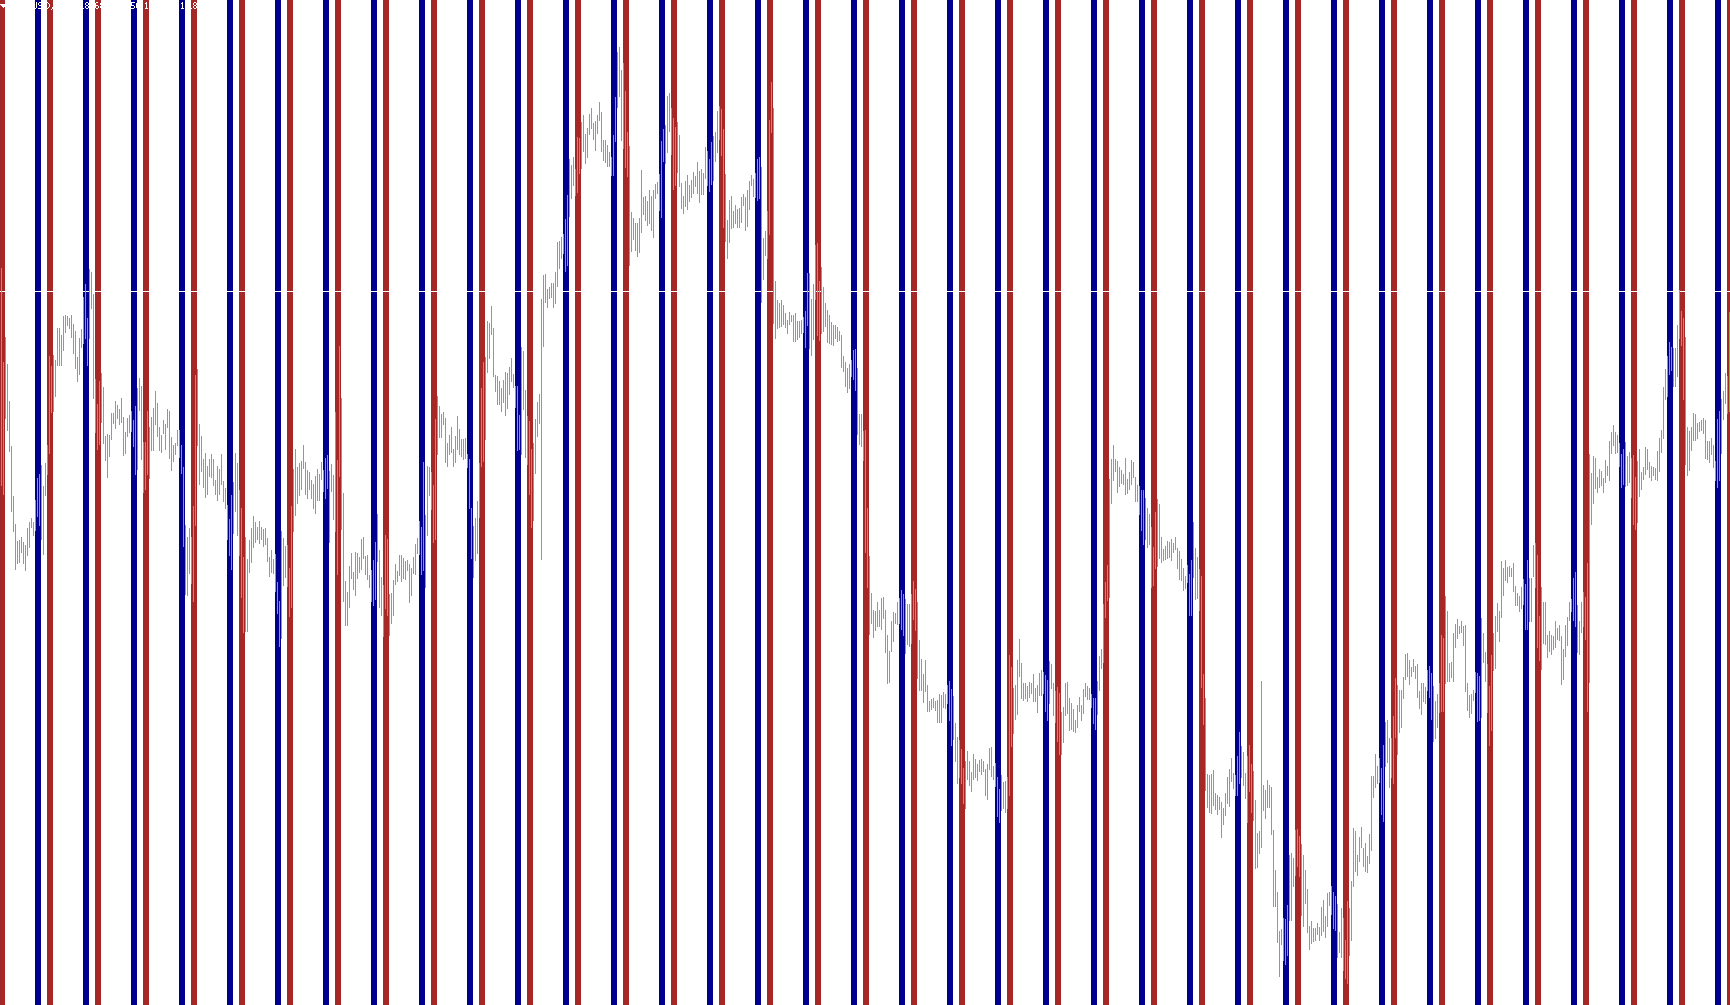
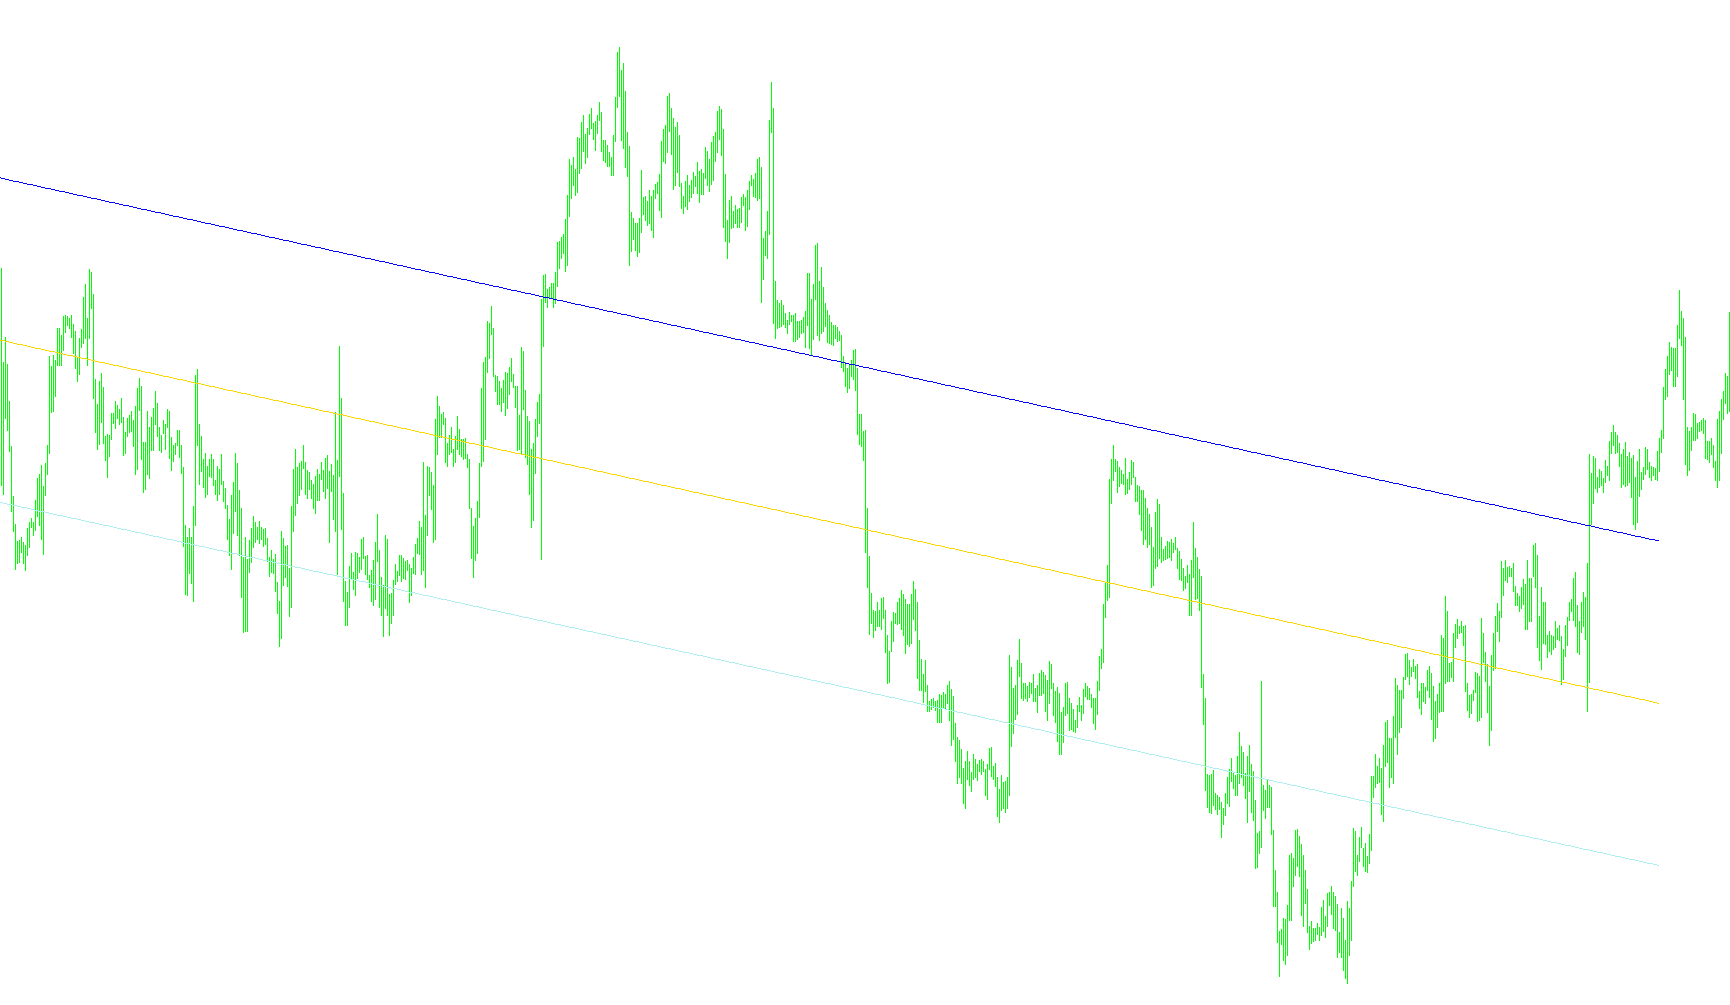
This indicator identifies specific entry and exit signals based on the relationship between daily opening and closing prices exclusively during Friday sessions.

i-Friday_Sig_v3
Indicator

i-Friday_Sig_v3

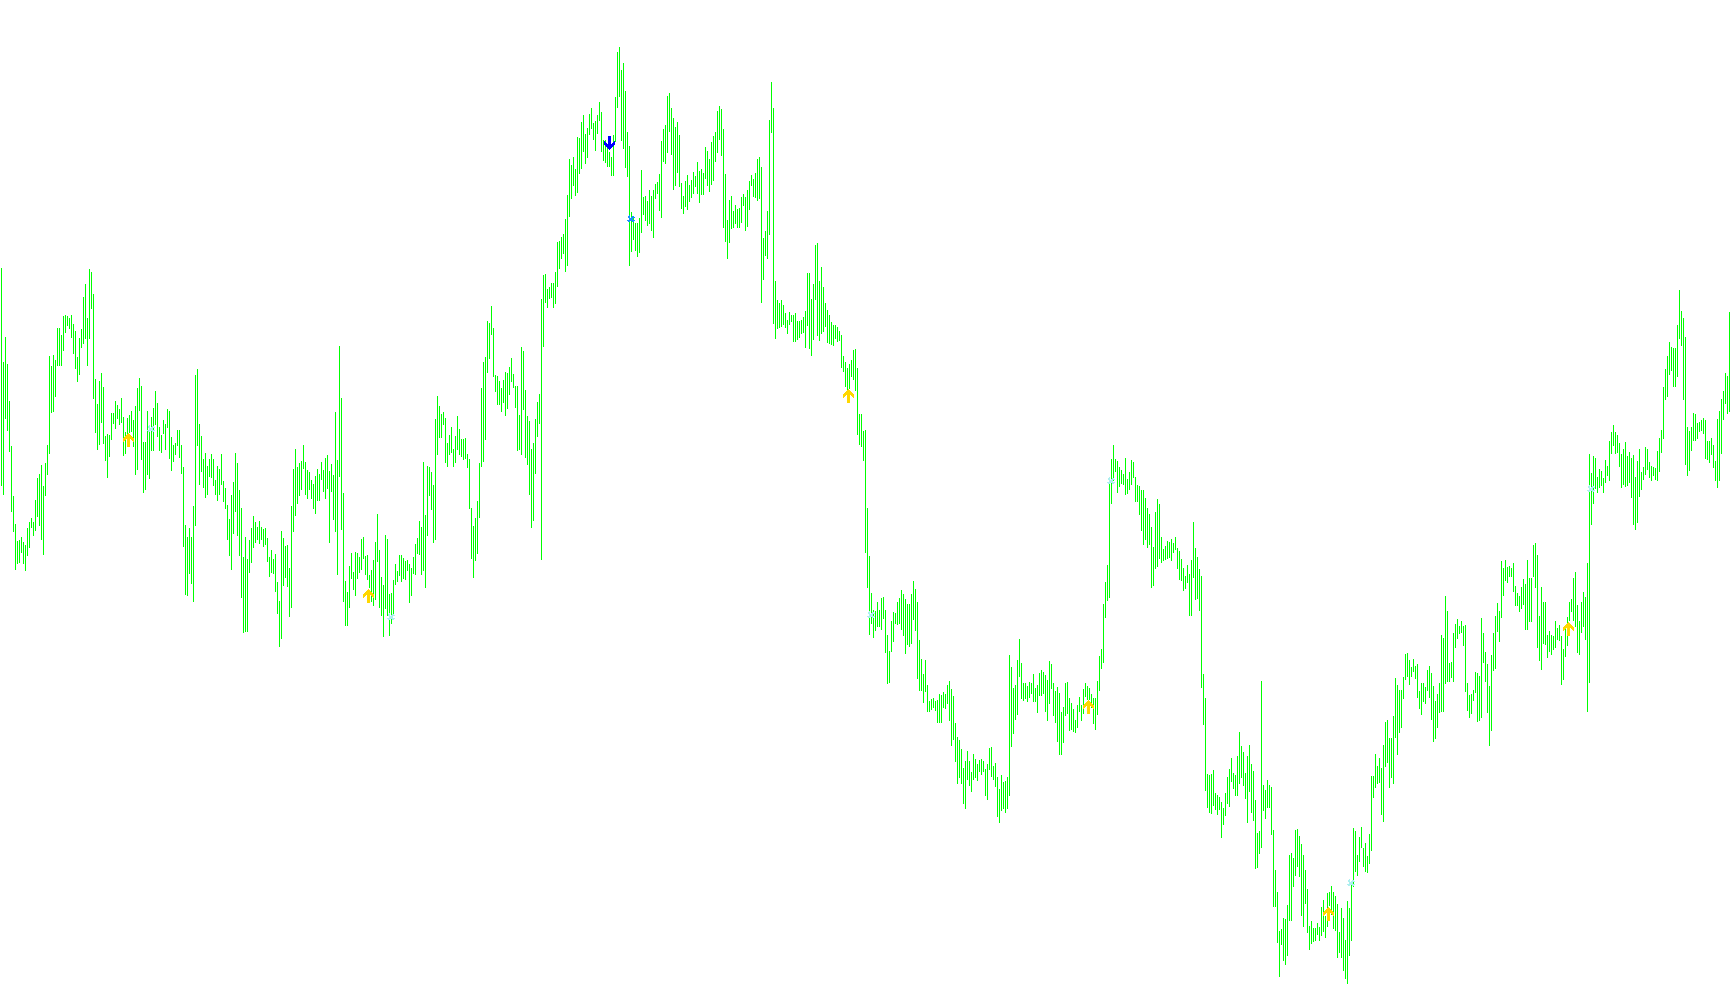
This indicator identifies specific Friday trading opportunities by detecting price action relative to the previous day's close during pre-defined opening and closing hours.

i-GAP
Indicator

i-GAP

This indicator identifies directional signals by detecting price discrepancies where the previous close deviates significantly from the current bar's opening price.

i-GentorCCIM_v.1.1
Indicator

i-GentorCCIM_v.1.1

iCCI

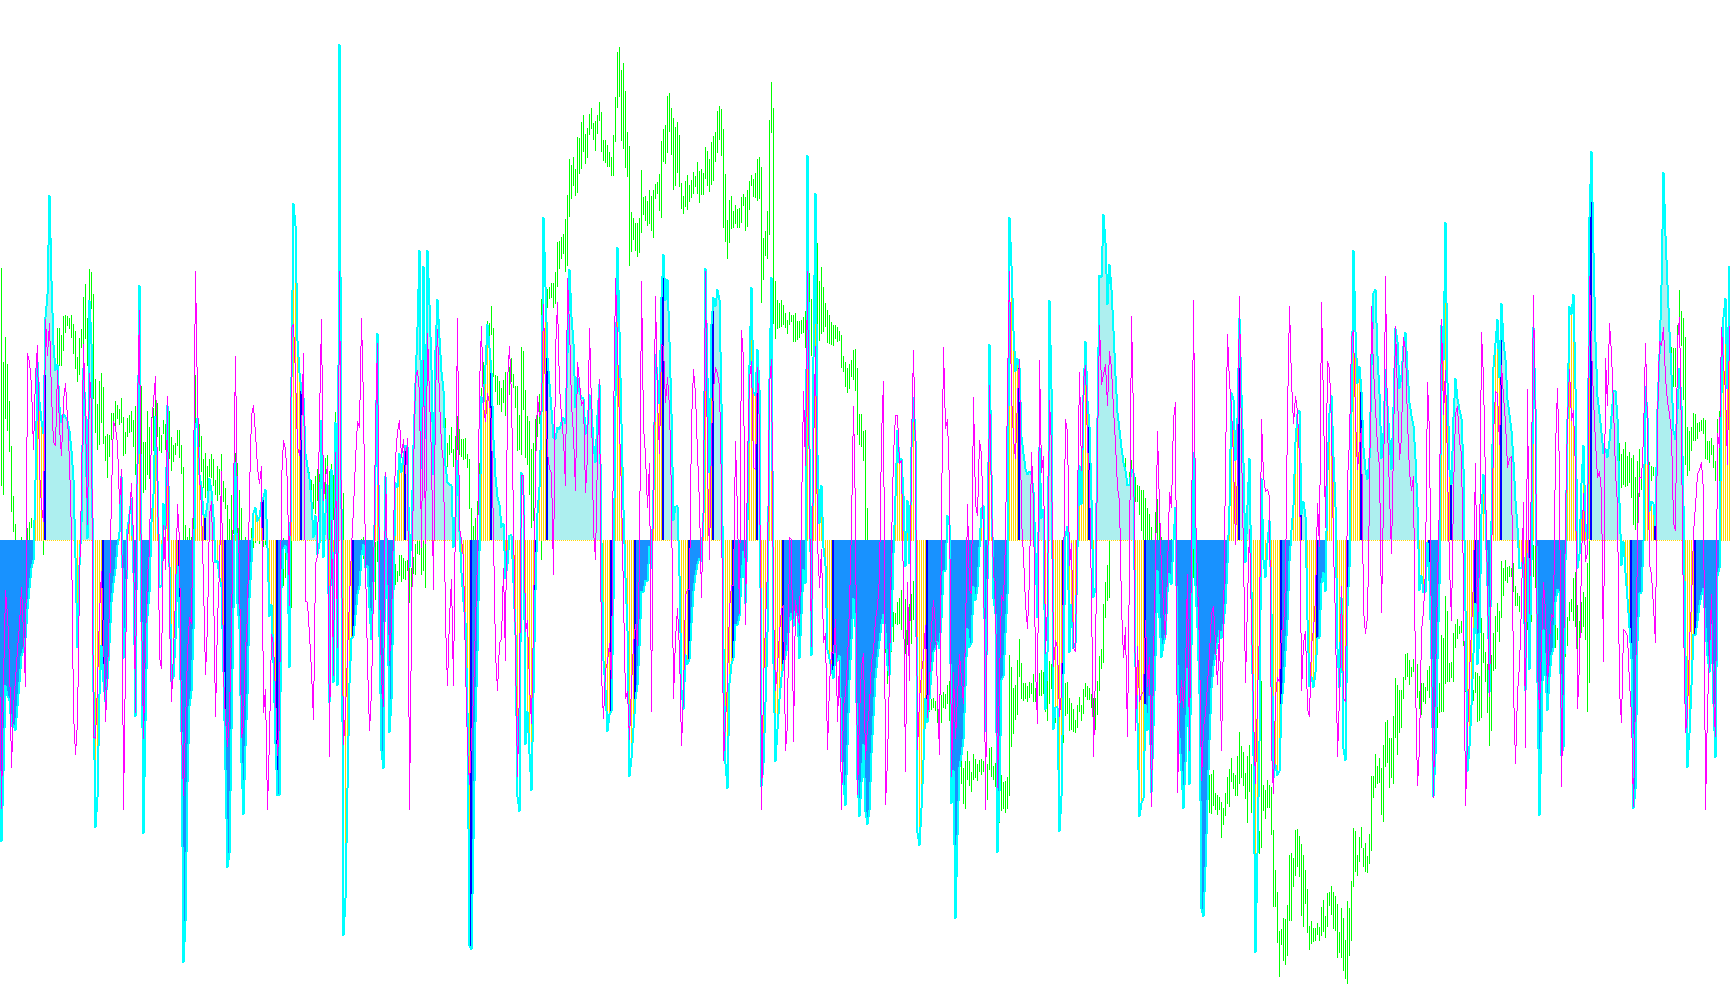
This indicator identifies momentum shifts by synchronizing dual CCI periods with LSMA and EMA filters to visualize trend strength and signal bar deviations.

i-GentorCCIM_v[1].0.2
Indicator

i-GentorCCIM_v[1].0.2

iCCI

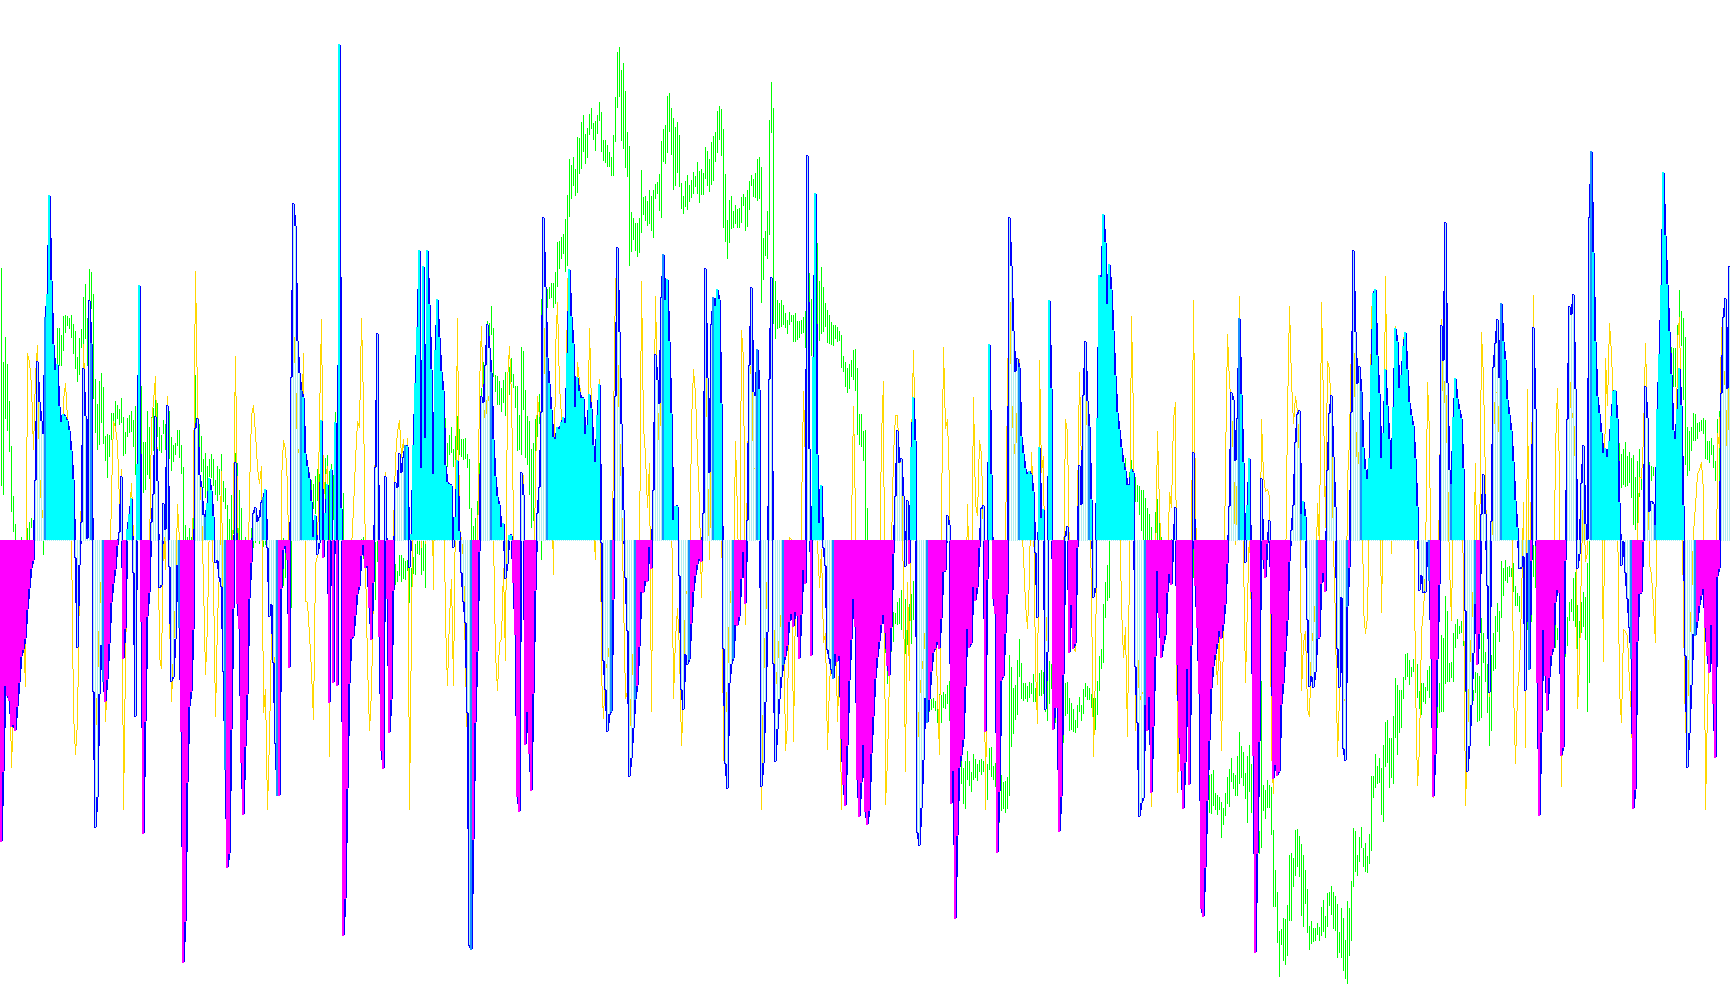
This indicator identifies momentum shifts and directional trends by calculating the crossing points between fast and slow Commodity Channel Indices (CCI) to generate visual signal bars.

i-GentorCCIM_v[1].0.2_v1
Indicator

i-GentorCCIM_v[1].0.2_v1

iCCI

This indicator utilizes multi-period Commodity Channel Index (CCI) values to identify trend reversals and generate visual signals based on zero-line crossovers and momentum shifts.

i-GentorCCIM_v[1].0.2_v2
Indicator

i-GentorCCIM_v[1].0.2_v2

iCCI

This indicator identifies market trends and entry points by analyzing the crossover dynamics of fast and slow Commodity Channel Index (CCI) periods alongside a sequence-based signal bar mechanism.

i-GentorCCIM_v[1].0.5
Indicator

i-GentorCCIM_v[1].0.5

iCCI

This indicator identifies market direction by correlating dual CCI oscillators with a sequential counter to filter out noise and highlight sustained trend strength.

i-GentorCCIM_v[1].1.0
Indicator

i-GentorCCIM_v[1].1.0

iCCI

This indicator identifies structural market shifts by evaluating the zero-line crossovers of fast and slow CCI oscillators combined with a sequence-based signal bar filter to determine trend persistence.

i-GentorCCIM_v[1].1.0_v1
Indicator

i-GentorCCIM_v[1].1.0_v1

iCCI

This indicator utilizes dual-period Commodity Channel Index (CCI) calculations to identify trend shifts and momentum strength through a multi-bar sequence validation logic.

i-GentorLSMA&EMA_v.1.1
Indicator

i-GentorLSMA&EMA_v.1.1

iMA

This indicator calculates the dynamic spatial gap between price action and both Linear Weighted Moving Averages (LSMA) and Exponential Moving Averages (EMA) to identify momentum exhaustion and trend deviations.

i-GentorLSMA&EMA_v1.0
Indicator

i-GentorLSMA&EMA_v1.0

iMA

This indicator visualizes price divergence by mapping the relative position of the current close against synchronized Exponential and Linear Weighted Moving Average thresholds.

i-GentorLSMA&EMA_v1[1].0
Indicator

i-GentorLSMA&EMA_v1[1].0

iMA

The algorithm monitors price deviations relative to smoothed moving averages and linear weighted distributions to visualize bullish or bearish momentum shifts.

i-GentorLSMA&EMA_v[1].0.2
Indicator

i-GentorLSMA&EMA_v[1].0.2

iMA

The logic identifies trend boundaries by filtering price action against a Typical Price EMA while simultaneously detecting momentum shifts via a weighted linear smoothing calculation.

i-GentorLSMA&EMA_v[1].0.2_v1
Indicator

i-GentorLSMA&EMA_v[1].0.2_v1

iMA

This indicator synchronizes Exponential Moving Averages with Linear Stochastic Moving Averages to filter trend reversals and identify price momentum breaches.

i-GentorLSMA&EMA_v[1].0.2_v2
Indicator

i-GentorLSMA&EMA_v[1].0.2_v2

iMA

The algorithm identifies bullish and bearish price action by detecting breaches of the Exponential Moving Average and weighted Least Squares Moving Average boundaries.

i-GentorLSMA&EMA_v[1].1.0
Indicator

i-GentorLSMA&EMA_v[1].1.0

iMA

This indicator identifies trend reversals by monitoring the divergence between price action and dynamic smoothed moving averages (EMA and LSMA) relative to a defined zero-axis threshold.

i-GentorLSMA&EMA_v[1]
Indicator

i-GentorLSMA&EMA_v[1]

iMA

This indicator maps price action relative to smoothed moving averages by plotting specific breach points where the market deviates from EMA and Linear Regression levels.

i-GentorLSMA&EMA_v[1]2.1.0
Indicator

i-GentorLSMA&EMA_v[1]2.1.0

iMA

The indicator identifies bullish and bearish momentum by plotting relative price position against Exponential Moving Averages and Linear Weighted Averages, highlighting breaches of a specified zero-level threshold.

i-GentorLSMA&EMA_v[1]_v1
Indicator

i-GentorLSMA&EMA_v[1]_v1

iMA

Identifies trend momentum by filtering price action based on its relative position to dual linear weighted moving averages and exponential smoothing boundaries.

i-HighLow
Indicator

i-HighLow

The indicator identifies local price extremes over a rolling lookback period and projects offset thresholds to map volatility corridors.

i-IntradayFibonacci
Indicator

i-IntradayFibonacci

This indicator dynamically projects specific retracement levels based on the high and low extremes of the previous daily candle onto the current intraday chart.

i-IntradayFibonacci_v1
Indicator

i-IntradayFibonacci_v1

This indicator projects specific Fibonacci retracement levels based on the high and low extremes of the previous daily candle onto the current intraday timeframe.
i-IntradayFibonacci_v2
Indicator

i-IntradayFibonacci_v2

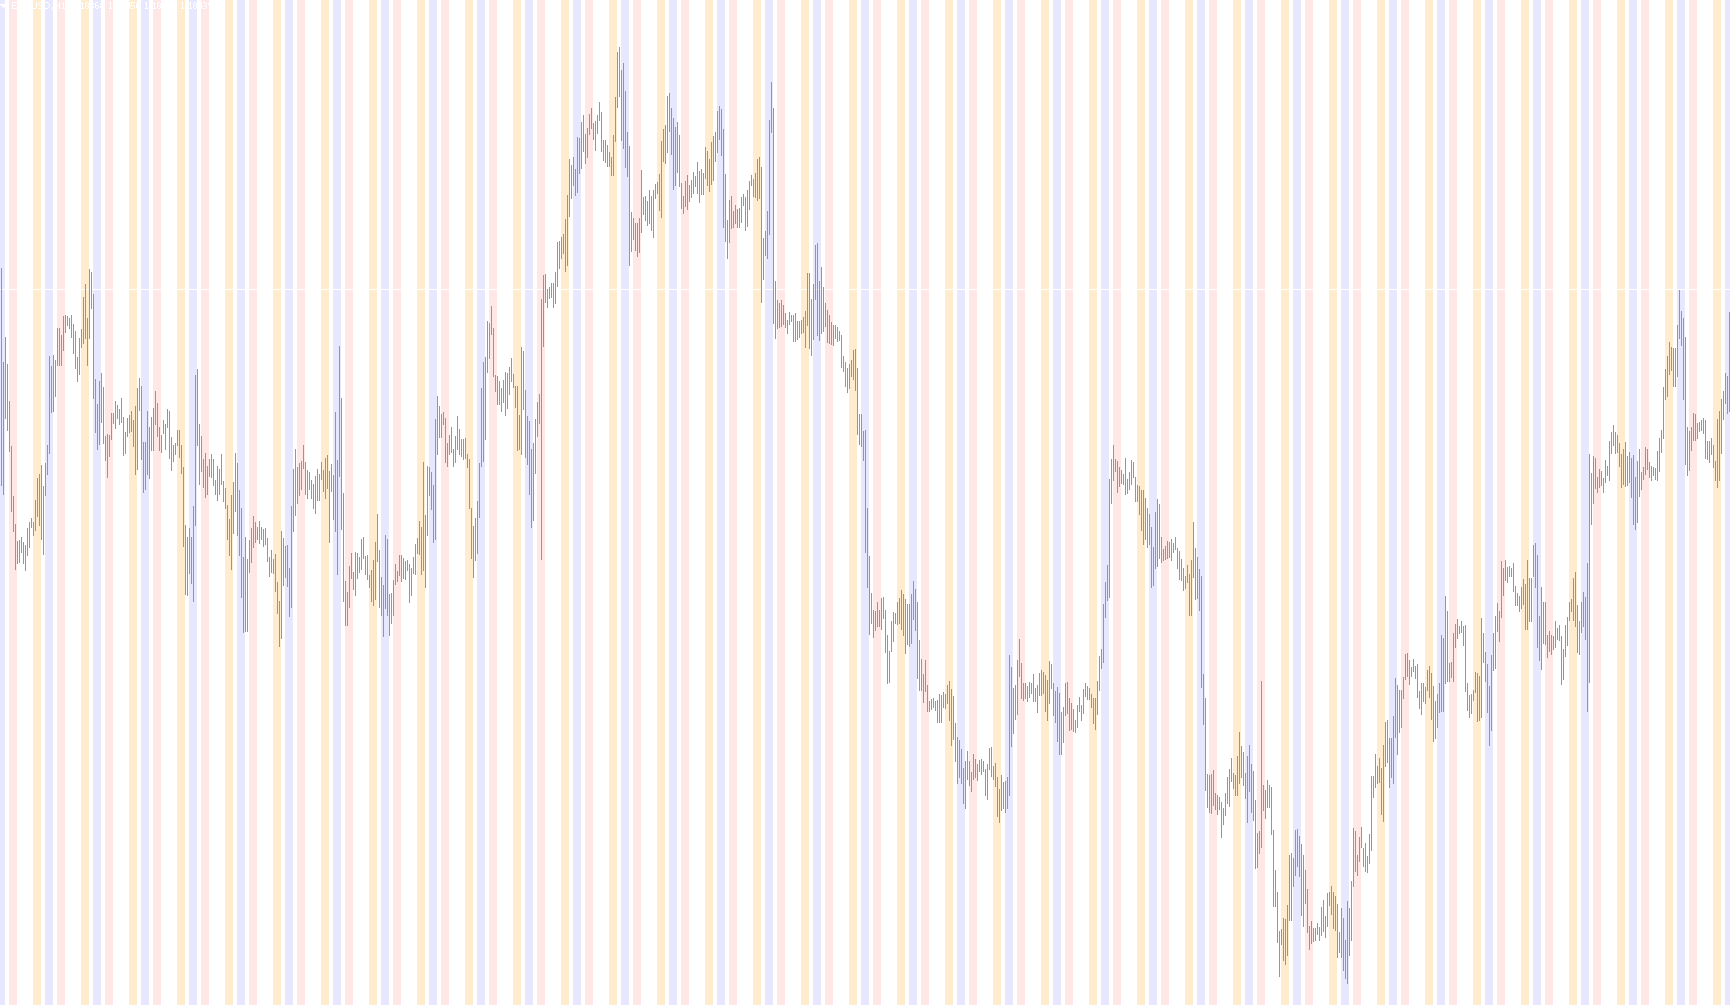
This indicator dynamically maps specific Fibonacci retracement levels based on the high and low extremes of the preceding daily candle across intraday timeframes.

i-Levels_RS
Indicator

i-Levels_RS

This indicator parses external CSV data to plot time-specific historical support and resistance levels onto the chart with variable line thicknesses based on assigned strength parameters.

i-LRL-2Color
Indicator

i-LRL-2Color

This indicator synthesizes a dual-colored T3 smoothing algorithm with linear regression coefficients to identify directional trend shifts and price momentum.

i-MaZZSig-T01
Indicator

i-MaZZSig-T01

iMA

This indicator identifies trend reversals by detecting specific intersections between ZigZag pivot points and dual Exponential Moving Average crossovers.

i-Monday_Sig
Indicator

i-Monday_Sig

Identifies directional bias by comparing the previous day's closing price against the current daily open price specifically during the Monday market launch.

i-Monday_Sig_v1
Indicator

i-Monday_Sig_v1

The logic identifies potential reversals by comparing the previous day's opening price against the current bar's closing price specifically during a defined Monday morning hour.

i-MorningRange
Indicator

i-MorningRange

This indicator identifies and projects the high and low price boundaries established during a specific opening morning session over a customizable historical period.

i-MorningRange_v1
Indicator

i-MorningRange_v1

This indicator dynamically projects horizontal price boundaries by identifying the session highs and lows between midnight and a user-defined time across multiple historical trading days.

i-OneThird
Indicator

i-OneThird

This indicator identifies price action dominance by highlighting candles where the closing price penetrates the final third of the total intraday range.

i-OneThird_v1
Indicator

i-OneThird_v1

The indicator identifies price action strength by mapping the range boundaries based on whether the closing price resides within the upper or lower one-third of the candle's total volatility.

i-ParamonWorkHighLow
Indicator

i-ParamonWorkHighLow

This indicator visualizes historical price action boundaries by drawing rectangular zones over specific user-defined time intervals across a multi-day lookback period.

i-ParamonWorkTime
Indicator

i-ParamonWorkTime

This indicator maps historical price action into distinct rectangular zones based on user-defined time intervals to identify specific volatility windows.

i-ParamonWorkTime1
Indicator

i-ParamonWorkTime1

This indicator visually demarcates specific trading windows on the chart by projecting rectangular zones based on user-defined timeframes and historical high-low price boundaries.

i-ParamonWorkTime1_v1
Indicator

i-ParamonWorkTime1_v1

This indicator identifies and visualizes specific intraday trading periods by rendering shaded geometric zones based on user-defined temporal constraints and price extremes.

i-ParamonWorkTime_v1
Indicator

i-ParamonWorkTime_v1

This indicator visualizes specific daily trading windows by overlaying shaded rectangular zones that highlight price boundaries and historical range dynamics.

i-ParamonWorkTime_v2
Indicator

i-ParamonWorkTime_v2

This indicator visually projects distinct time-based zones onto the chart to identify specific periods of liquidity and volatility across historical dates.

i-ParamonWorkTime_v3
Indicator

i-ParamonWorkTime_v3

This indicator projects historical multi-session price boundaries and volatility zones as distinct rectangular regions across a specified period of trading days.

i-ParamonWorkTime_v5
Indicator

i-ParamonWorkTime_v5

This indicator visually identifies and highlights specific trading windows by rendering rectangular zones based on user-defined start and end times.

i-PassLevCCI_v.1.3
Indicator

i-PassLevCCI_v.1.3

iCCI

Identifies reversal signals by detecting specific sequential trend shifts where the Commodity Channel Index penetrates extreme volatility boundaries.

i-Profit
Indicator

i-Profit

This indicator aggregates and visualizes historical trading returns across multiple timeframes, including daily, weekly, monthly, quarterly, and yearly periods, expressed as both absolute currency values and percentage gains.

i-Profit_001
Indicator

i-Profit_001

This indicator calculates and displays real-time profitability metrics across various timeframes, including daily, weekly, monthly, quarterly, and yearly spans relative to the account balance.

i-Profit_en
Indicator

i-Profit_en

An on-chart visual dashboard that aggregates and displays real-time trading profits, point gains, and percentage returns across various timeframes including daily, weekly, monthly, quarterly, and yearly scales.

i-Regr H&L v2
Indicator

i-Regr H&L v2

The indicator utilizes Gaussian elimination to solve a system of linear equations, constructing multi-degree polynomial regression lines and channels based on high and low price extremes.

i-Regr H&L
Indicator

i-Regr H&L

This indicator calculates dynamic support and resistance levels by applying a Gaussian elimination matrix to price data to derive a polynomial regression curve, then projecting standard deviation bounds.

i-Regr v2
Indicator

i-Regr v2

This indicator calculates a non-linear price trajectory using Gaussian elimination to solve for polynomial coefficients, establishing a dynamic channel based on the standard deviation of the residuals.

i-Regr[1]
Indicator

i-Regr[1]

This indicator utilizes a Gaussian elimination algorithm to solve for the coefficients of a polynomial regression curve, establishing dynamic upper and lower boundary channels based on standard deviation.

i-Regr_alert[1]
Indicator

i-Regr_alert[1]

This indicator calculates a non-linear trend line using Gaussian elimination to solve a polynomial regression matrix, establishing dynamic upper and lower boundaries based on standard deviation.