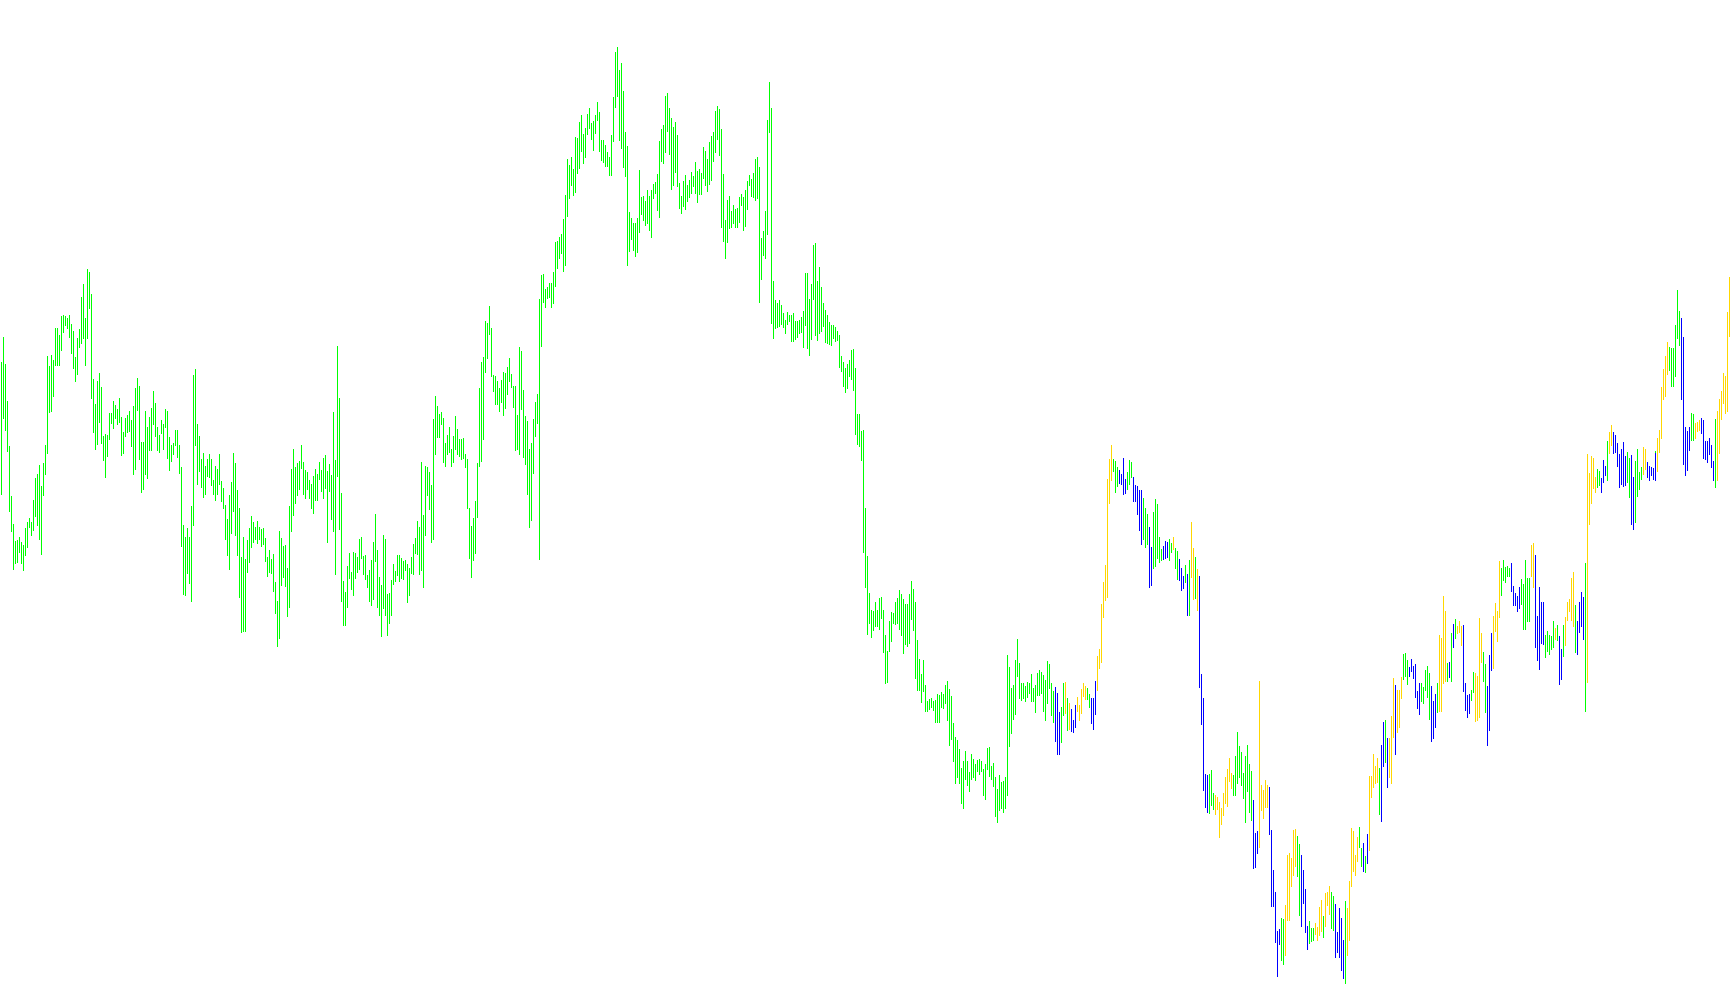
The Profitunity Bars tool is a visual market analysis indicator designed to help traders identify specific price action trends by filtering out market noise. Instead of showing every single price movement, this script analyzes the relationship between two technical oscillators—the Awesome Oscillator (AO) and the Accelerator Oscillator (AC)—to highlight bars that exhibit significant momentum shifts.
How it Works
The logic operates by scanning a predetermined number of recent price candles (defaulting to 300) and comparing the current values of the AO and AC against their previous values. It looks for "concurrence," meaning both oscillators must be moving in the same direction simultaneously to trigger a visual signal.
Visual Signals
The indicator identifies two distinct market conditions:
-
Bullish Momentum (Lime Color): When both the Awesome Oscillator and the Accelerator Oscillator are increasing in value compared to the previous candle, the script identifies a positive momentum shift. It marks these areas on your chart using a lime-colored histogram, signaling potential upward strength.
-
Bearish Momentum (Red Color): Conversely, when both oscillators are decreasing in value compared to the previous candle, it identifies a negative momentum shift. The script highlights these instances with a red histogram, signaling potential downward pressure.
Key Objectives for the Trader
By using this logic, the tool acts as a secondary confirmation layer. Rather than relying on price alone, it helps you visualize where "momentum" is actually accelerating. When you see these colored bars appearing in clusters, it suggests that the market is not just moving, but is being pushed by a consistent trend confirmed by multiple technical metrics. This allows for a cleaner view of the charts, focusing your attention on periods of high-conviction movement.
//+------------------------------------------------------------------+
//|                                       ind - Profitunity Bars.mq4 |
//|                                 Copyright © 2006, Andrew Suvorov |
//|                                                    trade@sibp.ru |
//+------------------------------------------------------------------+
#property copyright "Copyright © 2006, Andrew Suvorov"
#property link      "trade@sibp.ru"

#property indicator_chart_window
#property indicator_buffers 2
#property indicator_color1 Lime
#property indicator_color2 Red
#property indicator_width1 2
#property indicator_width2 2

double buf1[];
double buf2[];

extern int       nAccountedBars=300;
//+------------------------------------------------------------------+
//| Custom indicator initialization function                         |
//+------------------------------------------------------------------+
int init()
  {
//---- indicators
   SetIndexStyle(0,DRAW_HISTOGRAM);
   SetIndexBuffer(0,buf1);
   SetIndexDrawBegin(0,0);

   SetIndexStyle(1,DRAW_HISTOGRAM);
   SetIndexBuffer(1,buf2);
   SetIndexDrawBegin(1,0);
//----
   return(0);
  }
//+------------------------------------------------------------------+
//| Custom indicator deinitialization function                       |
//+------------------------------------------------------------------+
int deinit()
  {
//----

//----
   return(0);
  }
//+------------------------------------------------------------------+
//| Custom indicator iteration function                              |
//+------------------------------------------------------------------+
int start()
  {
//----
   for(int CurrentBar=0;CurrentBar<=nAccountedBars;CurrentBar++)
   {

      if(iAO(Symbol(),0,CurrentBar) > iAO(Symbol(),0,CurrentBar+1) &&
         iAC(Symbol(),0,CurrentBar) > iAC(Symbol(),0,CurrentBar+1))

      {
         buf1[CurrentBar]=High[CurrentBar];
         buf2[CurrentBar]=Low[CurrentBar];
      }

      if(iAO(Symbol(),0,CurrentBar) < iAO(Symbol(),0,CurrentBar+1) &&
         iAC(Symbol(),0,CurrentBar) < iAC(Symbol(),0,CurrentBar+1))
      {
         buf1[CurrentBar]=Low[CurrentBar];
         buf2[CurrentBar]=High[CurrentBar];
      }

}
//----
   return(0);
  }
//+------------------------------------------------------------------+
Comments