IND Inverse+EMA
Download script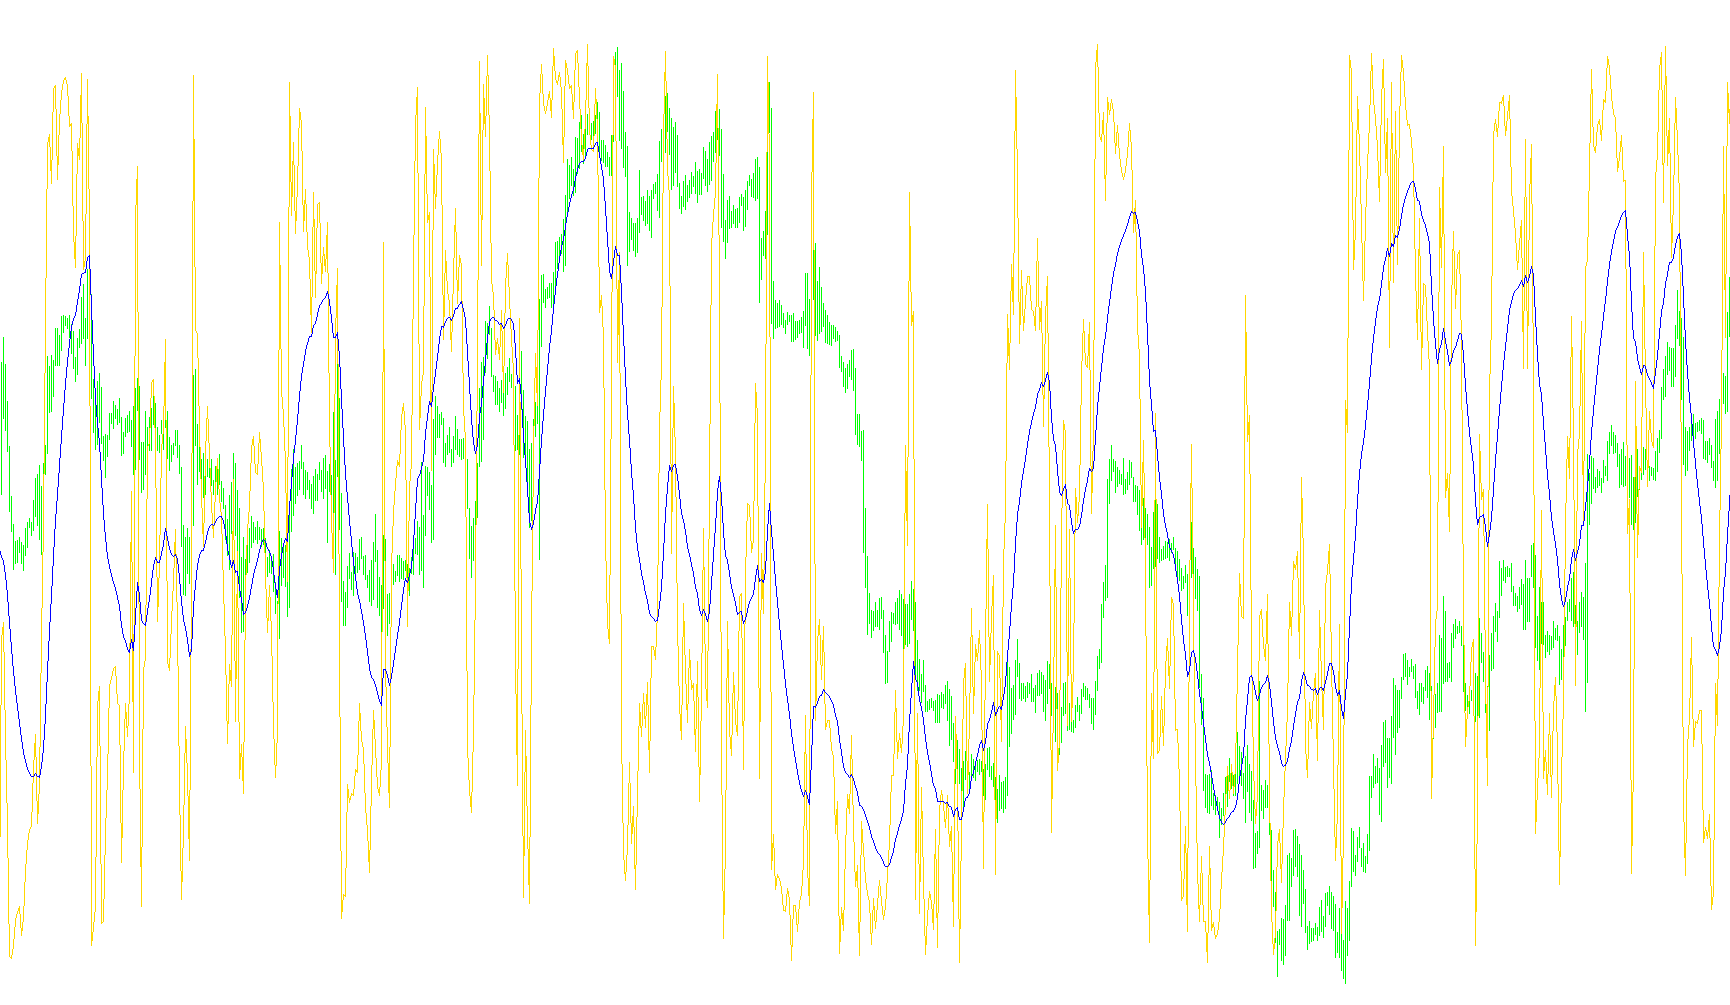
This tool is designed to provide traders with a visual representation of market momentum and price positioning relative to recent volatility. Rather than just showing the raw price of an asset, it calculates a specialized "inverse" value that helps identify where the current price sits within a specific historical range.
How the Logic Works
The script functions by analyzing three primary components of the market data:
1. Identifying the Dynamic Range The tool looks back at a specific window of recent history (determined by your settings) to find the highest peak and the lowest valley. By identifying these two points, it establishes the "amplitude," or the total height of the price movement during that period.
2. Calculating Price Position Once the high and low points are identified, the script determines where the current closing price sits within that range. It calculates a value based on the distance between the current price and the midpoint of that high-low range. This effectively translates complex price action into a normalized score. This score tells you how "stretched" the price is in one direction versus the other.
3. Smoothing the Data Because market prices can be jagged and noisy, the script applies a mathematical smoothing technique (an Exponential Moving Average). This takes the raw position scores calculated above and flows them into a smoother trend line. The goal of this smoothing is to filter out minor fluctuations and highlight the broader direction of the price movement.
What it means for the user
Instead of looking at a volatile chart where prices jump up and down, this indicator provides a secondary window that shows the "flow" of the market. By observing the relationship between the calculated value and its smoothed average, traders can better visualize whether the price is maintaining a specific momentum or if it is beginning to lose steam relative to its recent historical boundaries.
//+------------------------------------------------------------------+
//| IND Inverse.mq4 |
//+------------------------------------------------------------------+
#property copyright "Copyright 2006, ..."
#property link "http://www.forex-tsd.com/"
#property indicator_separate_window
#property indicator_buffers 2
#property indicator_color1 Silver
#property indicator_color2 Red
//---- input parameters
//---- buffers
double Buffer[];
double EMA[];
extern int iPeriod = 1;
extern int EMAPeriod=25;
//----
//+------------------------------------------------------------------+
//| Init |
//+------------------------------------------------------------------+
int init()
{
//---- indicators
string short_name;
short_name="IND Inverse + EMA("+iPeriod+","+EMAPeriod+")";
IndicatorShortName(short_name);
IndicatorDigits(Digits+2);
SetIndexStyle(0,DRAW_LINE);
SetIndexBuffer(0,Buffer);
SetIndexStyle(1,DRAW_LINE);
SetIndexBuffer(1,EMA);
//----
return(0);
}
//+------------------------------------------------------------------+
//| Parabolic Sell And Reverse system |
//+------------------------------------------------------------------+
int start()
{
int limit;
int counted_bars=IndicatorCounted();
//---- check for possible errors
if(counted_bars<0)
{
return(-1);
}
//---- last counted bar will be recounted
if(counted_bars>0) counted_bars--;
limit=Bars-counted_bars;
//---- do it
for(int i=limit-1; i>=0; i--)
{
// Easy to read
double HD = High[Highest(NULL,0,MODE_HIGH,(iPeriod* 20),i)];
double LD = Low[Lowest(NULL,0,MODE_LOW,(iPeriod* 20),i)];
double amplitude = HD - LD;
Buffer[i]= ((Close[i]-(HD-(amplitude/2)))/amplitude) * iPeriod;
EMA[i]=EMA[i+1]+2.0/(1.0+EMAPeriod)*(Buffer[i]-EMA[i+1]);
}
//----
return(0);
}
//+------------------------------------------------------------------+
Comments