iHighLow
Download script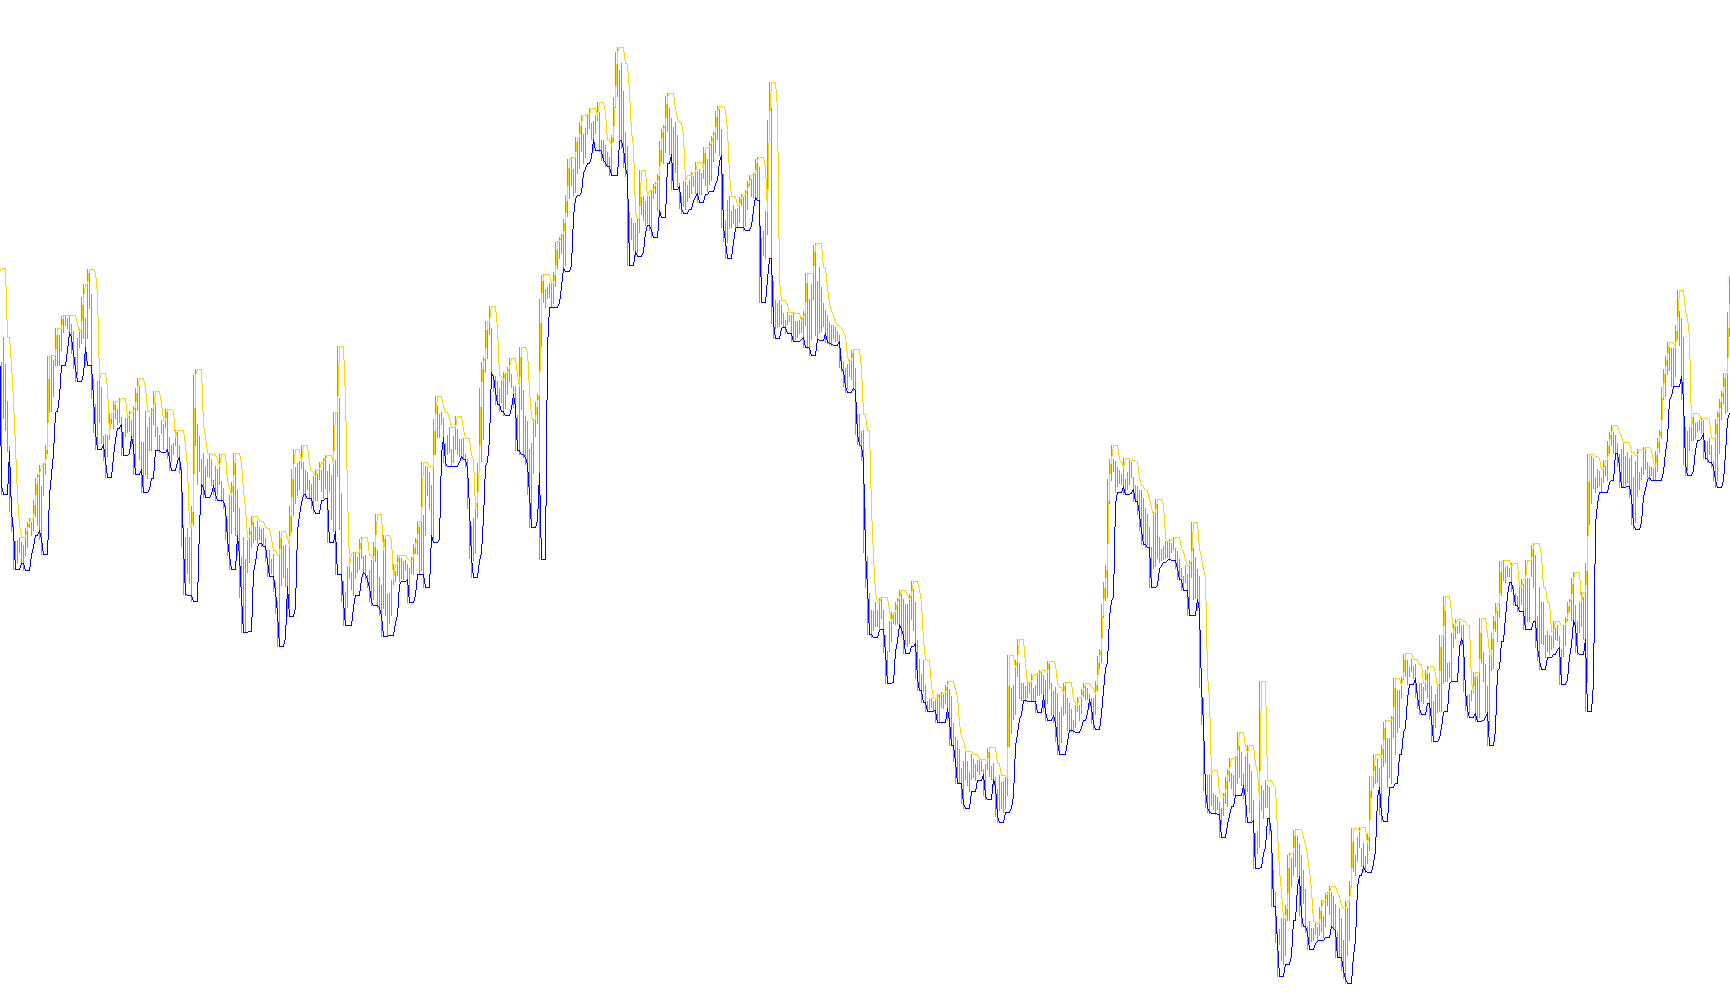
This script is designed as a visual trading tool that identifies and highlights specific price extremes on your chart. Instead of showing complex moving averages or trend lines, it focuses on locating the "peaks" and "valleys" of recent price action to help traders understand the current range of the market.
Core Functionality
The primary goal of this tool is to scan a specific window of time (the number of previous bars) to find the highest and lowest price points reached. It then plots these values as lines on your chart, providing a clear visual reference for significant support and resistance levels.
How it Works
To determine where to place these visual markers, the logic follows these steps:
- Scanning the History: The script looks back at a user-defined number of candles (bars). For example, if configured to look back 3 bars, it examines only the most recent price movements.
- Identifying Extremes: Within that specific window, the tool automatically searches for the single highest price point and the single lowest price point reached during that timeframe.
- Plotting the Results: Once it identifies these two key points, it records their values and draws them on your chart. This allows you to see exactly where the "top" and "bottom" occurred recently.
Key Features for the Trader
- Visual Clarity: By highlighting these highs and lows as lines, the tool helps simplify the "noise" of a busy chart, allowing you to see price boundaries more clearly.
- Dynamic Updates: The script processes this information automatically as new candles form, ensuring that the high and low markers reflect the most recent market activity.
- Customizable Sensitivity: Through the settings, you can adjust how many bars back the script should look. A smaller number makes the tool very sensitive to immediate price flickers, while a larger number captures broader price trends.
In summary, this script acts as an automated "scout" that constantly monitors recent price history to highlight the most significant peaks and valleys, helping you visualize the boundaries of the current market move.
#property  copyright "Copyright © 2007, TradersForecast"
#property  link      "http://www.TradersForecast.net/"
//---- indicator settings
//#property  indicator_separate_window
#property indicator_chart_window
#property  indicator_buffers 2
#property  indicator_color1  Red //Silver
#property  indicator_color2  Red //Lime      //Green
#property  indicator_width1  1
#property  indicator_width2  1
//---- indicator parameters
extern int hist4O=3;
extern int hist4C=3;
extern int maxSL=9;
//---- indicator buffers
double     highBuf[];
double     lowBuf[];
double high = 0;
double low = 0;

int init()
  {
//---- drawing settings
   SetIndexStyle(0,DRAW_LINE);
   SetIndexStyle(1,DRAW_LINE);
   //SetIndexDrawBegin(1,SignalSMA);
   //IndicatorDigits(Digits+1);
//---- indicator buffers mapping
   SetIndexBuffer(0,highBuf);
   SetIndexBuffer(1,lowBuf);
//---- name for DataWindow and indicator subwindow label
   //IndicatorShortName("MACD("+FastEMA+","+SlowEMA+","+SignalSMA+")");      //, "fExpert(5) = ", fExpert(5)
   IndicatorShortName("(highBuf = "+highBuf[0]+"; lowBuf = "+lowBuf[0]+";)");      //, "fExpert(5) = ", fExpert(5)
   SetIndexLabel(0,"Highs");
   SetIndexLabel(1,"Lows");
//---- initialization done
   return(0);
  }
//+------------------------------------------------------------------+
//|                                                                  |
//+------------------------------------------------------------------+

int start()
  {
   int limit;
   int counted_bars=IndicatorCounted();
//---- last counted bar will be recounted
   if(counted_bars>0) counted_bars--;
   limit = Bars-counted_bars;
//---- macd counted in the 1-st buffer
   for(int i=0 ; i<limit; i++){
      //dirBuffer[i] =
      fExpert(i+1);
      highBuf[i] = high;
      lowBuf[i] = low;
   }
//---- done
   return(0);
  }
//+------------------------------------------------------------------+

int fExpert(int v) {
   //if (v == 0)    return(0);
   int highPos = iHighest(NULL, 0, MODE_HIGH, hist4O, v);
   int lowPos = iLowest(NULL, 0, MODE_LOW, hist4O, v);
   high = High[highPos];
   low = Low[lowPos];
   return(0);
}
 // the end.
//+------------------------------------------------------------------+
Comments