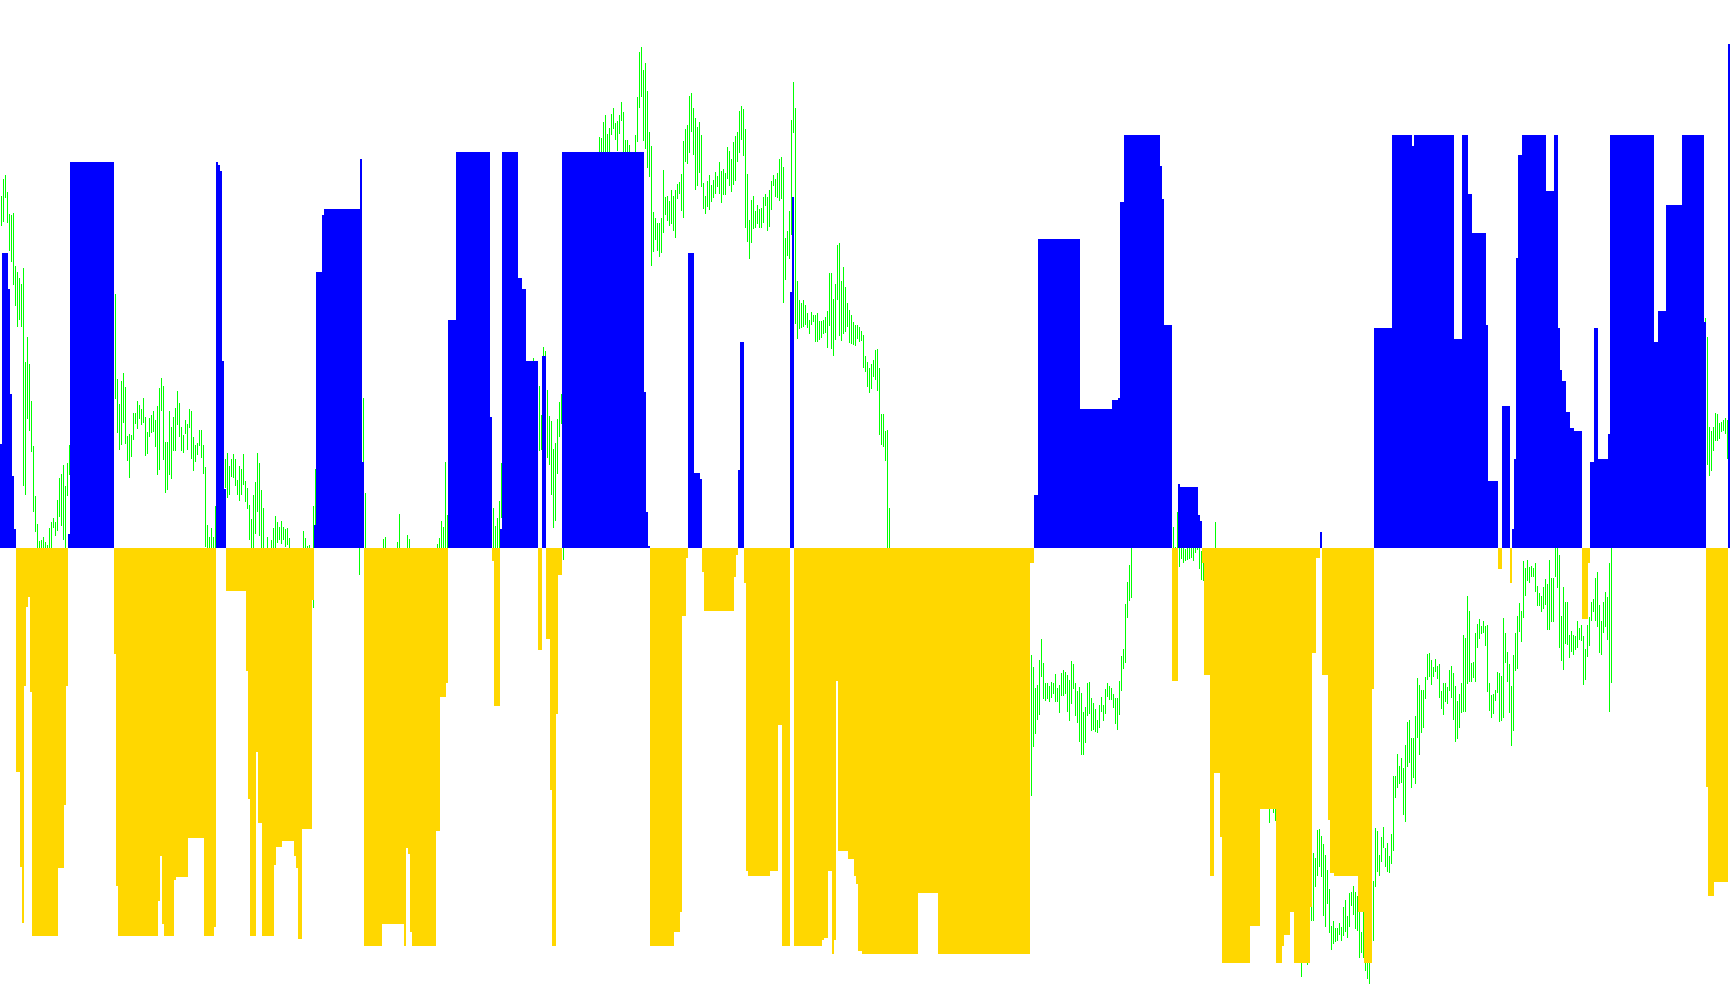
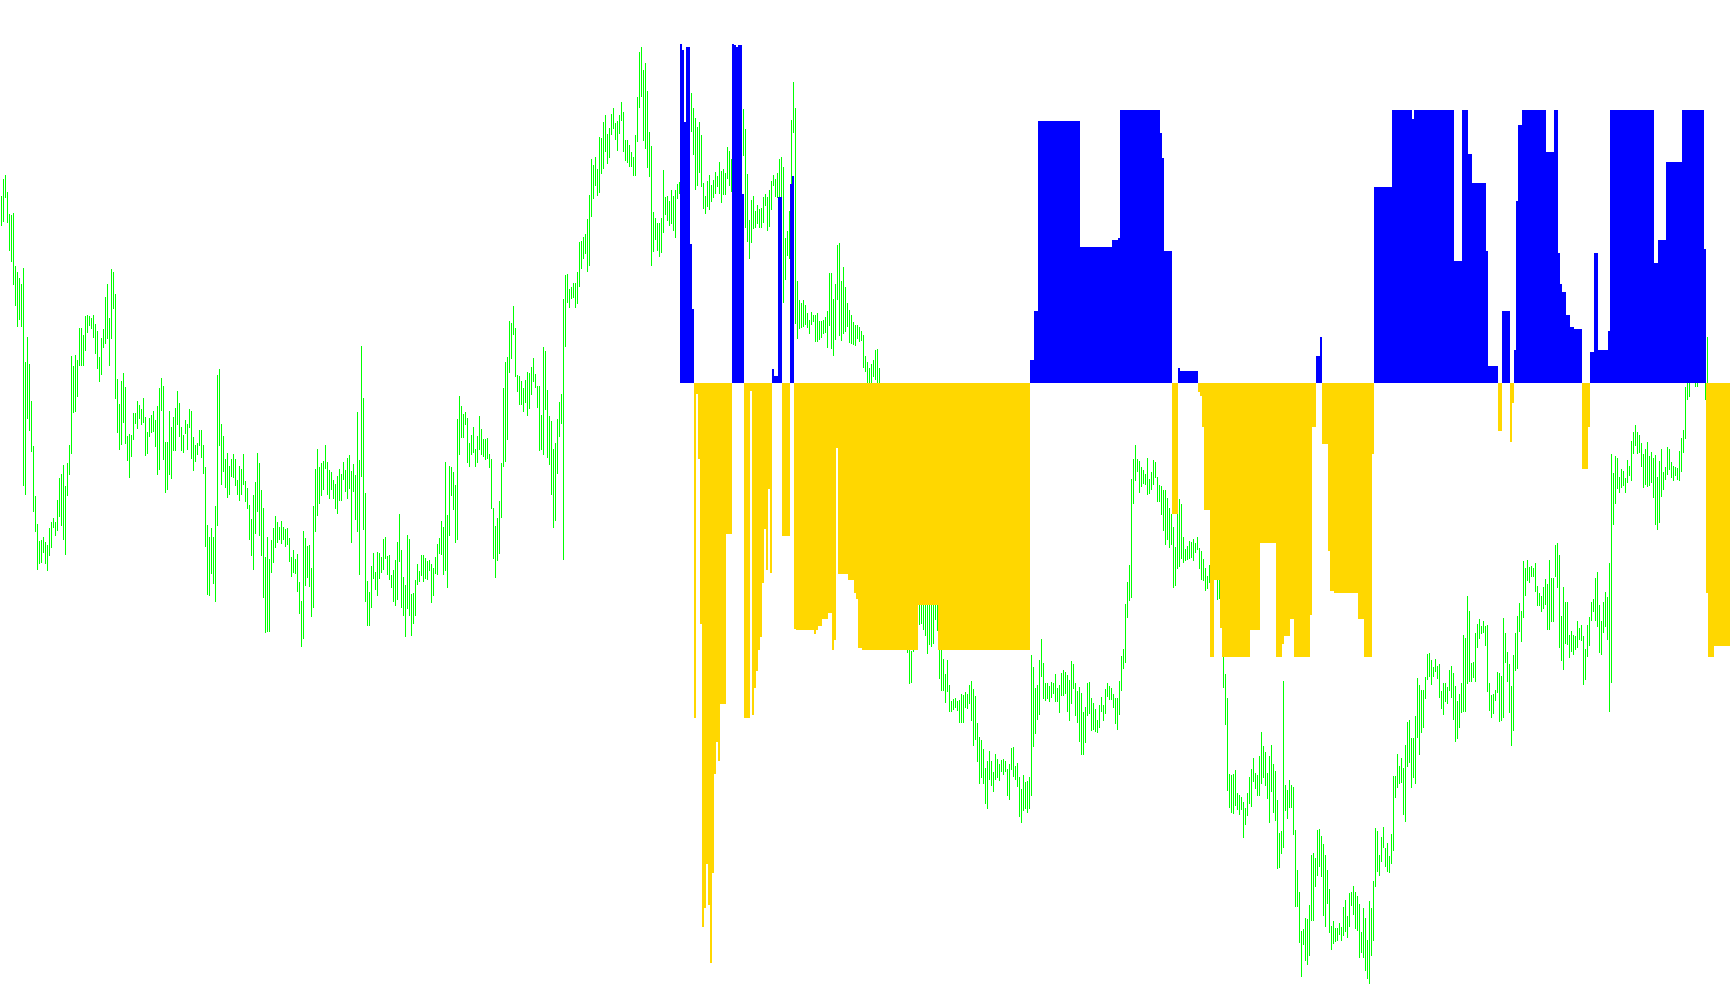
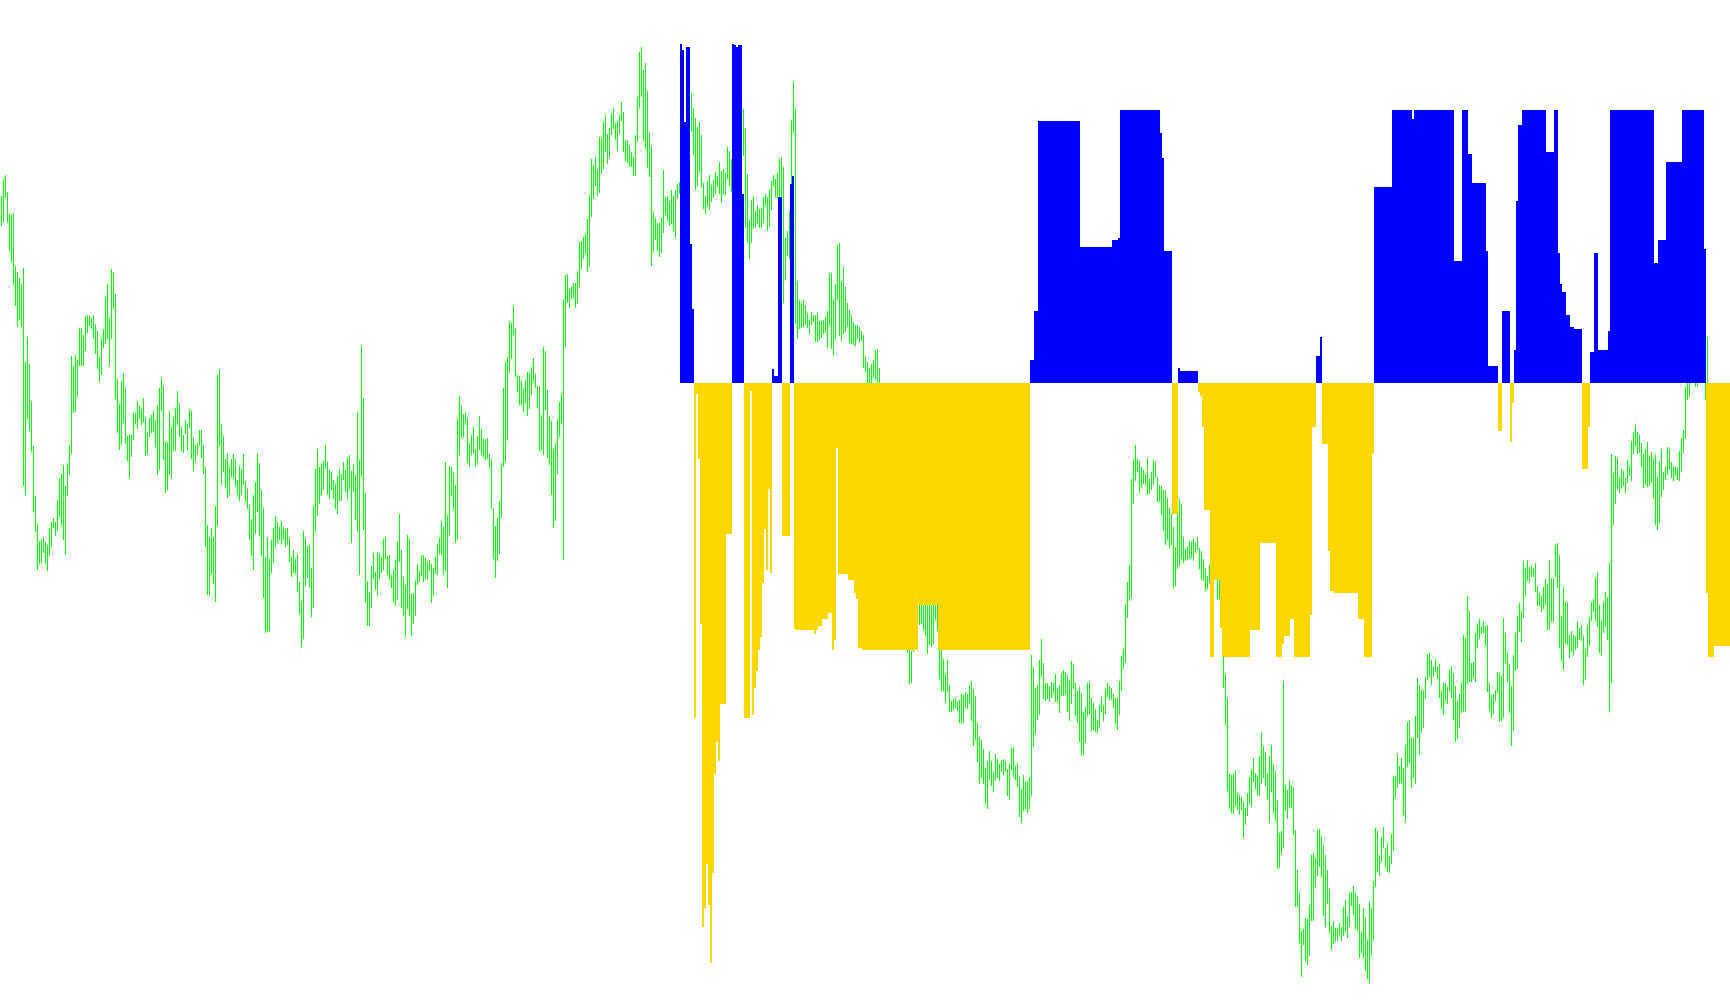
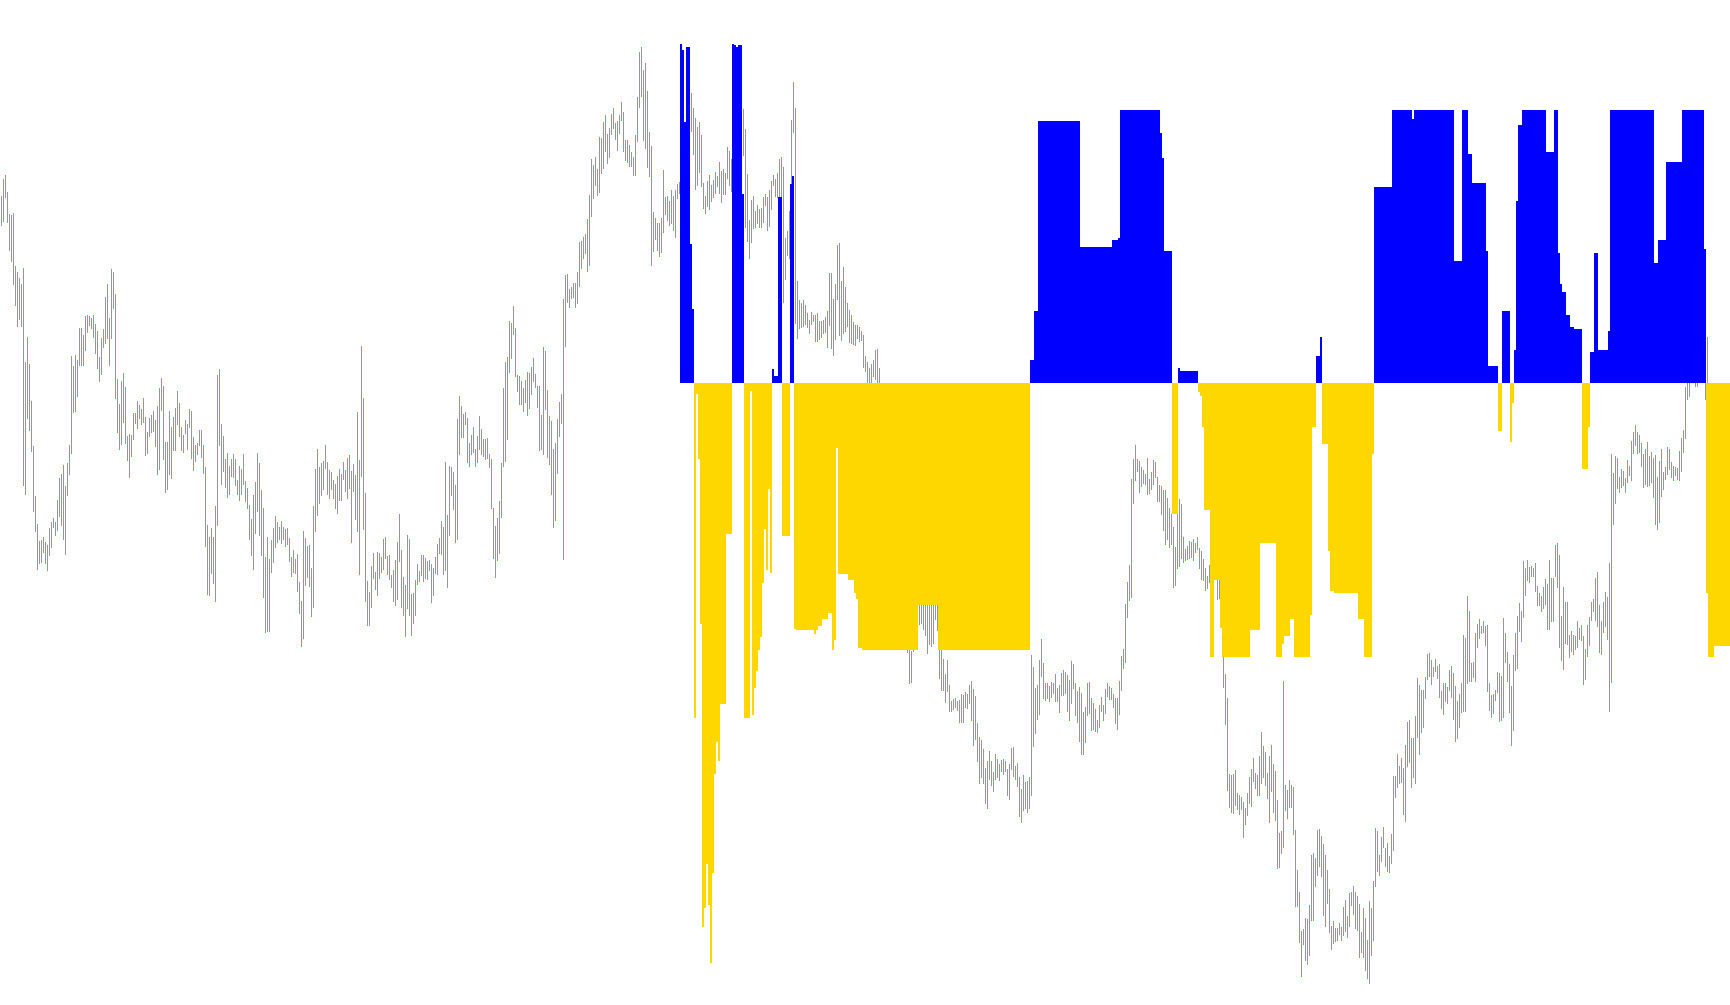
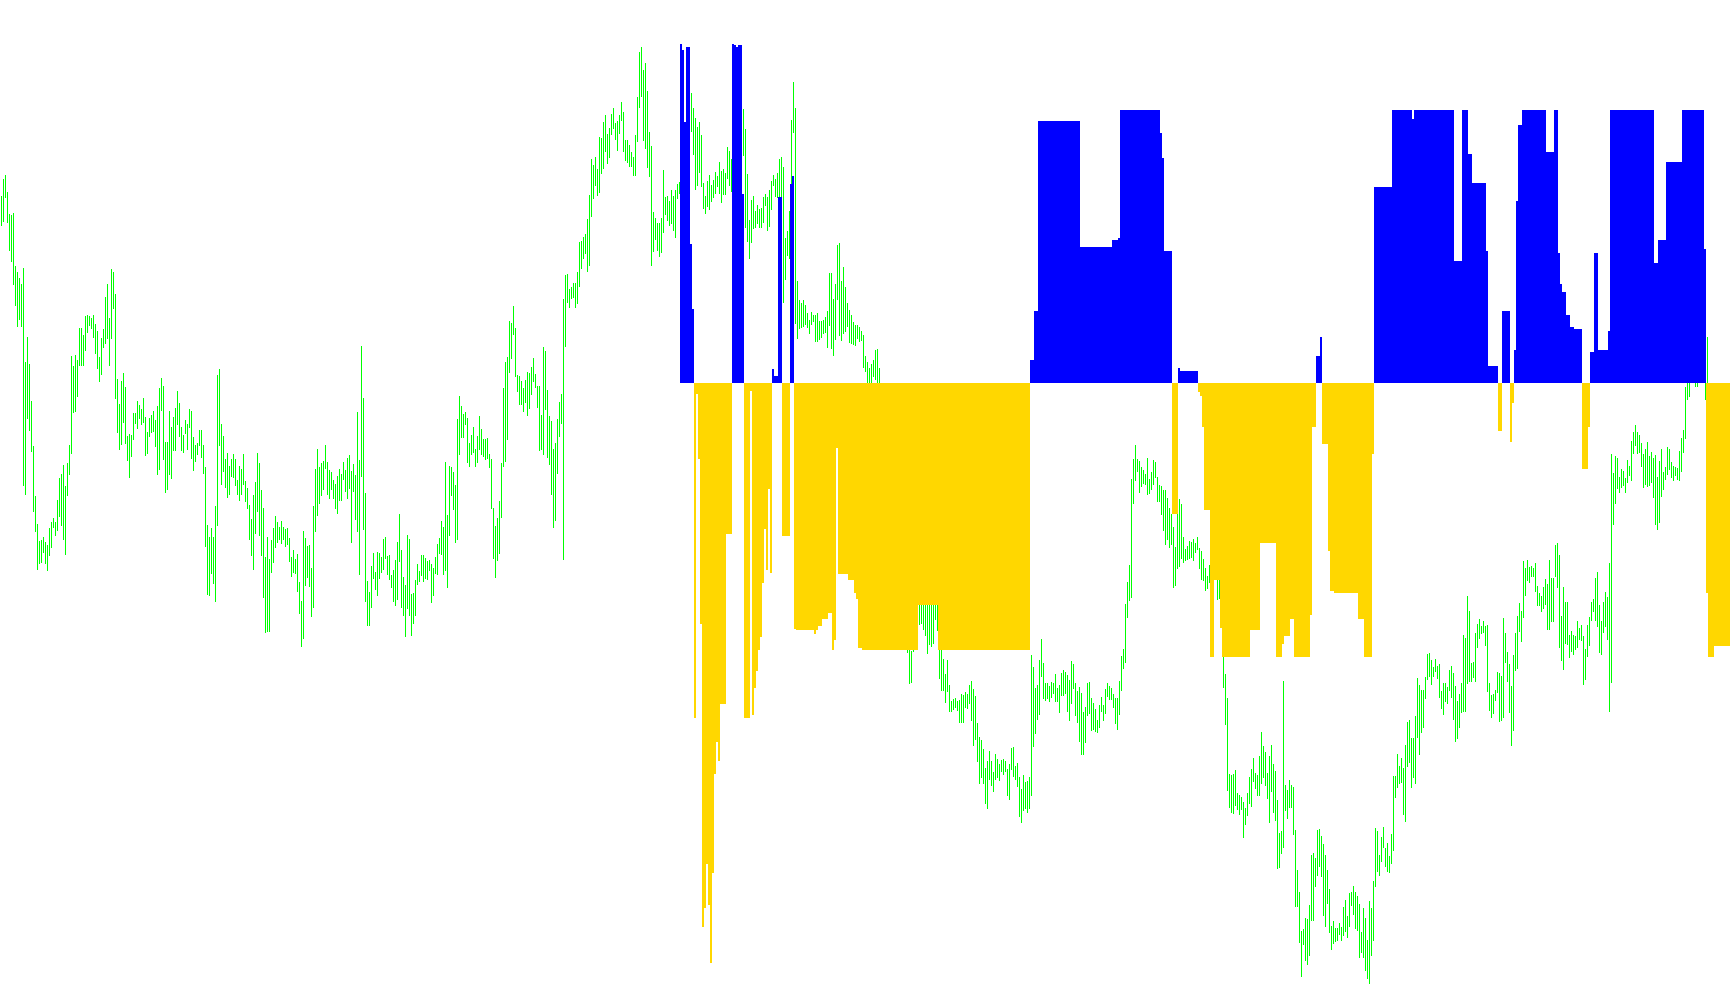
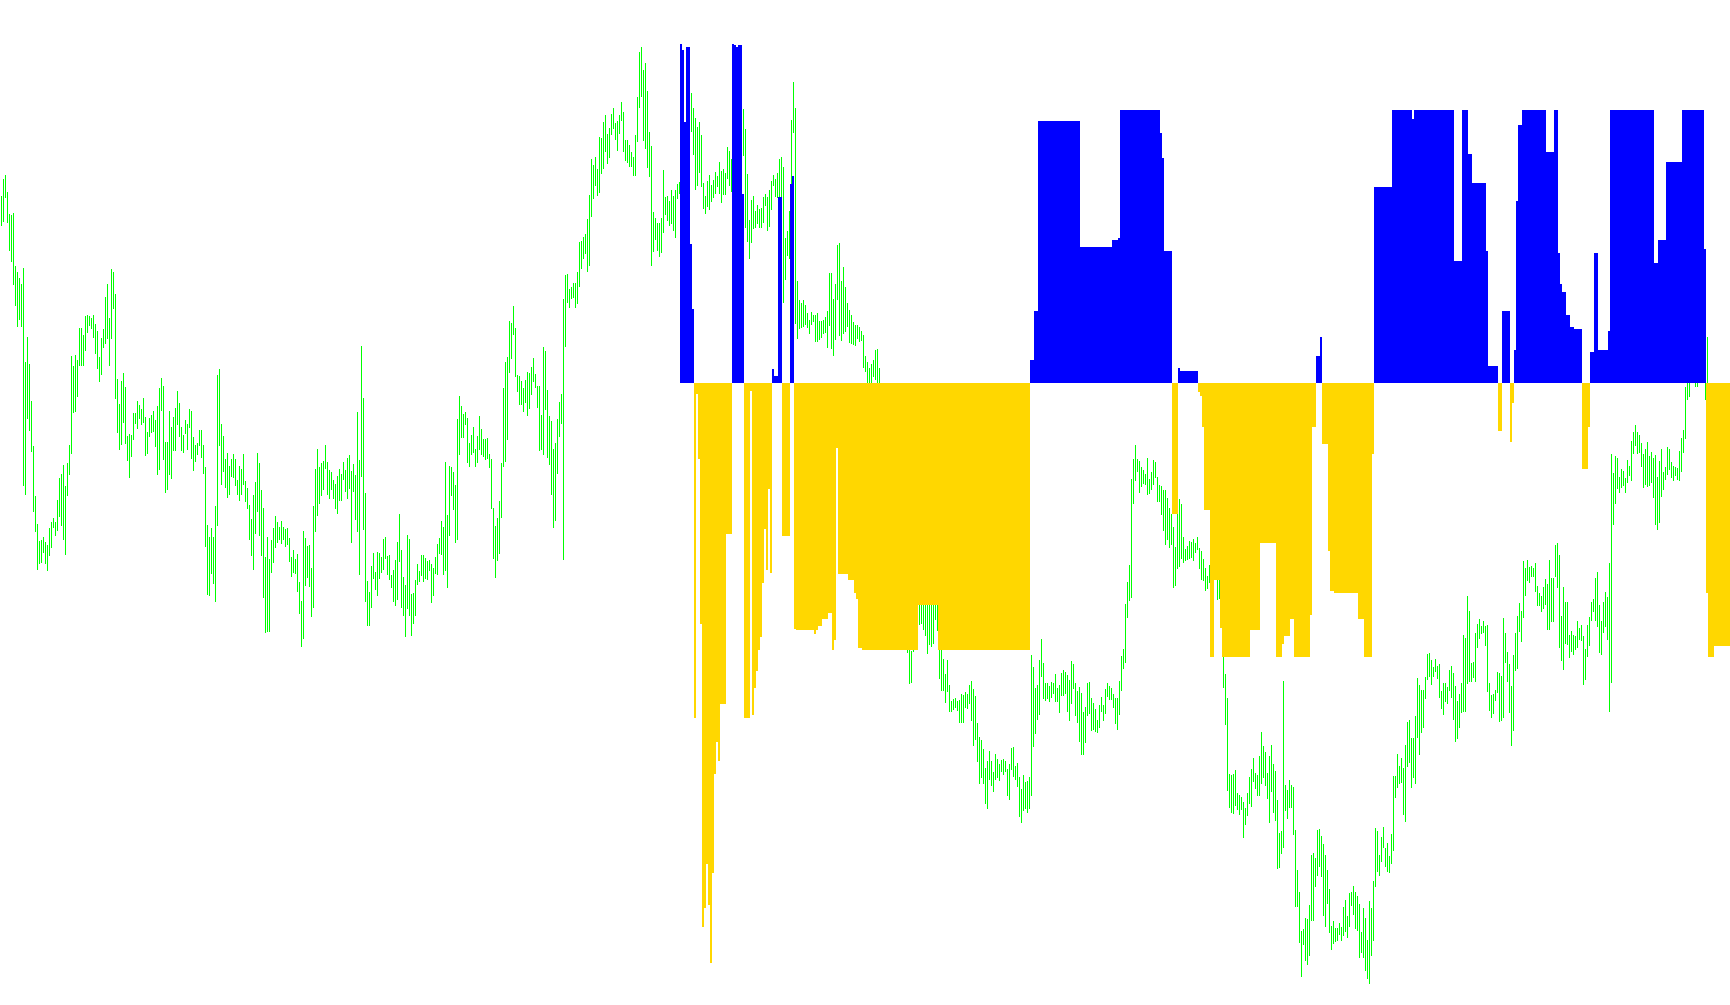
Hist_StepMA_Stoch_KV1_Ex_02
Indicator

Hist_StepMA_Stoch_KV1_Ex_02

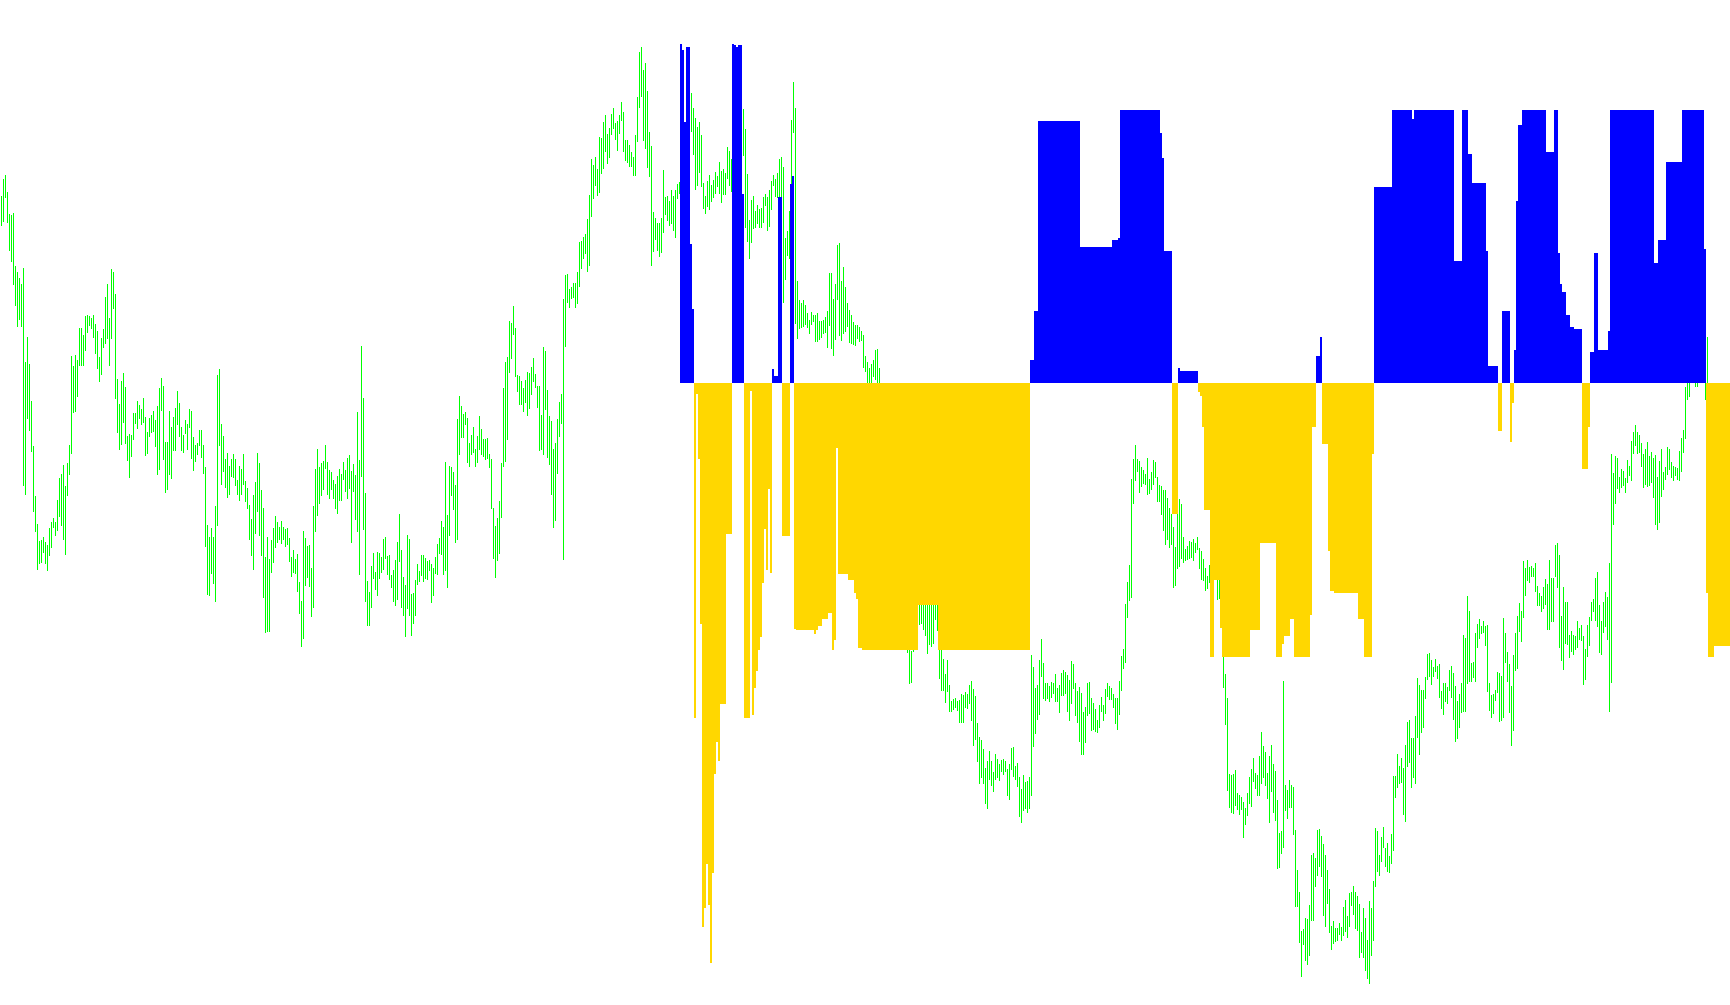
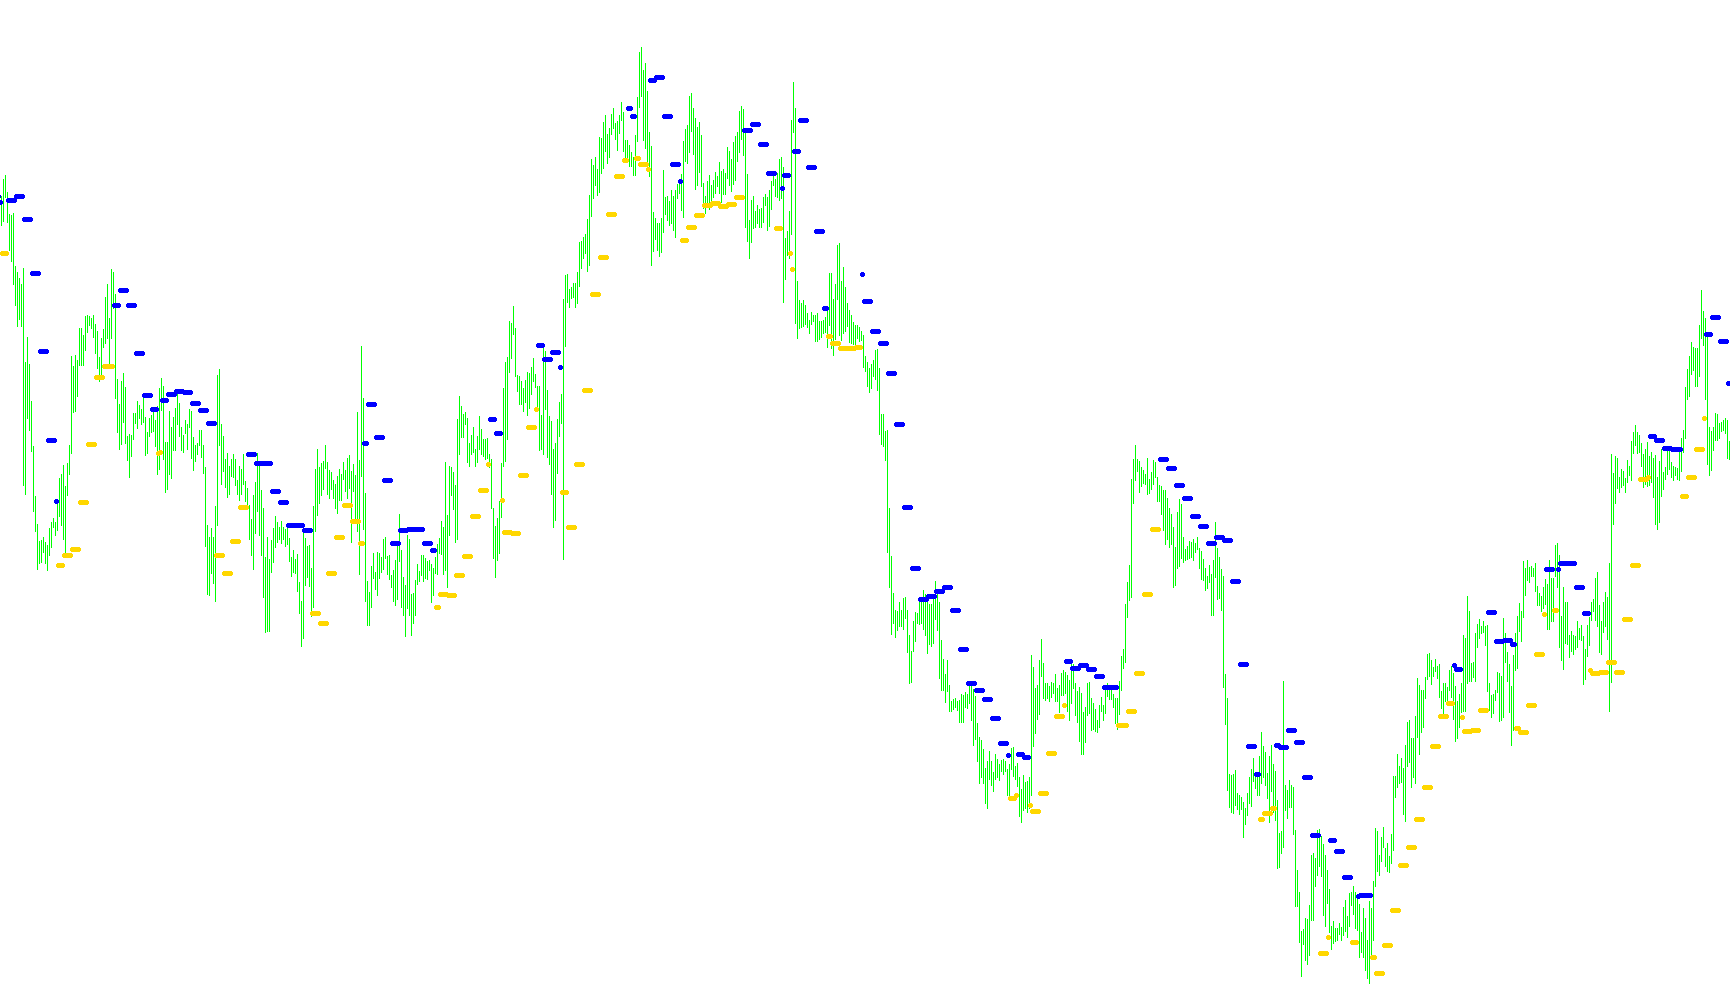
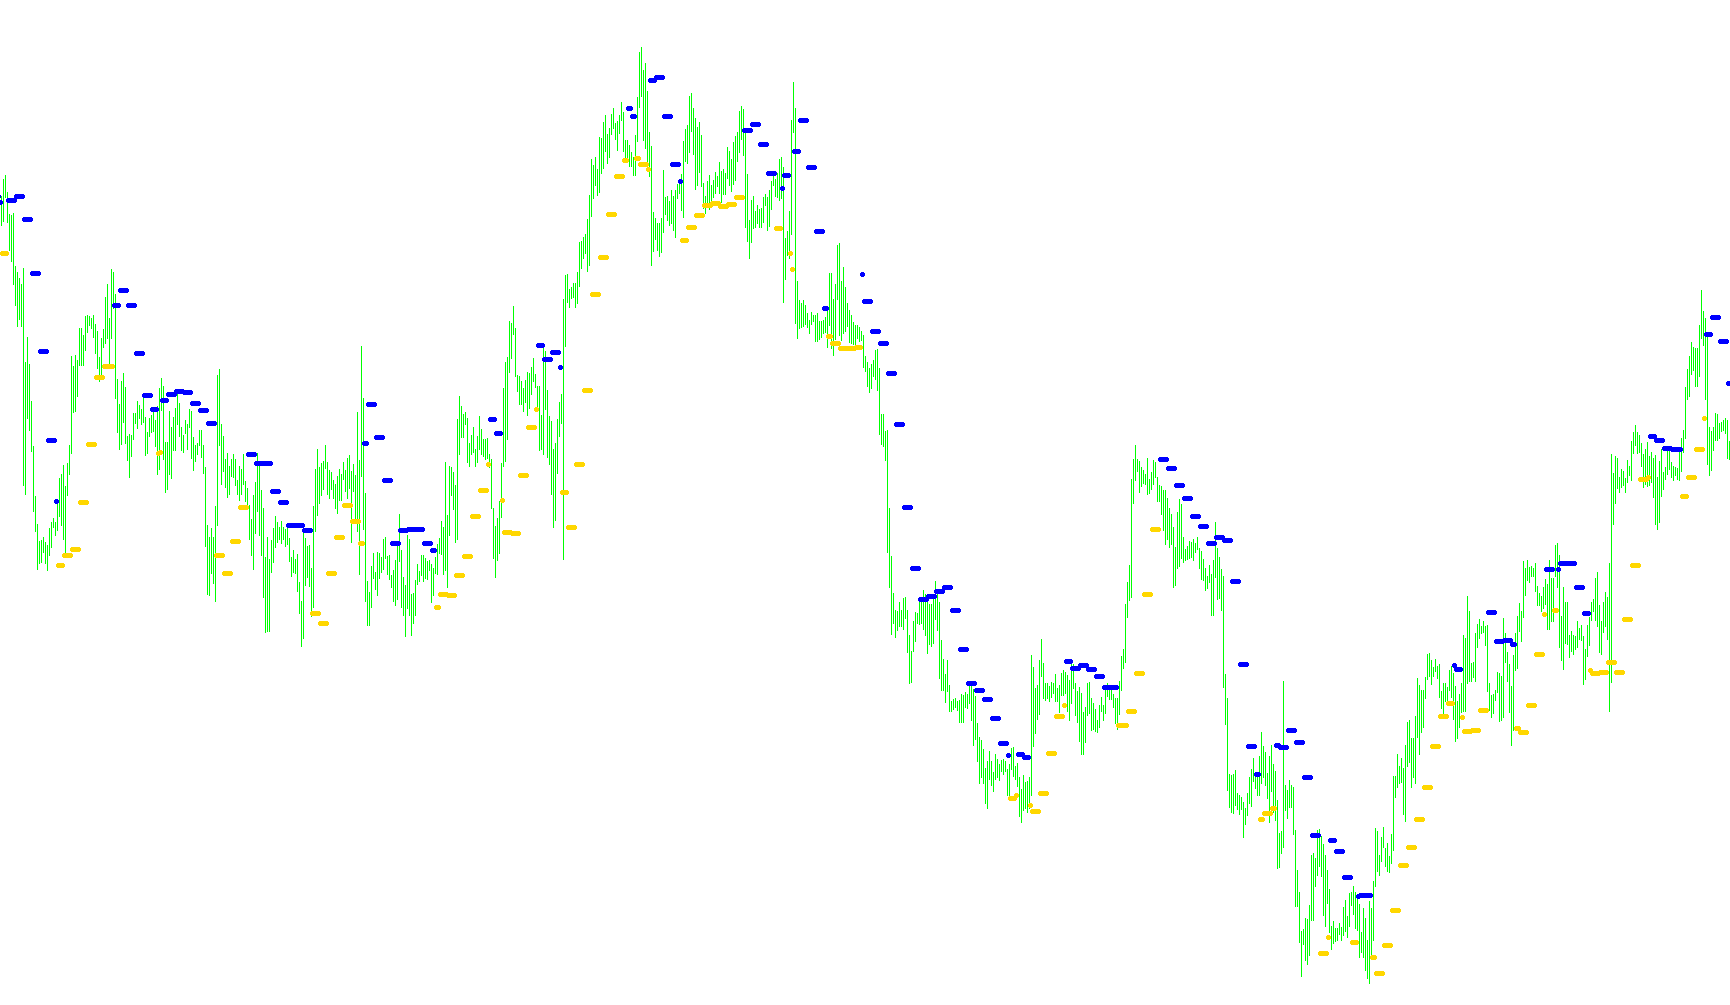
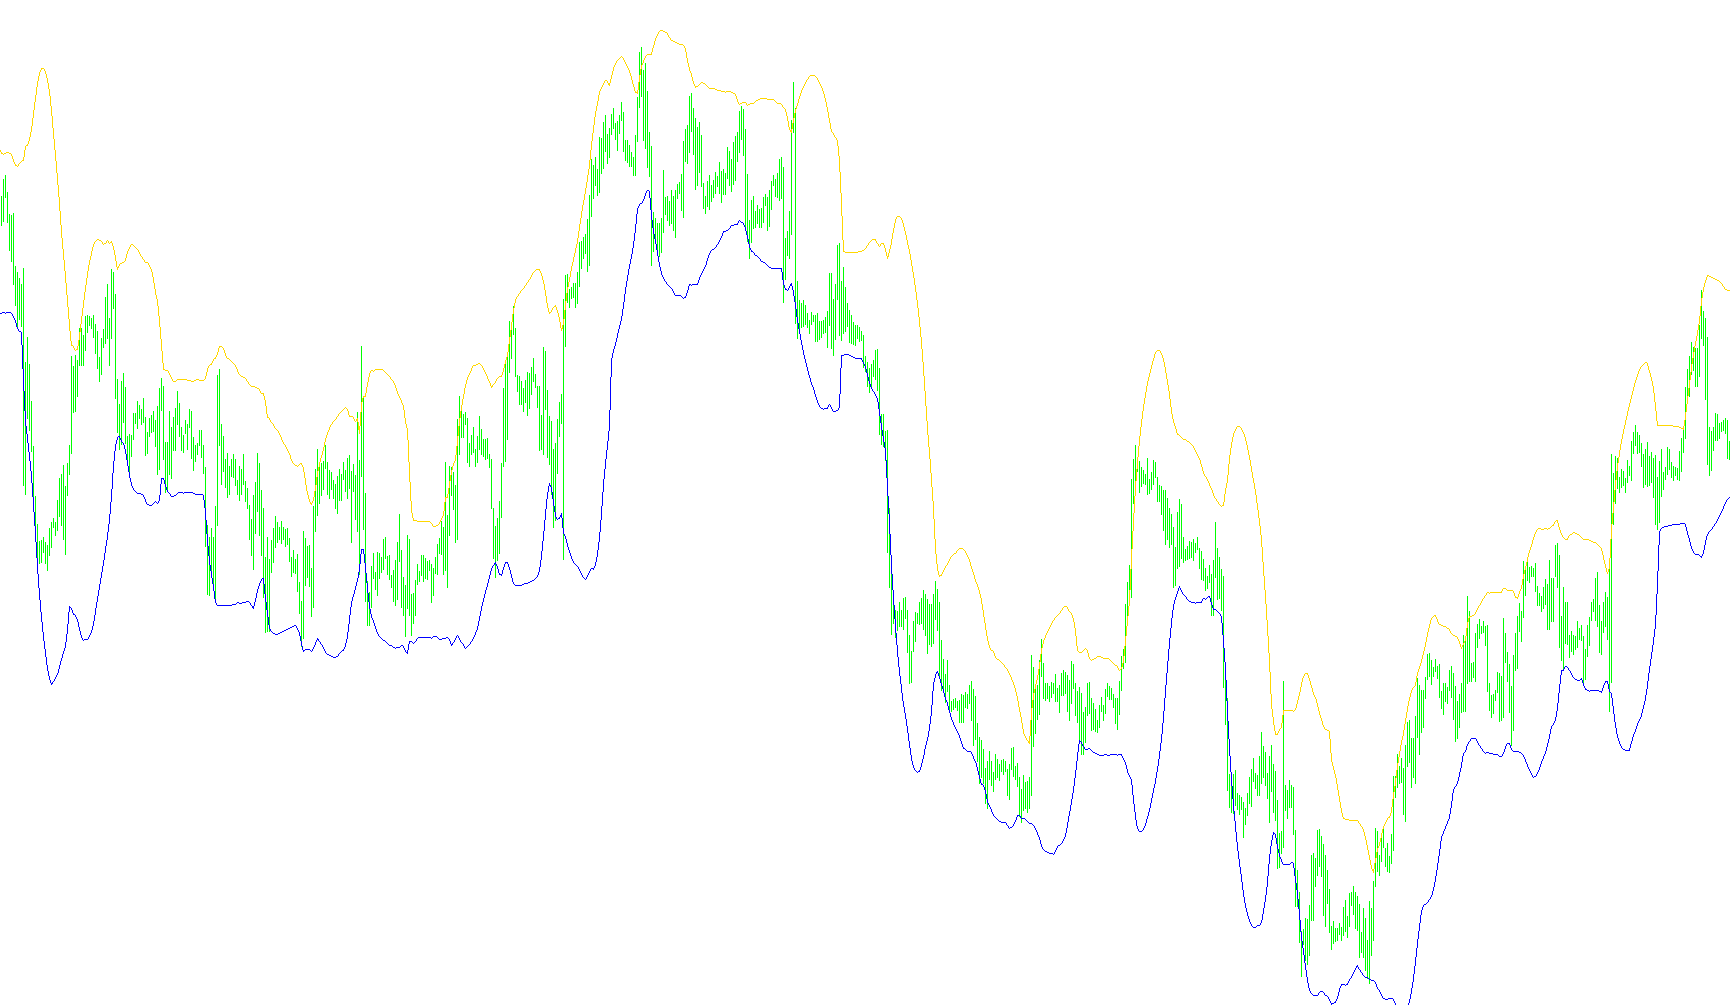
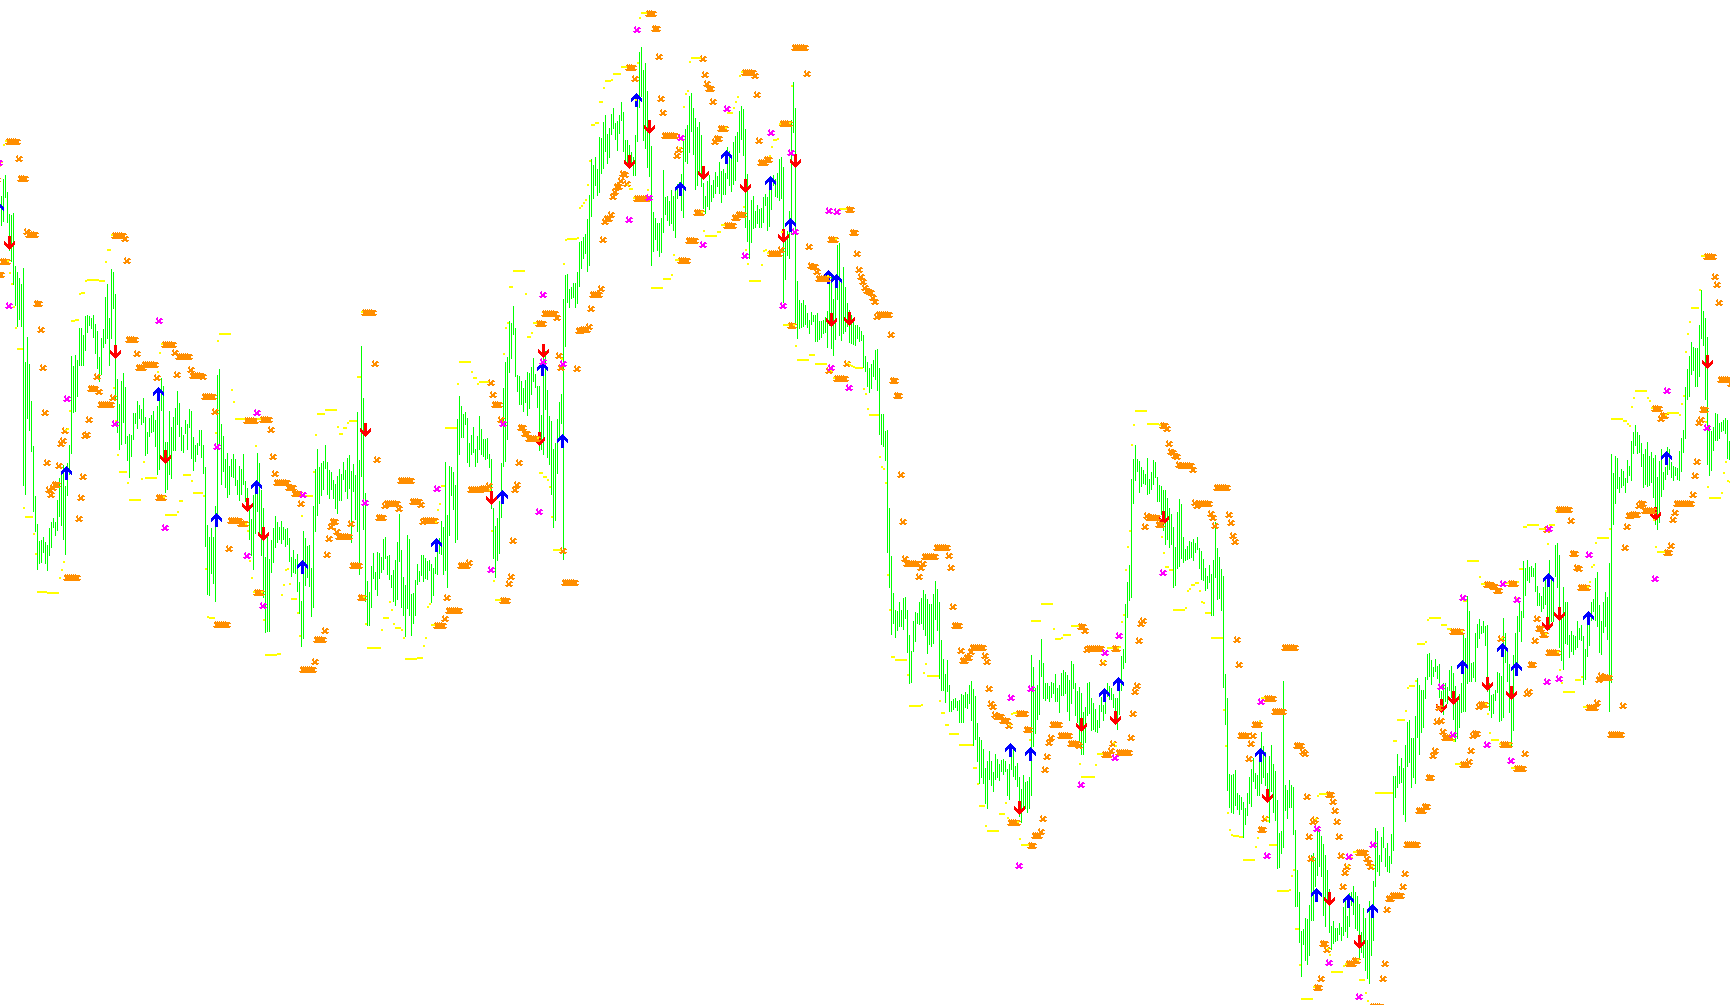
This indicator utilizes a weighted ATR-based volatility scale to project multi-tiered price steps and normalize their relative positions into a differential stochastic oscillator.

Hist_StepMA_Stoch_KV1_Ex_02_v1
Indicator

Hist_StepMA_Stoch_KV1_Ex_02_v1

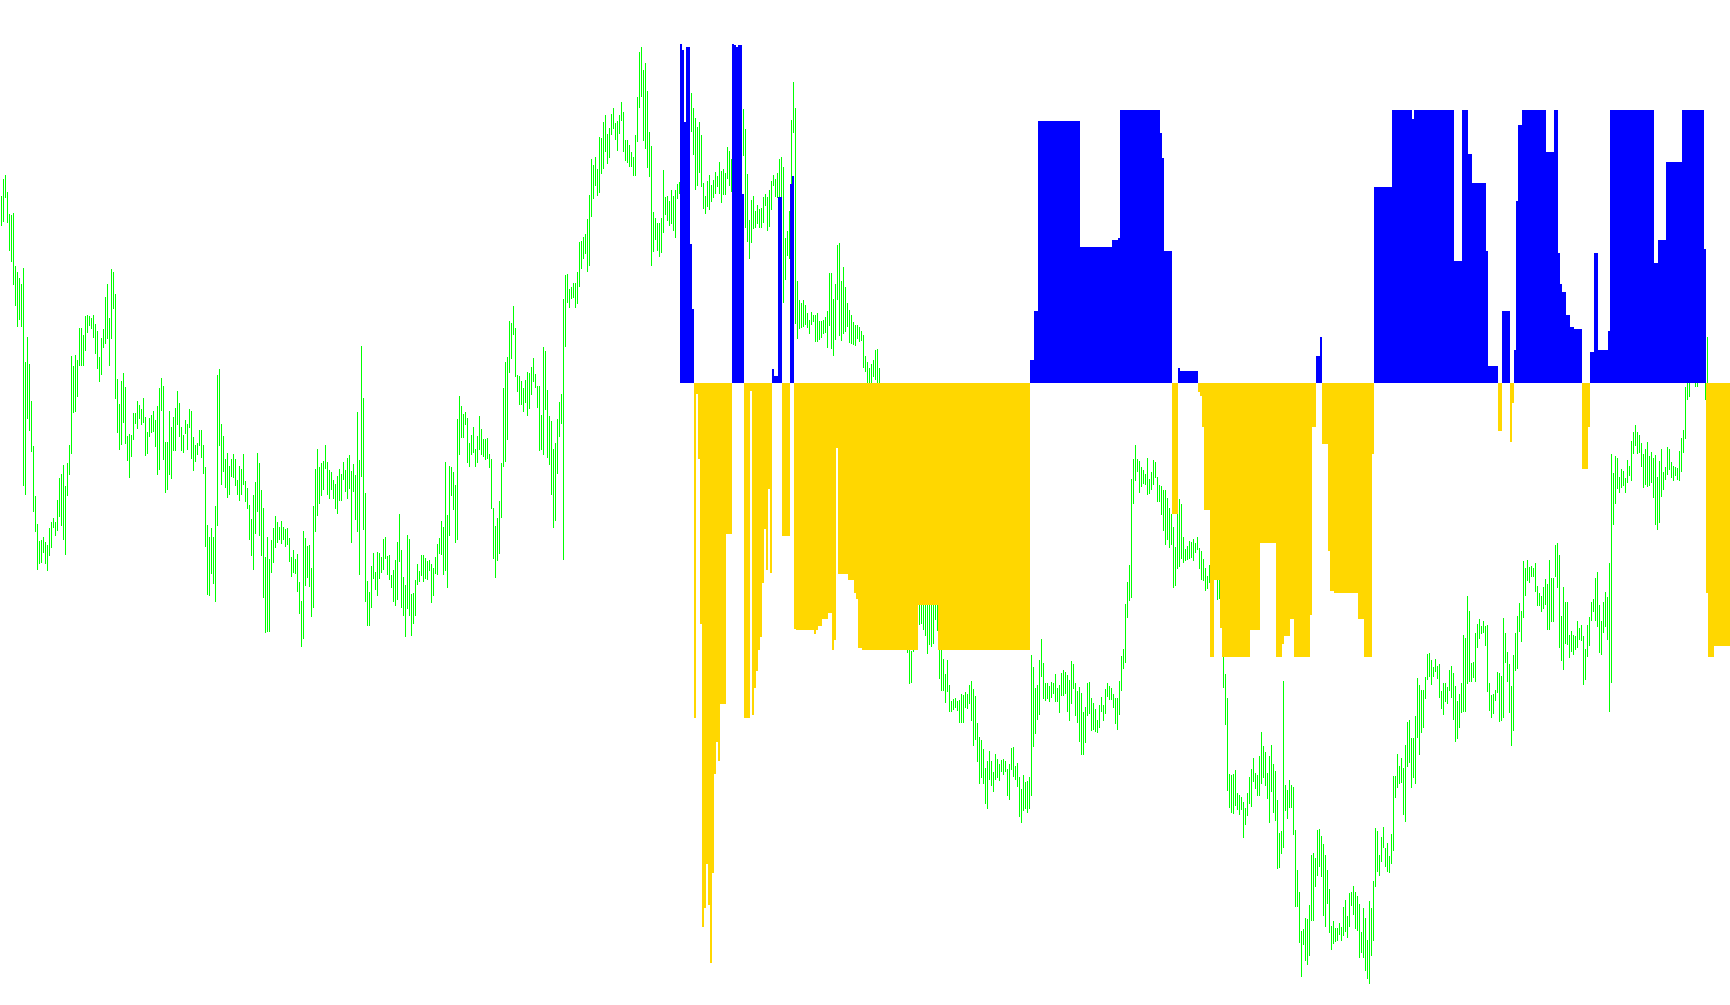
This indicator quantifies market volatility using a Weighted Average True Range (WATR) to establish dynamic step-based boundaries, then calculates momentum via the relative positioning of trend-adaptive price levels.

Hist_StepMA_Stoch_KV1_Ex_02_v3
Indicator

Hist_StepMA_Stoch_KV1_Ex_02_v3

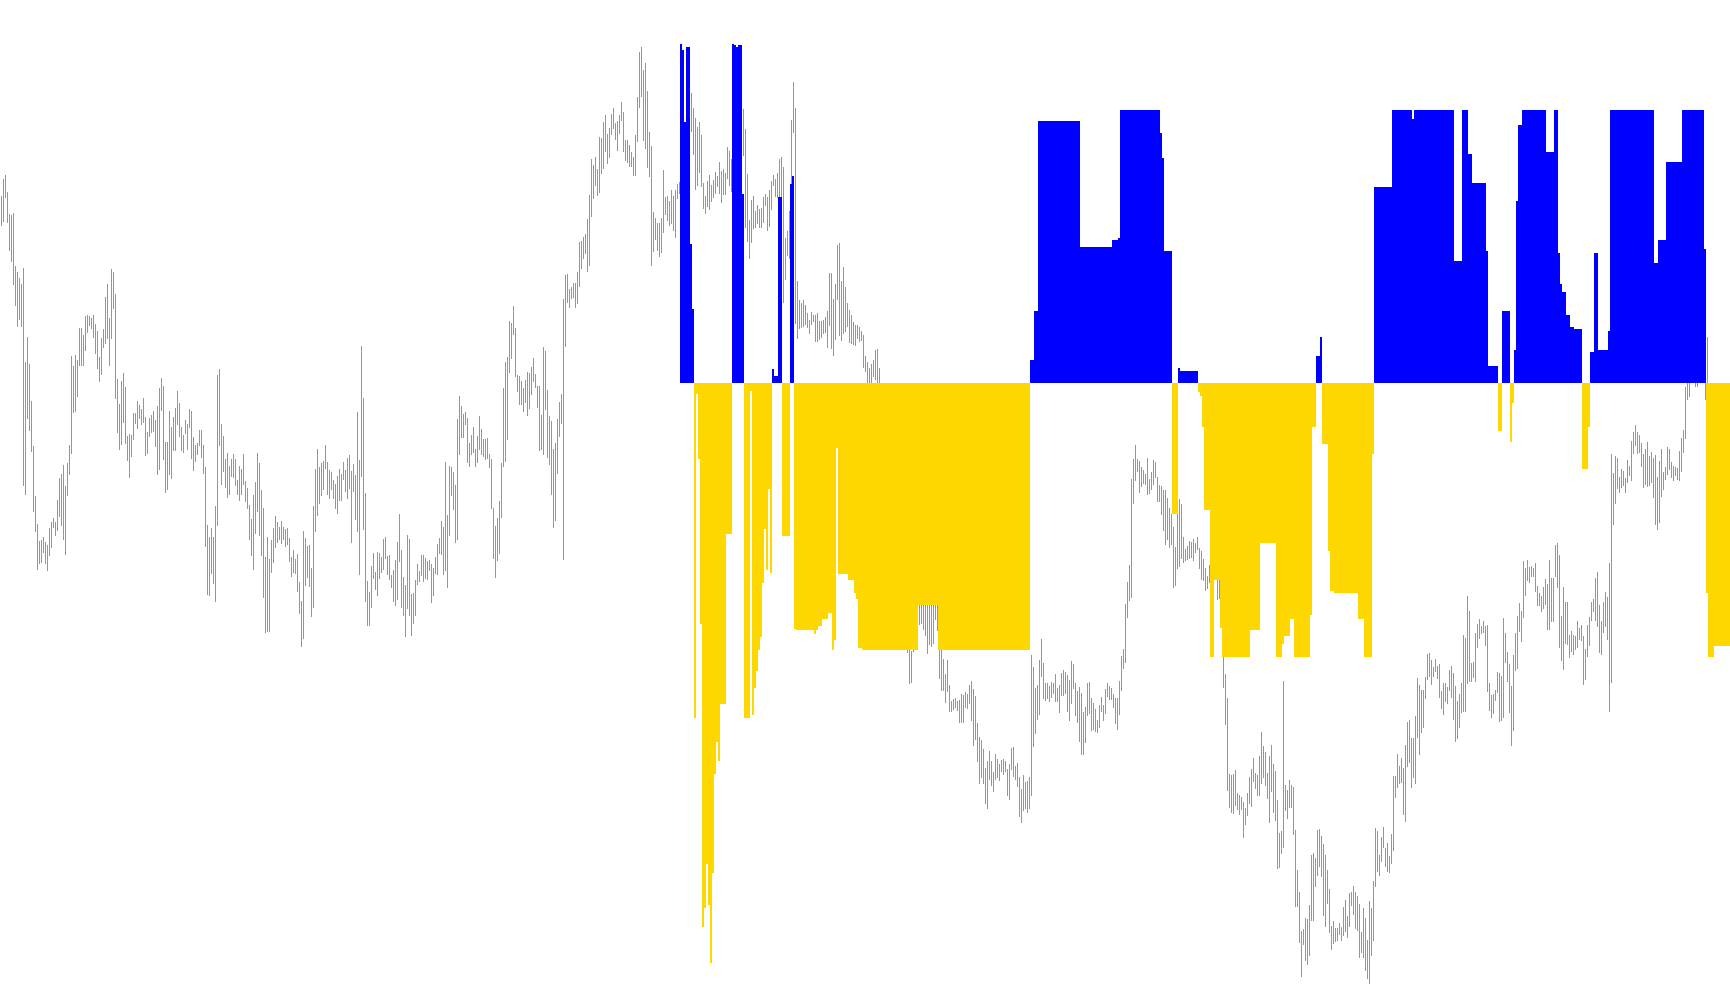
This indicator calculates momentum by normalizing relative step-based trend boundaries derived from dynamic ATR-like volatility ranges.

Hist_StepMA_Stoch_KV1_Ex_02_with Filterlevels(2)
Indicator

Hist_StepMA_Stoch_KV1_Ex_02_with Filterlevels(2)

This indicator calculates a dual-layered stochastic oscillator based on Step Moving Average price boundaries derived from dynamic volatility ranges.

Hist_StepMA_Stoch_KV1_Ex_02_with_Filterlevels
Indicator

Hist_StepMA_Stoch_KV1_Ex_02_with_Filterlevels

This indicator calculates multi-layered trend steps based on weighted volatility ranges to generate a normalized momentum oscillator.

Hist_StepMA_Stoch_KV1_Ex_03-All-bars
Indicator

Hist_StepMA_Stoch_KV1_Ex_03-All-bars

This indicator identifies trend momentum by calculating price steps relative to a weighted volatility range, converting the divergence between minimum and median step boundaries into a normalized stochastic histogram.

Hist_StepMA_Stoch_KV1_Ex_03
Indicator

Hist_StepMA_Stoch_KV1_Ex_03

This indicator calculates a dual-band stochastic oscillator based on dynamic price volatility ranges and step-based trend thresholds to identify momentum divergence.

Hist_StepMA_Stoch_KV1_Ex_031
Indicator

Hist_StepMA_Stoch_KV1_Ex_031

This indicator calculates volatility-adjusted price steps and maps their relative positions onto a stochastic oscillator to identify trend momentum based on dynamic price ranges.

Hist_StepMA_Stoch_KV1_Ex_034
Indicator

Hist_StepMA_Stoch_KV1_Ex_034

This indicator calculates momentum by measuring the deviation of current price action relative to a volatility-adjusted step range, normalized into an oscillator format.
Hist_StepMA_Stoch_KV1_Ex_03_001
Indicator

Hist_StepMA_Stoch_KV1_Ex_03_001

This indicator calculates dynamic price step boundaries based on weighted ATR volatility to generate a normalized stochastic oscillator that measures trend momentum shifts.

Hist_StepMA_Stoch_KV1_Ex_03_v1
Indicator

Hist_StepMA_Stoch_KV1_Ex_03_v1

This indicator calculates dynamic price-action boundaries based on weighted volatility ranges to generate a stochastic oscillator that measures the divergence between minimum and median trend steps.

Hist_StepMA_Stoch_KV1_Ex_03_v2
Indicator

Hist_StepMA_Stoch_KV1_Ex_03_v2

This indicator calculates a three-tiered volatility boundary based on ATR-style ranges to determine directional trend bias and normalize it into a dual-line stochastic histogram.

Hi_Low_Indicator
Indicator

Hi_Low_Indicator

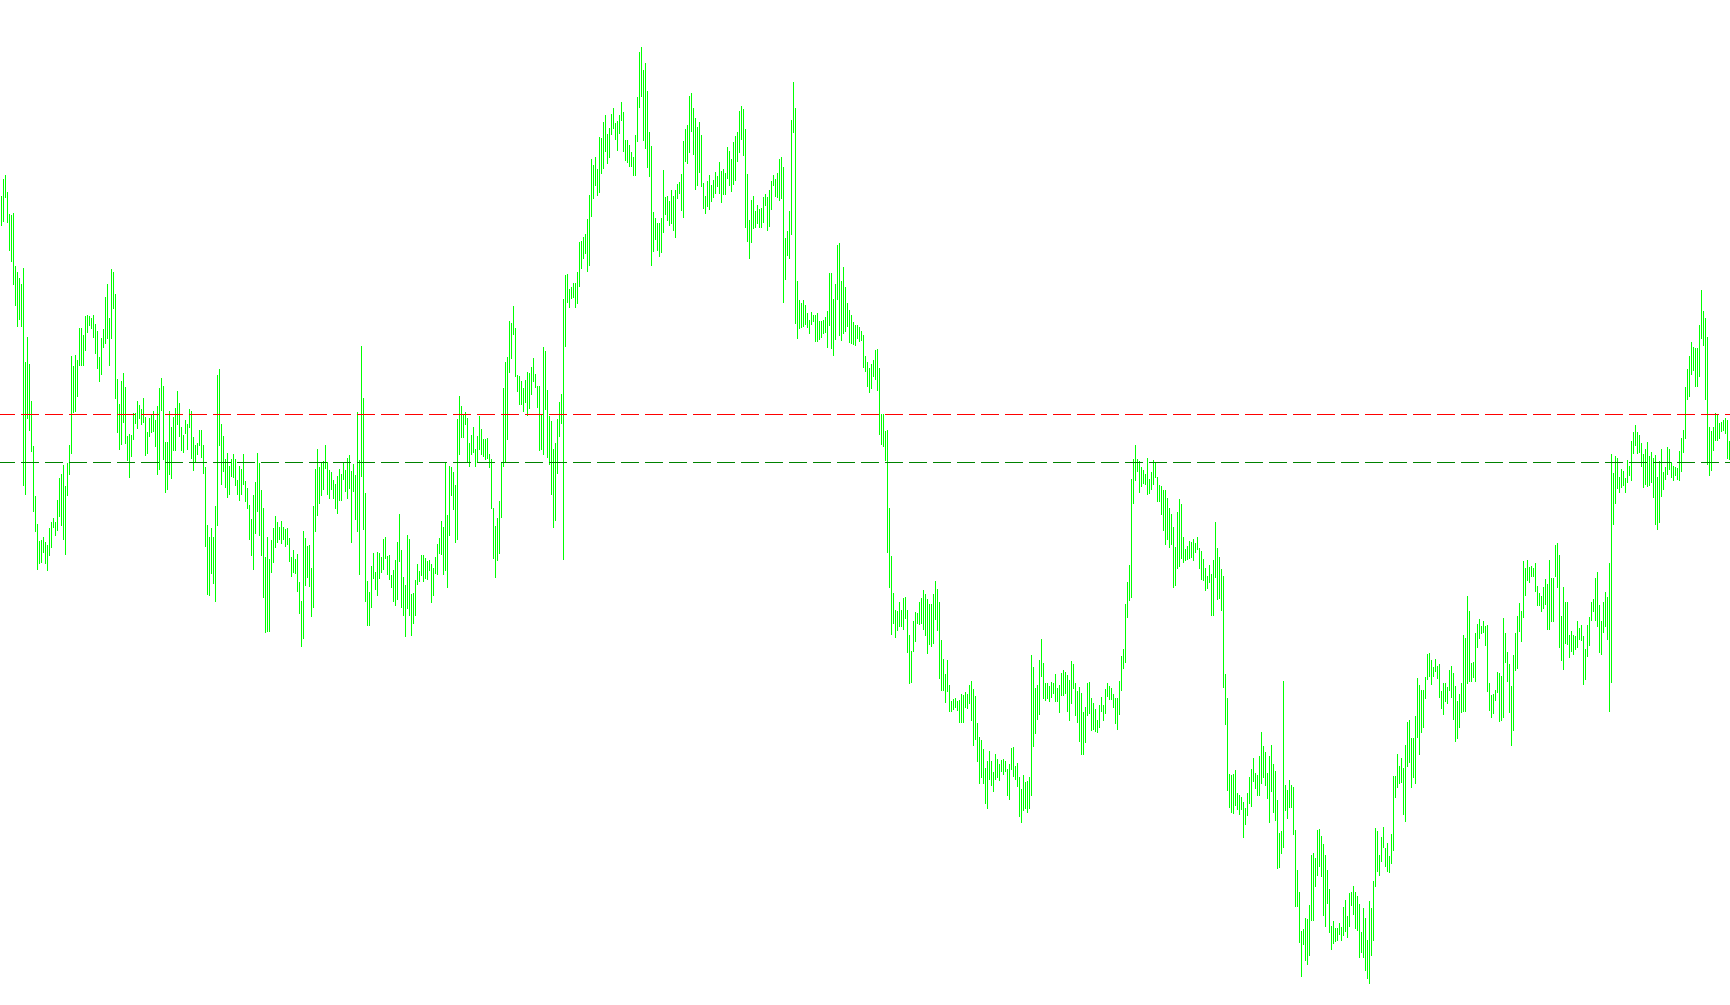
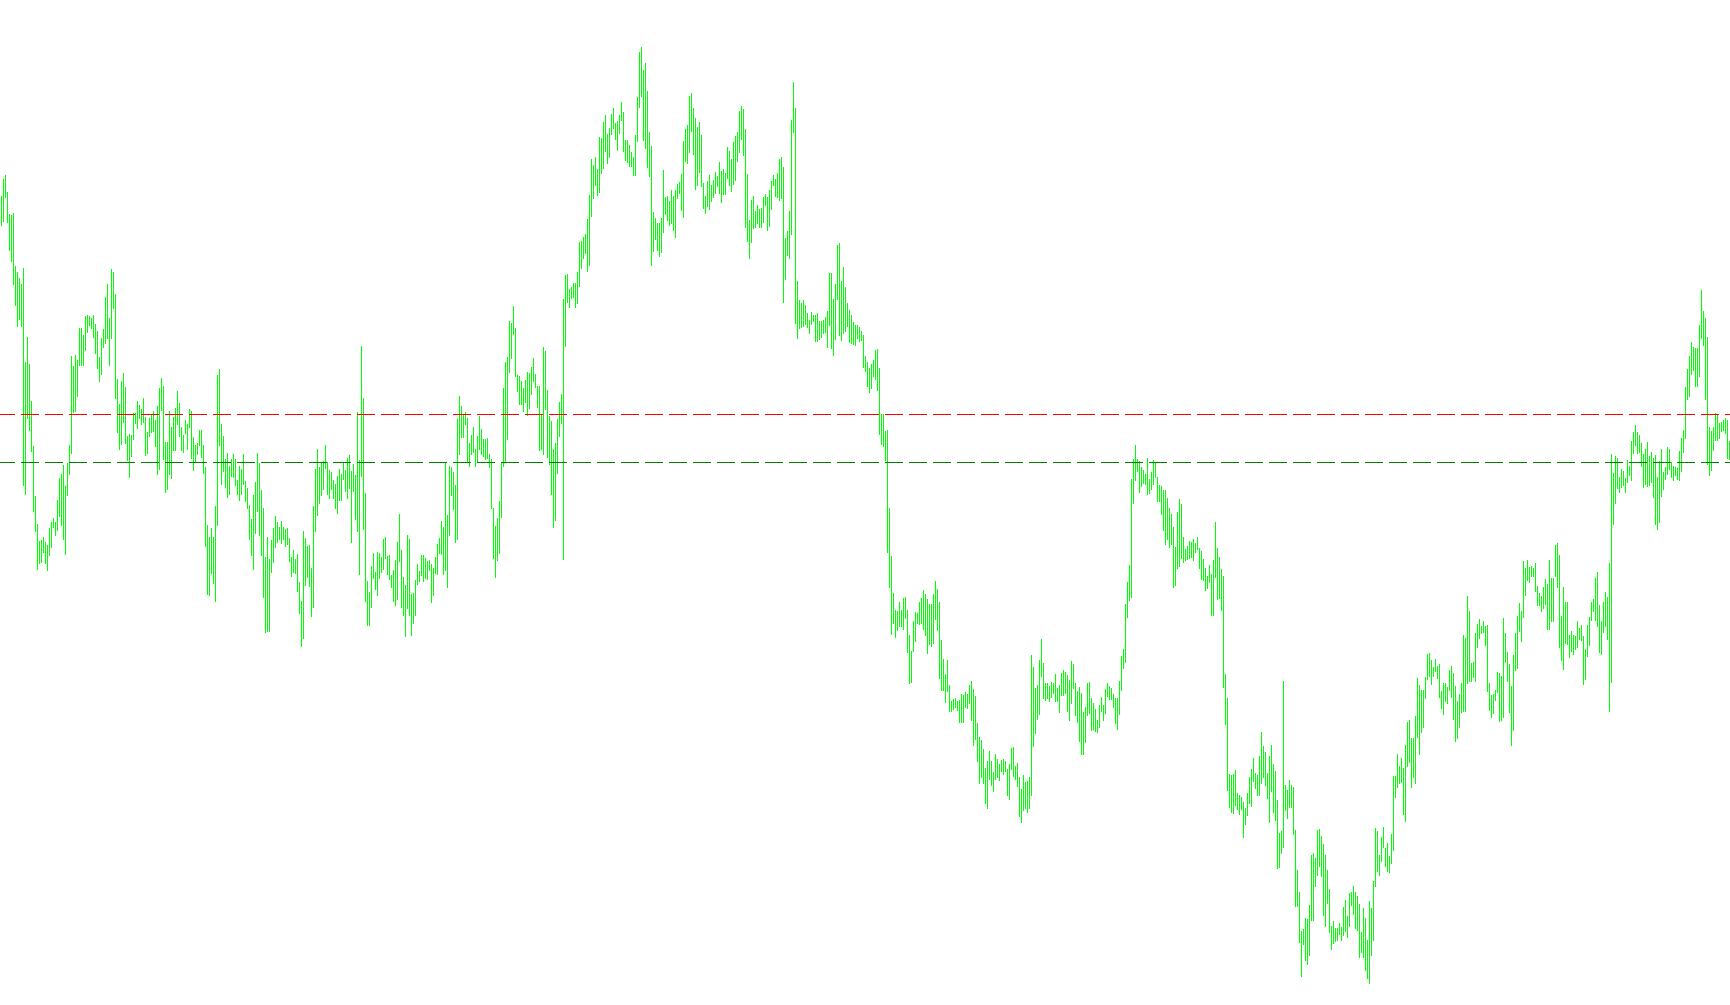
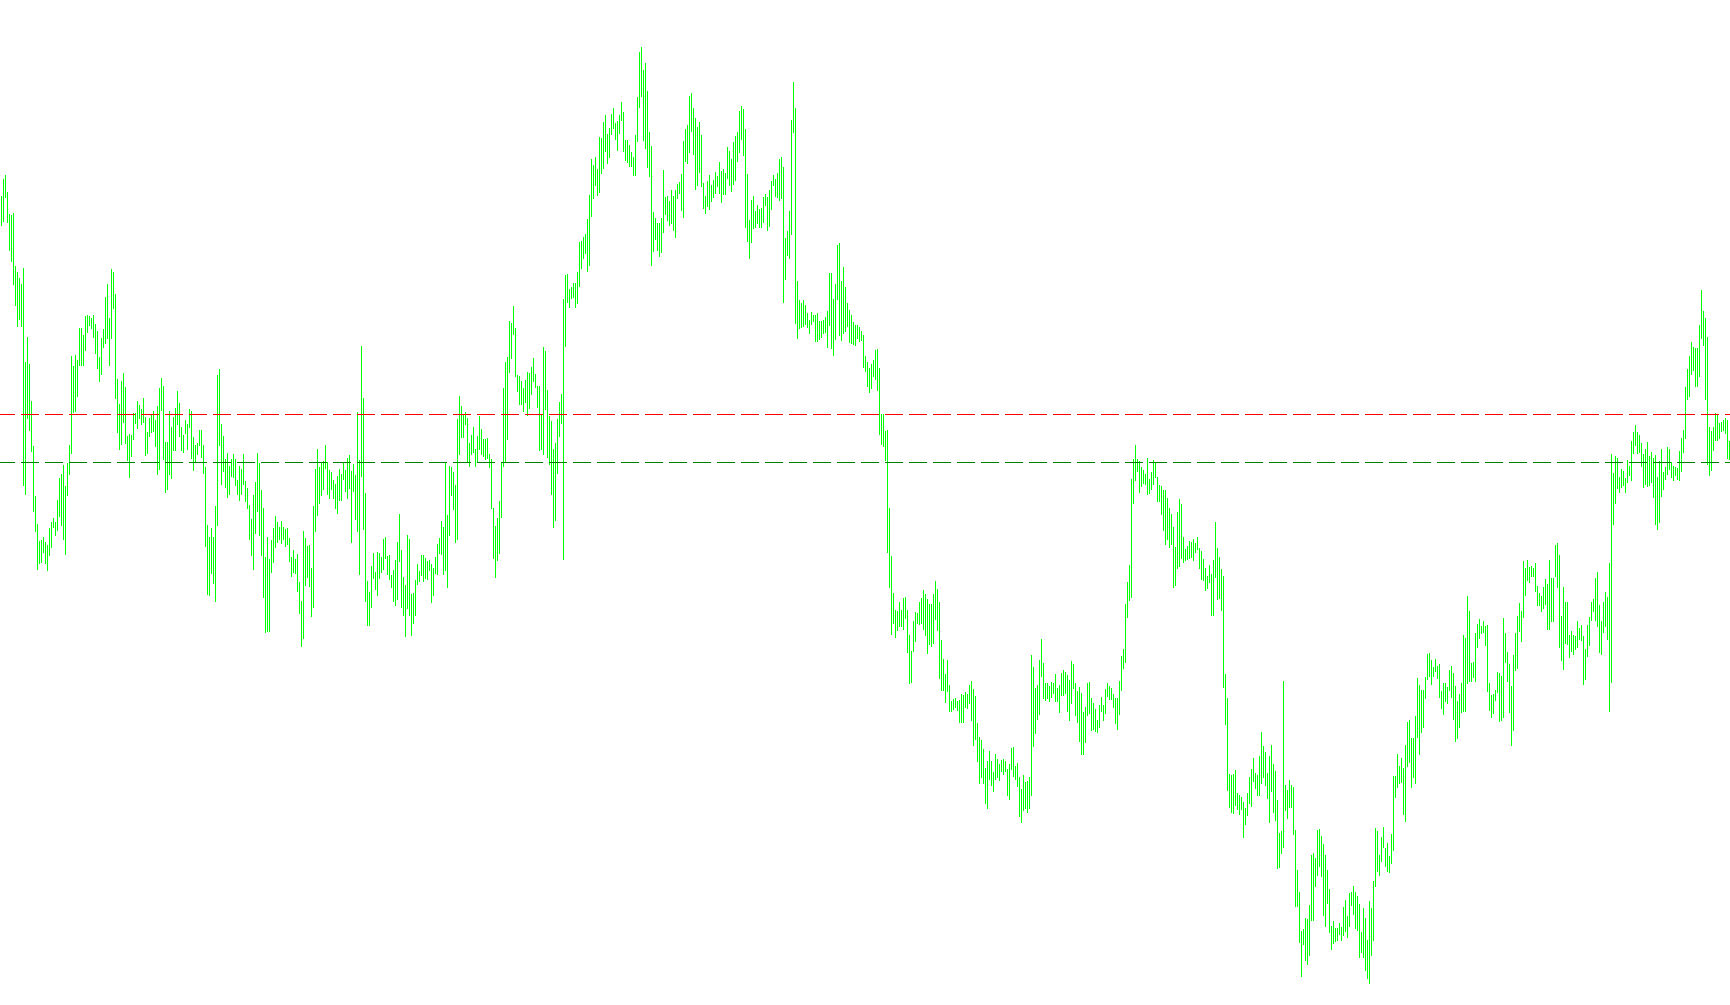
Dynamically plots horizontal dashed boundaries based on the highest and lowest price points from a specific lookback period on the hourly timeframe.

Hi_Low_Indicator_v1
Indicator

Hi_Low_Indicator_v1

This indicator identifies and plots the highest and lowest price points from a specific historical lookback period on the H1 timeframe to establish horizontal support and resistance levels.

Hi_Low_Indicator_v2
Indicator

Hi_Low_Indicator_v2

Identifies and projects the highest and lowest price levels from a specific historical lookback period onto the current chart as horizontal reference lines.

HL Next Activator Comment
Indicator

HL Next Activator Comment

This indicator identifies momentum shifts by calculating and plotting the average highs and lows across specific delimiter-defined price ranges to signal potential trend reversals.

HL Next Activator
Indicator

HL Next Activator

This indicator identifies trend reversals by detecting price breaches of the calculated average high or low levels across predefined structural delimiters.

HL Next Activator_v1
Indicator

HL Next Activator_v1

This indicator identifies price breaches of averaged historical extremes by scanning for specific temporal delimiters to calculate volatility-adjusted pivot levels.

HL Next Activator_v3
Indicator

HL Next Activator_v3

This indicator identifies structural reversal points by calculating and projecting mean high and low boundaries based on detected period delimiters.

HL
Indicator

HL

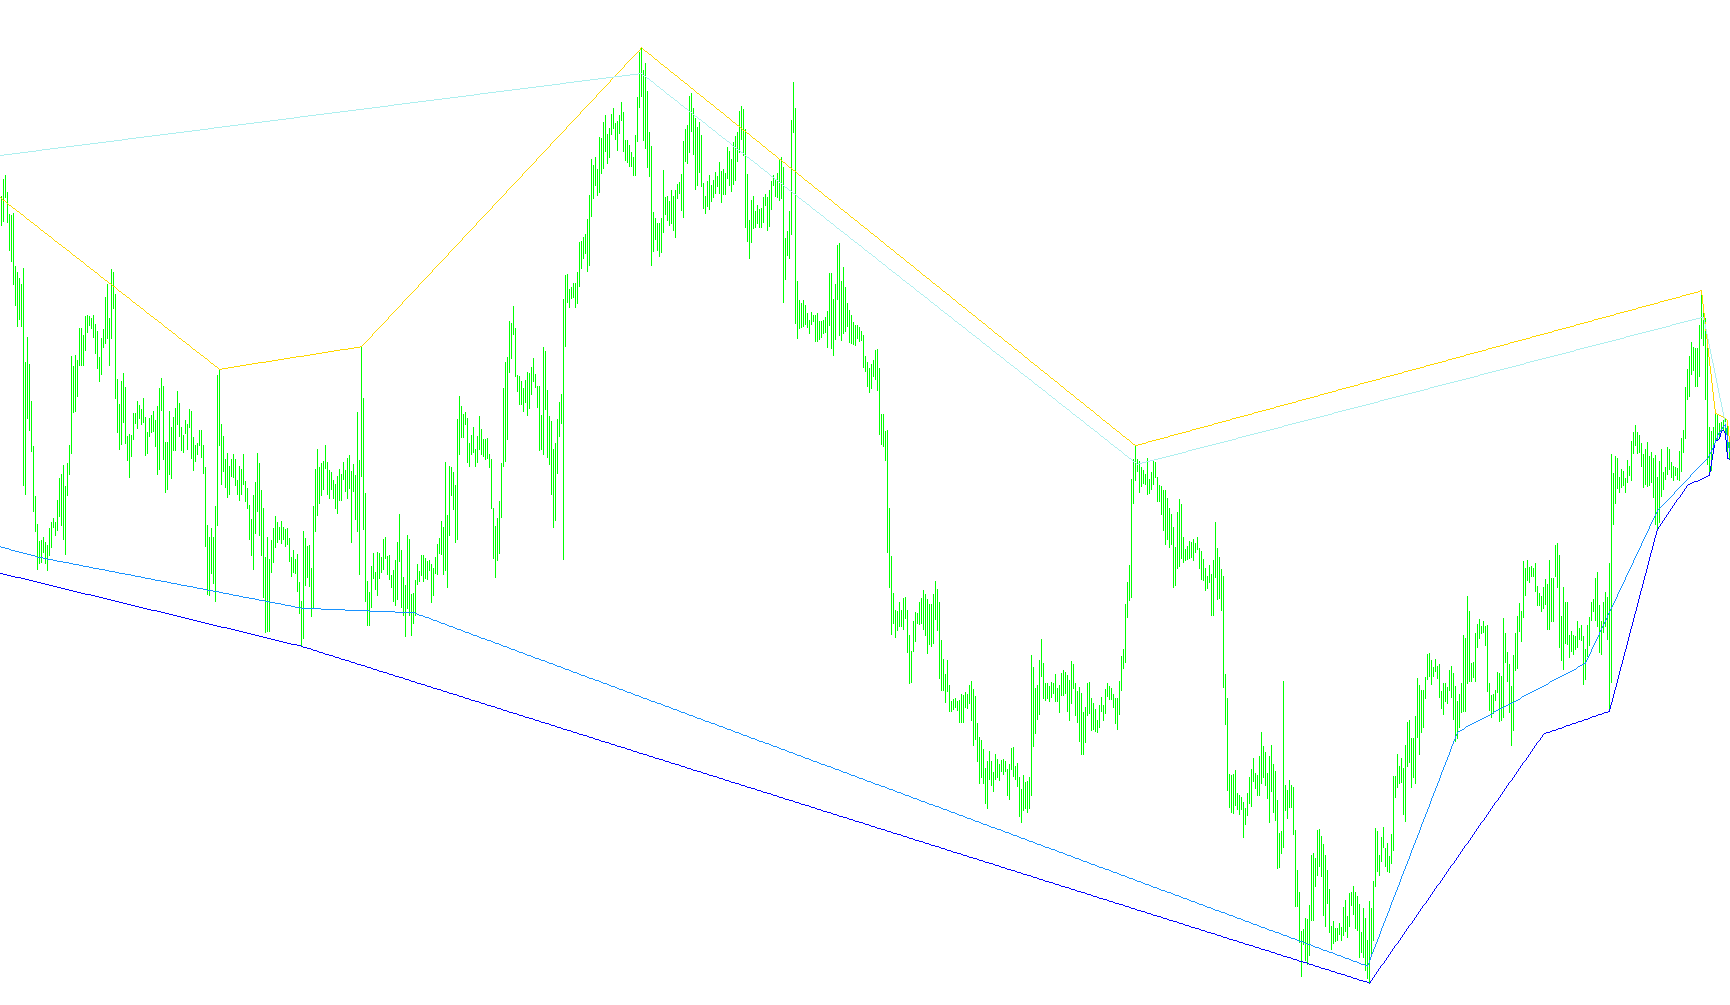
This indicator identifies structural price pivots based on highs, lows, and midpoints to project linear trend segments across specific historical cycles.

HLBolinger
Indicator

HLBolinger

iBands

This indicator calculates independent upper and lower standard deviation boundaries based on high and low price extremes rather than traditional closing prices.

HLCrossSig for WPR
Indicator

HLCrossSig for WPR

iATRiWPRiMA

This indicator identifies trend reversal points by synchronizing high/low breakouts with Heiken Ashi price action filters and Williams %R overbought/oversold thresholds.

HLine Alert
Indicator

HLine Alert

This indicator triggers a system notification when the current market price enters a user-defined pip range relative to a static horizontal price level.

HLine Alert_001
Indicator

HLine Alert_001

This indicator monitors real-time price action to trigger an audible notification when the current quote enters a user-defined pip range of a specific horizontal line.

HLine Alert_once_per_bar
Indicator

HLine Alert_once_per_bar

This indicator triggers a single auditory notification when the current market bid price intersects within a predefined pip range of a specified horizontal level.

HLR
Indicator

HLR

This indicator normalizes the current mid-price position relative to the highest high and lowest low over a specific lookback period to determine relative price location.

HL_Activator_NEXT
Indicator

HL_Activator_NEXT

This indicator identifies significant price breakouts by calculating the rolling average of historical high and low extremes across specific time intervals (hourly, daily, weekly, and monthly) and plotting visual signals when the close price pierces these levels.

Indicator

HL_Objects

HL_v1
Indicator

HL_v1

This indicator identifies local price extrema and performs linear interpolation to bridge consecutive structural peaks and troughs for high/low and midpoint prices.

HL_v2
Indicator

HL_v2

This indicator calculates and renders continuous linear trajectories by interpolating price data points between local extrema to visualize underlying directional flow.

HMA - Ogeima
Indicator

HMA - Ogeima

iMAiMAOnArray

This indicator calculates a smoothed differential value between two scaled moving averages to visualize price velocity and trend strength.

Indicator

HMA alert

Indicator

HMA Modified

iMAiMAOnArray
Indicator

HMA Modified_001

iMAiMAOnArray
Indicator

HMA Modified_002

iMAiMAOnArray
Indicator

HMA Modified_003

iMAiMAOnArray
Indicator

HMA Modified_004

iMAiMAOnArray
HMA MTF
Indicator

HMA MTF

iMAiMAOnArray

This algorithm minimizes price lag by nesting linear weighted averages to calculate a reactive, high-sensitivity trend line.

HMA-High
Indicator

HMA-High

iMAiMAOnArray

This algorithm calculates a weighted moving average of high prices using a nested linear weighting technique to reduce lag while maintaining high responsiveness.

HMA-High_v1
Indicator

HMA-High_v1

iMAiMAOnArray

This indicator calculates a weighted moving average by applying a linear weighted sequence to the difference between two high-price smoothed averages to minimize lag.

HMA-Open
Indicator

HMA-Open

iMAiMAOnArray

This indicator calculates a low-lag trend line by applying a weighted linear moving average to the variance between two nested linear moving averages of varying periods.

HMA-Open_v1
Indicator

HMA-Open_v1

iMAiMAOnArray

This indicator calculates a high-speed moving average by applying a weighted linear transformation to price openings before performing a secondary smoothing pass.

HMA
Indicator

HMA

iMAiMAOnArray

This indicator applies a dual-weighted linear moving average formula coupled with a square root period smoothing to minimize price lag while maintaining high sensitivity to momentum shifts.

HMA1
Indicator

HMA1

iMAiMAOnArray

The algorithm computes a weighted linear moving average of the difference between two multi-period linear weights to minimize lag while preserving trend integrity.

HMA1_Color
Indicator

HMA1_Color

iMAiMAOnArray

This indicator calculates a Hull Moving Average by applying a weighted linear moving average to the difference of two separate weighted averages, resulting in high-speed trend tracking with minimized lag.

HMA1_v1
Indicator

HMA1_v1

iMAiMAOnArray

This indicator calculates a reactive trend line by applying a weighted moving average to the weighted difference of two linear weighted averages of varying periods.

HMA2
Indicator

HMA2

iMAiMAOnArray

This algorithm synthesizes a responsive trend-following line by applying a weighted linear moving average to the difference between a doubled halved period and a full period linear weight.

HMA2_Color
Indicator

HMA2_Color

iMAiMAOnArray

This indicator calculates the Hull Moving Average by processing weighted linear deviations to identify trend velocity and directional pivots.

HMA3
Indicator

HMA3

iMAiMAOnArray

Calculates the Hull Moving Average (HMA) by first computing a weighted average of two moving averages and then smoothing the result with another moving average.

HMA3_Color
Indicator

HMA3_Color

iMAiMAOnArray

This indicator calculates a Hull Moving Average by processing weighted linear averages of price fluctuations to minimize lag while identifying trend reversals.