Hist_StepMA_Stoch_KV1_Ex_02
Download script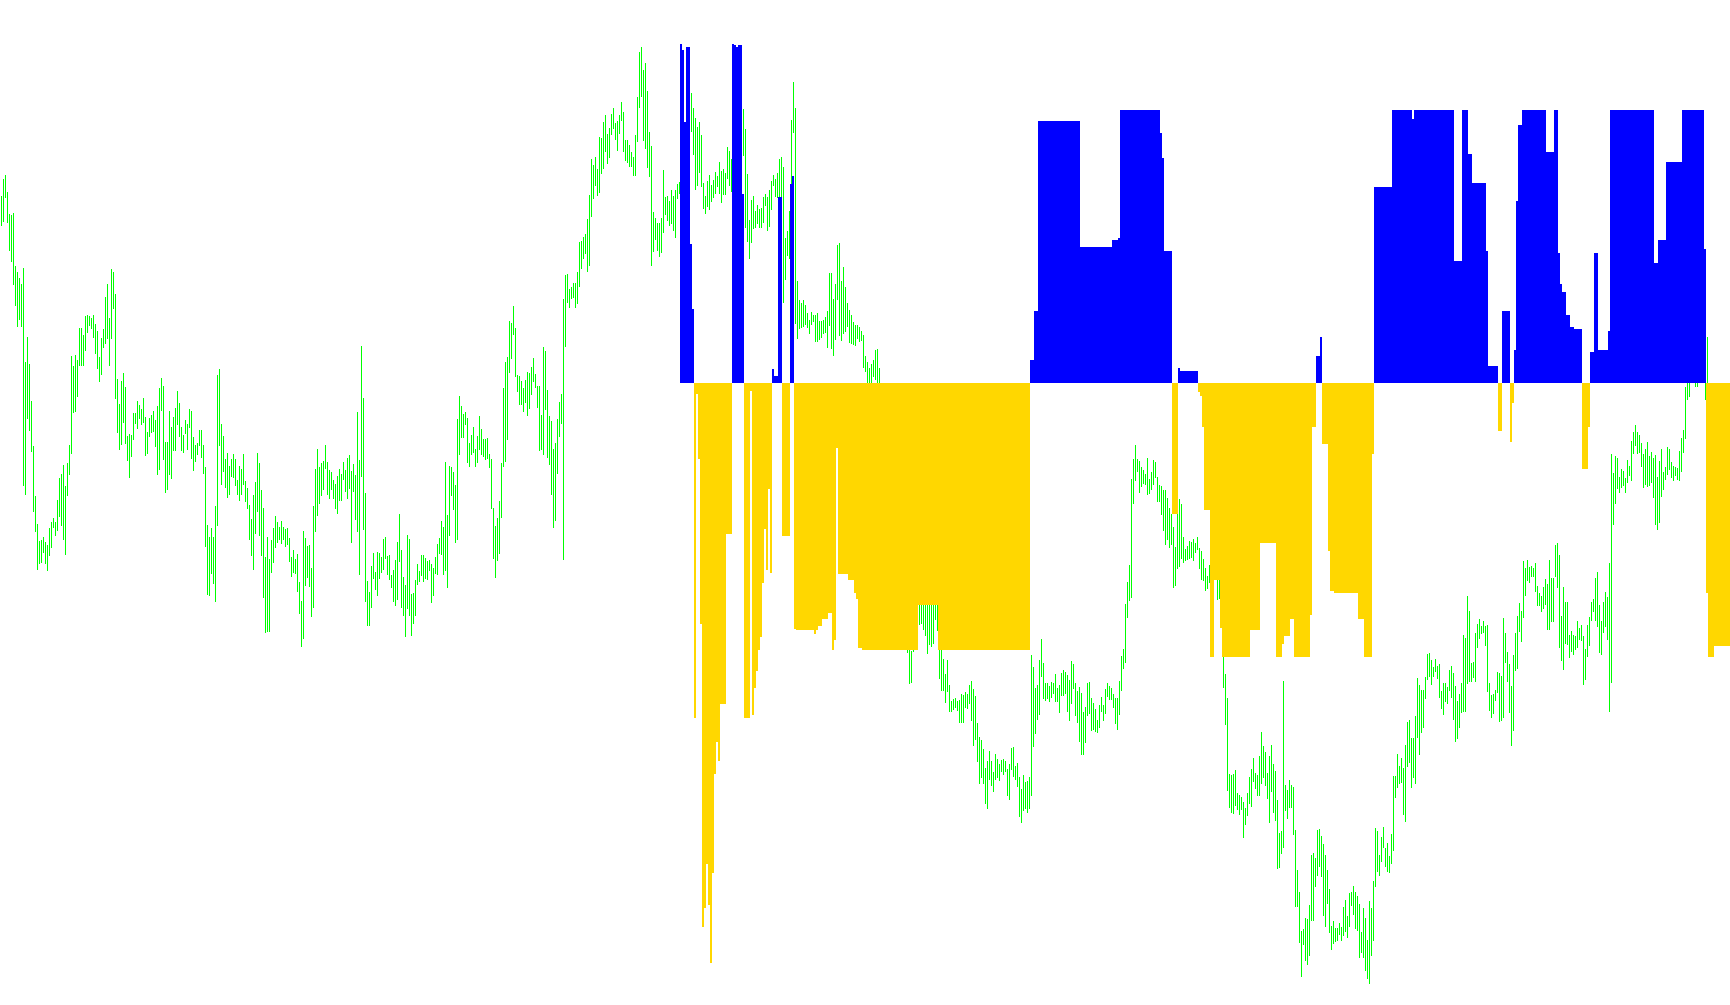
This script is a specialized technical analysis tool designed to measure market volatility and trend momentum. Rather than showing simple price movements, it translates the "noise" of the market into a visual histogram that helps identify whether a trend is strengthening or weakening relative to its recent history.
Core Logic Overview
1. Volatility Measurement (The Foundation) The script begins by calculating a customized volatility range based on a user-defined number of previous bars. It looks at the distance between the highs and lows of these bars but applies a "weighted" approach. This means that more recent price action is given more importance than older data, allowing the tool to react more quickly to sudden shifts in market environment.
2. Dynamic Step Boundaries Instead of using fixed lines to measure trends, the script calculates three different "Step Sizes" based on the maximum and minimum volatility it has seen recently. It creates three distinct categories:
- Minimum: A tight range for very stable, small movements.
- Maximum: A wide range for highly volatile, large-scale movements.
- Middle: A balanced range for standard market activity.
3. Trend Detection and Directional Memory The tool constantly checks where the current price (or closing price) sits in relation to these dynamic boundaries. It identifies whether the trend is moving upward or downward across all three categories (Minimum, Maximum, and Middle).
Crucially, the script possesses a "memory" for these trends. If a trend is currently upward, it tries to maintain that logic unless the price movement becomes significant enough to break the established boundaries. This prevents the indicator from flickering back and forth due to tiny, insignificant price fluctuations.
4. Stochastic Normalization and Visual Output The final stage of the logic converts these complex price and volatility calculations into a normalized value (a simplified scale). It specifically compares the "Minimum" trend against the "Middle" trend:
- If the Minimum trend is performing stronger than the Middle trend, it produces a positive signal.
- If the Middle trend is stronger, it produces a negative signal.
Visual Representation The result is displayed as a dual-color histogram in a separate window:
- One color represents the strength of the lower-volatility trend.
- The other color represents the strength of the average-volatility trend.
By watching how these two signals interact, a user can see at a glance whether the current market momentum is driven by steady, small movements or by more aggressive, larger price swings.
//+------------------------------------------------------------------+
//|                                             StepMA_Stoch_KV1.mq4 |
//|                           Copyright © 2005, TrendLaboratory Ltd. |
//|                                       E-mail: igorad2004@list.ru |
//|                           modified by Kalenzo -> simone@konto.pl |
//+------------------------------------------------------------------+
#property copyright "Copyright © 2005, TrendLaboratory Ltd."
#property link      "E-mail: igorad2004@list.ru"

#property indicator_separate_window
#property indicator_buffers 2
#property indicator_color1 Red
#property indicator_color2 Green

//#property indicator_minimum -1
//#property indicator_maximum 1

//---- input parameters
extern int PeriodWATR=10;
extern double Kwatr=1.0000;
extern int HighLow=0;
extern int NumberOfBarsToCalculate = 500;
//---- indicator buffers
double LineMinBuffer[];
double LineMidBuffer[];
//+------------------------------------------------------------------+
//| Custom indicator initialization function                         |
//+------------------------------------------------------------------+
  int init()
  {
 Comment("");
//---- indicator line
   SetIndexStyle(0,DRAW_HISTOGRAM,STYLE_SOLID,2);
   SetIndexStyle(1,DRAW_HISTOGRAM,STYLE_SOLID,2);
   SetIndexBuffer(0,LineMinBuffer);
   SetIndexBuffer(1,LineMidBuffer);
   IndicatorDigits(MarketInfo(Symbol(),MODE_DIGITS));
//---- name for DataWindow and indicator subwindow label
   //short_name="StepMA Stoch("+PeriodWATR+","+Kwatr+","+HighLow+")";
   SetIndexLabel(0,"StepMA Stoch 1");
   SetIndexLabel(1,"StepMA Stoch 2");
//----
   SetIndexDrawBegin(0,PeriodWATR);
   SetIndexDrawBegin(1,PeriodWATR);
   ArrayInitialize(LineMinBuffer,0);
   ArrayInitialize(LineMidBuffer,0);
   SetIndexEmptyValue(0,0);
   SetIndexEmptyValue(1,0);
//----
   return(0);
  }

//+------------------------------------------------------------------+
//| StepMA_3D_v1                                                         |
//+------------------------------------------------------------------+
int start()
  {
      string short_name;
      short_name = "Max bars to count: |"+(Bars-1)+"| ";
      IndicatorShortName(short_name);

   int      i,shift,TrendMin,TrendMax,TrendMid;
   double   SminMin0,SmaxMin0,SminMin1,SmaxMin1,SumRange,dK,WATR0,WATRmax,WATRmin,WATRmid;
   double   SminMax0,SmaxMax0,SminMax1,SmaxMax1,SminMid0,SmaxMid0,SminMid1,SmaxMid1;
   double   linemin,linemax,linemid,Stoch1,Stoch2,bsmin,bsmax;

   double prev_y = 0,prev_b = 0;

   for(shift=NumberOfBarsToCalculate-1;shift>=0;shift--)
   {
	SumRange=0;
	for (i=PeriodWATR-1;i>=0;i--)
	    {
       dK = 1+1.0*(PeriodWATR-i)/PeriodWATR;
       SumRange+= dK*MathAbs(High[i+shift]-Low[i+shift]);
       }
	WATR0 = SumRange/PeriodWATR;

	WATRmax=MathMax(WATR0,WATRmax);
	if (shift==NumberOfBarsToCalculate-1-PeriodWATR) WATRmin=WATR0;
	WATRmin=MathMin(WATR0,WATRmin);

	int StepSizeMin=MathRound(Kwatr*WATRmin/Point);
	int StepSizeMax=MathRound(Kwatr*WATRmax/Point);
	int StepSizeMid=MathRound(Kwatr*0.5*(WATRmax+WATRmin)/Point);

	if (HighLow>0)
	  {
	  SmaxMin0=Low[shift]+2*StepSizeMin*Point;
	  SminMin0=High[shift]-2*StepSizeMin*Point;

	  SmaxMax0=Low[shift]+2*StepSizeMax*Point;
	  SminMax0=High[shift]-2*StepSizeMax*Point;

	  SmaxMid0=Low[shift]+2*StepSizeMid*Point;
	  SminMid0=High[shift]-2*StepSizeMid*Point;

	  if(Close[shift]>SmaxMin1) TrendMin=1;
	  if(Close[shift]<SminMin1) TrendMin=-1;

	  if(Close[shift]>SmaxMax1) TrendMax=1;
	  if(Close[shift]<SminMax1) TrendMax=-1;

	  if(Close[shift]>SmaxMid1) TrendMid=1;
	  if(Close[shift]<SminMid1) TrendMid=-1;
	  }

	if (HighLow == 0)
	  {
	  SmaxMin0=Close[shift]+2*StepSizeMin*Point;
	  SminMin0=Close[shift]-2*StepSizeMin*Point;

	  SmaxMax0=Close[shift]+2*StepSizeMax*Point;
	  SminMax0=Close[shift]-2*StepSizeMax*Point;

	  SmaxMid0=Close[shift]+2*StepSizeMid*Point;
	  SminMid0=Close[shift]-2*StepSizeMid*Point;

	  if(Close[shift]>SmaxMin1) TrendMin=1;
	  if(Close[shift]<SminMin1) TrendMin=-1;

	  if(Close[shift]>SmaxMax1) TrendMax=1;
	  if(Close[shift]<SminMax1) TrendMax=-1;

	  if(Close[shift]>SmaxMid1) TrendMid=1;
	  if(Close[shift]<SminMid1) TrendMid=-1;
	  }

	  if(TrendMin>0 && SminMin0<SminMin1) SminMin0=SminMin1;
	  if(TrendMin<0 && SmaxMin0>SmaxMin1) SmaxMin0=SmaxMin1;

	  if(TrendMax>0 && SminMax0<SminMax1) SminMax0=SminMax1;
	  if(TrendMax<0 && SmaxMax0>SmaxMax1) SmaxMax0=SmaxMax1;

	  if(TrendMid>0 && SminMid0<SminMid1) SminMid0=SminMid1;
	  if(TrendMid<0 && SmaxMid0>SmaxMid1) SmaxMid0=SmaxMid1;


	  if (TrendMin>0) linemin=SminMin0+StepSizeMin*Point;
	  if (TrendMin<0) linemin=SmaxMin0-StepSizeMin*Point;

	  if (TrendMax>0) linemax=SminMax0+StepSizeMax*Point;
	  if (TrendMax<0) linemax=SmaxMax0-StepSizeMax*Point;

	  if (TrendMid>0) linemid=SminMid0+StepSizeMid*Point;
	  if (TrendMid<0) linemid=SmaxMid0-StepSizeMid*Point;

	  bsmin=linemax-StepSizeMax*Point;
	  bsmax=linemax+StepSizeMax*Point;
	  Stoch1=NormalizeDouble((linemin-bsmin)/(bsmax-bsmin),6);
	  Stoch2=NormalizeDouble((linemid-bsmin)/(bsmax-bsmin),6);
	  prev_y = (Stoch1 - Stoch2);
	  if(prev_y<0.0){
	     LineMinBuffer[shift] = prev_y;
	     LineMidBuffer[shift] = 0;
	     }
	  else if(prev_y>0.0){
	     LineMidBuffer[shift] = prev_y;
	     LineMinBuffer[shift] = 0;
	     }

	  //prev_y = Stoch1;
	  //prev_b = Stoch2;


	  SminMin1=SminMin0;
	  SmaxMin1=SmaxMin0;

	  SminMax1=SminMax0;
	  SmaxMax1=SmaxMax0;

	  SminMid1=SminMid0;
	  SmaxMid1=SmaxMid0;
	 }
	return(0);
 }
Comments