Hist_StepMA_Stoch_KV1_Ex_02_v3
Download script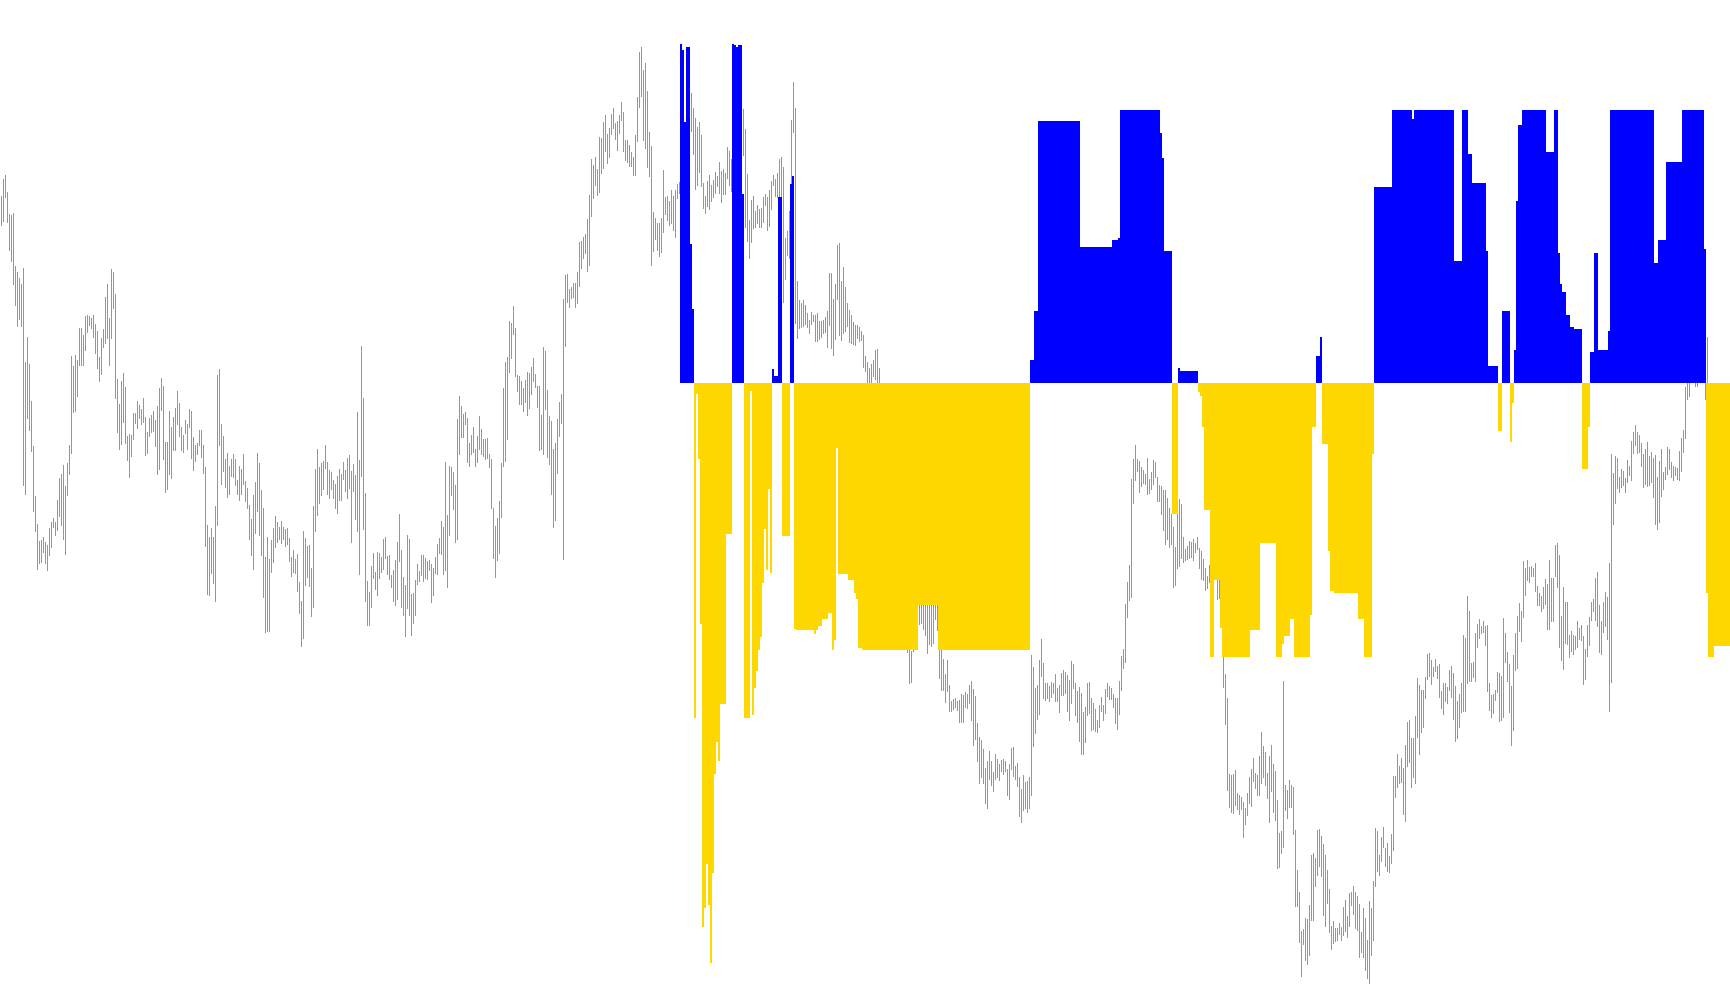
This script is a technical analysis tool designed to help traders visualize market trends and momentum by identifying price "steps." Instead of following every minor fluctuation in the market, the logic focuses on significant movements by establishing boundaries based on historical volatility.
Here is a breakdown of how the logic functions:
1. Measuring Market Volatility
The script begins by analyzing a specific window of recent price action (the "WATR" period). It calculates the range between the highest and lowest prices during this time, giving more weight to more recent data. This helps the tool understand the current "breathing room" of the market—essentially determining how much the price typically moves in the current environment.
2. Establishing Dynamic Boundaries
Based on the volatility calculated above, the script creates three different levels of sensitivity:
- Minimum: A tight range for identifying small, immediate shifts.
- Maximum: A wide range to capture major, long-term trends.
- Middle: A balanced range that sits between the two.
By using these dynamic boundaries rather than fixed numbers, the tool automatically adjusts itself. If the market becomes very calm, the boundaries tighten; if the market becomes highly volatile, the boundaries expand.
3. Identifying Trend Directions
The script tracks the current price and compares it against these three sets of boundaries. It looks for "breakouts"—moments where the price pushes past a boundary to signal a change in direction.
- It identifies whether the trend is currently moving up or down for each of the three levels (Min, Mid, and Max).
- It carries over the previous state to ensure that the trend only changes when the price decisively breaks through a significant threshold, filtering out "market noise."
4. Converting Trends into Visual Momentum
Once the direction of these three trends is established, the script converts them into numerical values (similar to a Stochastic Oscillator).
- It compares the position of the "Minimum" trend against the "Maximum" trend and the "Middle" trend.
- The final output is displayed as a histogram in a separate window.
5. Visual Representation
The final result is a visual indicator where:
- One color represents the strength of the primary movement (the difference between the smallest and largest trends).
- The other color captures the intermediate trend data.
By looking at this, a trader can see at a glance whether the current market momentum is leaning toward an aggressive move (Max), a steady climb/fall (Mid), or a minor correction (Min). It essentially simplifies complex price movements into a clear visual of "step-like" progress.
//+------------------------------------------------------------------+
//|                                             StepMA_Stoch_KV1.mq4 |
//|                           Copyright © 2005, TrendLaboratory Ltd. |
//|                                       E-mail: igorad2004@list.ru |
//|                           modified by Kalenzo -> simone@konto.pl |
//+------------------------------------------------------------------+
#property copyright "Copyright © 2005, TrendLaboratory Ltd."
#property link      "E-mail: igorad2004@list.ru"
//----
#property indicator_separate_window
#property indicator_buffers 2
#property indicator_color1 Red
#property indicator_color2 Green
//---- input parameters
extern int PeriodWATR=10;
extern double Kwatr=1.0000;
extern int HighLow=0;
extern int NumberOfBarsToCalculate=500;
//---- indicator buffers
double LineMinBuffer[];
double LineMidBuffer[];
//+------------------------------------------------------------------+
//| Custom indicator initialization function                         |
//+------------------------------------------------------------------+
  int init()
  {
   Comment("");
//---- indicator line
   SetIndexStyle(0,DRAW_HISTOGRAM,STYLE_SOLID,2);
   SetIndexStyle(1,DRAW_HISTOGRAM,STYLE_SOLID,2);
   SetIndexBuffer(0,LineMinBuffer);
   SetIndexBuffer(1,LineMidBuffer);
   IndicatorDigits(MarketInfo(Symbol(),MODE_DIGITS));
//---- name for DataWindow and indicator subwindow label
   //short_name="StepMA Stoch("+PeriodWATR+","+Kwatr+","+HighLow+")";
   SetIndexLabel(0,"StepMA Stoch 1");
   SetIndexLabel(1,"StepMA Stoch 2");
//----
   SetIndexDrawBegin(0,PeriodWATR);
   SetIndexDrawBegin(1,PeriodWATR);
   ArrayInitialize(LineMinBuffer,0);
   ArrayInitialize(LineMidBuffer,0);
   SetIndexEmptyValue(0,0);
   SetIndexEmptyValue(1,0);
//----
   return(0);
  }
//+------------------------------------------------------------------+
//| StepMA_3D_v1                                                     |
//+------------------------------------------------------------------+
int start()
  {
   string short_name;
   short_name="Max bars to count: |"+(Bars-1)+"| ";
   IndicatorShortName(short_name);
//----
   int      i,shift,TrendMin,TrendMax,TrendMid;
   double   SminMin0,SmaxMin0,SminMin1,SmaxMin1,SumRange,dK,WATR0,WATRmax,WATRmin,WATRmid;
   double   SminMax0,SmaxMax0,SminMax1,SmaxMax1,SminMid0,SmaxMid0,SminMid1,SmaxMid1;
   double   linemin,linemax,linemid,Stoch1,Stoch2,bsmin,bsmax;
   double prev_y=0,prev_b=0;
//----
   for(shift=NumberOfBarsToCalculate-1;shift>=0;shift--)
     {
      SumRange=0;
      for(i=PeriodWATR-1;i>=0;i--)
        {
         dK=1+1.0*(PeriodWATR-i)/PeriodWATR;
         SumRange+= dK*MathAbs(High[i+shift]-Low[i+shift]);
        }
      WATR0=SumRange/PeriodWATR;
//----
      WATRmax=MathMax(WATR0,WATRmax);
      if (shift==NumberOfBarsToCalculate-1-PeriodWATR) WATRmin=WATR0;
      WATRmin=MathMin(WATR0,WATRmin);
//----
      int StepSizeMin=MathRound(Kwatr*WATRmin/Point);
      int StepSizeMax=MathRound(Kwatr*WATRmax/Point);
      int StepSizeMid=MathRound(Kwatr*0.5*(WATRmax+WATRmin)/Point);
//----
      if (HighLow>0)
        {
         SmaxMin0=Low[shift]+2*StepSizeMin*Point;
         SminMin0=High[shift]-2*StepSizeMin*Point;
         SmaxMax0=Low[shift]+2*StepSizeMax*Point;
         SminMax0=High[shift]-2*StepSizeMax*Point;
         SmaxMid0=Low[shift]+2*StepSizeMid*Point;
         SminMid0=High[shift]-2*StepSizeMid*Point;
//----
         if(Close[shift]>SmaxMin1) TrendMin=1;
         if(Close[shift]<SminMin1) TrendMin=-1;
         if(Close[shift]>SmaxMax1) TrendMax=1;
         if(Close[shift]<SminMax1) TrendMax=-1;
         if(Close[shift]>SmaxMid1) TrendMid=1;
         if(Close[shift]<SminMid1) TrendMid=-1;
        }
      if (HighLow==0)
        {
         SmaxMin0=Close[shift]+2*StepSizeMin*Point;
         SminMin0=Close[shift]-2*StepSizeMin*Point;
         SmaxMax0=Close[shift]+2*StepSizeMax*Point;
         SminMax0=Close[shift]-2*StepSizeMax*Point;
         SmaxMid0=Close[shift]+2*StepSizeMid*Point;
         SminMid0=Close[shift]-2*StepSizeMid*Point;
//----
         if(Close[shift]>SmaxMin1) TrendMin=1;
         if(Close[shift]<SminMin1) TrendMin=-1;
         if(Close[shift]>SmaxMax1) TrendMax=1;
         if(Close[shift]<SminMax1) TrendMax=-1;
         if(Close[shift]>SmaxMid1) TrendMid=1;
         if(Close[shift]<SminMid1) TrendMid=-1;
        }
      if(TrendMin>0 && SminMin0<SminMin1) SminMin0=SminMin1;
      if(TrendMin<0 && SmaxMin0>SmaxMin1) SmaxMin0=SmaxMin1;
      if(TrendMax>0 && SminMax0<SminMax1) SminMax0=SminMax1;
      if(TrendMax<0 && SmaxMax0>SmaxMax1) SmaxMax0=SmaxMax1;
      if(TrendMid>0 && SminMid0<SminMid1) SminMid0=SminMid1;
      if(TrendMid<0 && SmaxMid0>SmaxMid1) SmaxMid0=SmaxMid1;
      if (TrendMin>0) linemin=SminMin0+StepSizeMin*Point;
      if (TrendMin<0) linemin=SmaxMin0-StepSizeMin*Point;
      if (TrendMax>0) linemax=SminMax0+StepSizeMax*Point;
      if (TrendMax<0) linemax=SmaxMax0-StepSizeMax*Point;
      if (TrendMid>0) linemid=SminMid0+StepSizeMid*Point;
      if (TrendMid<0) linemid=SmaxMid0-StepSizeMid*Point;
//----
      bsmin=linemax-StepSizeMax*Point;
      bsmax=linemax+StepSizeMax*Point;
      Stoch1=NormalizeDouble((linemin-bsmin)/(bsmax-bsmin),6);
      Stoch2=NormalizeDouble((linemid-bsmin)/(bsmax-bsmin),6);
      prev_y=(Stoch1 - Stoch2);
        if(prev_y<0.0)
        {
         LineMinBuffer[shift]=prev_y;
         LineMidBuffer[shift]=0;
        }
        else if(prev_y>0.0)
        {
            LineMidBuffer[shift]=prev_y;
            LineMinBuffer[shift]=0;
           }
      //prev_y = Stoch1;
      //prev_b = Stoch2;
      SminMin1=SminMin0;
      SmaxMin1=SmaxMin0;
      SminMax1=SminMax0;
      SmaxMax1=SmaxMax0;
      SminMid1=SminMid0;
      SmaxMid1=SmaxMid0;
     }
   return(0);
  }
//+------------------------------------------------------------------+
Comments