Hist_StepMA_Stoch_KV1_Ex_02_v1
Download script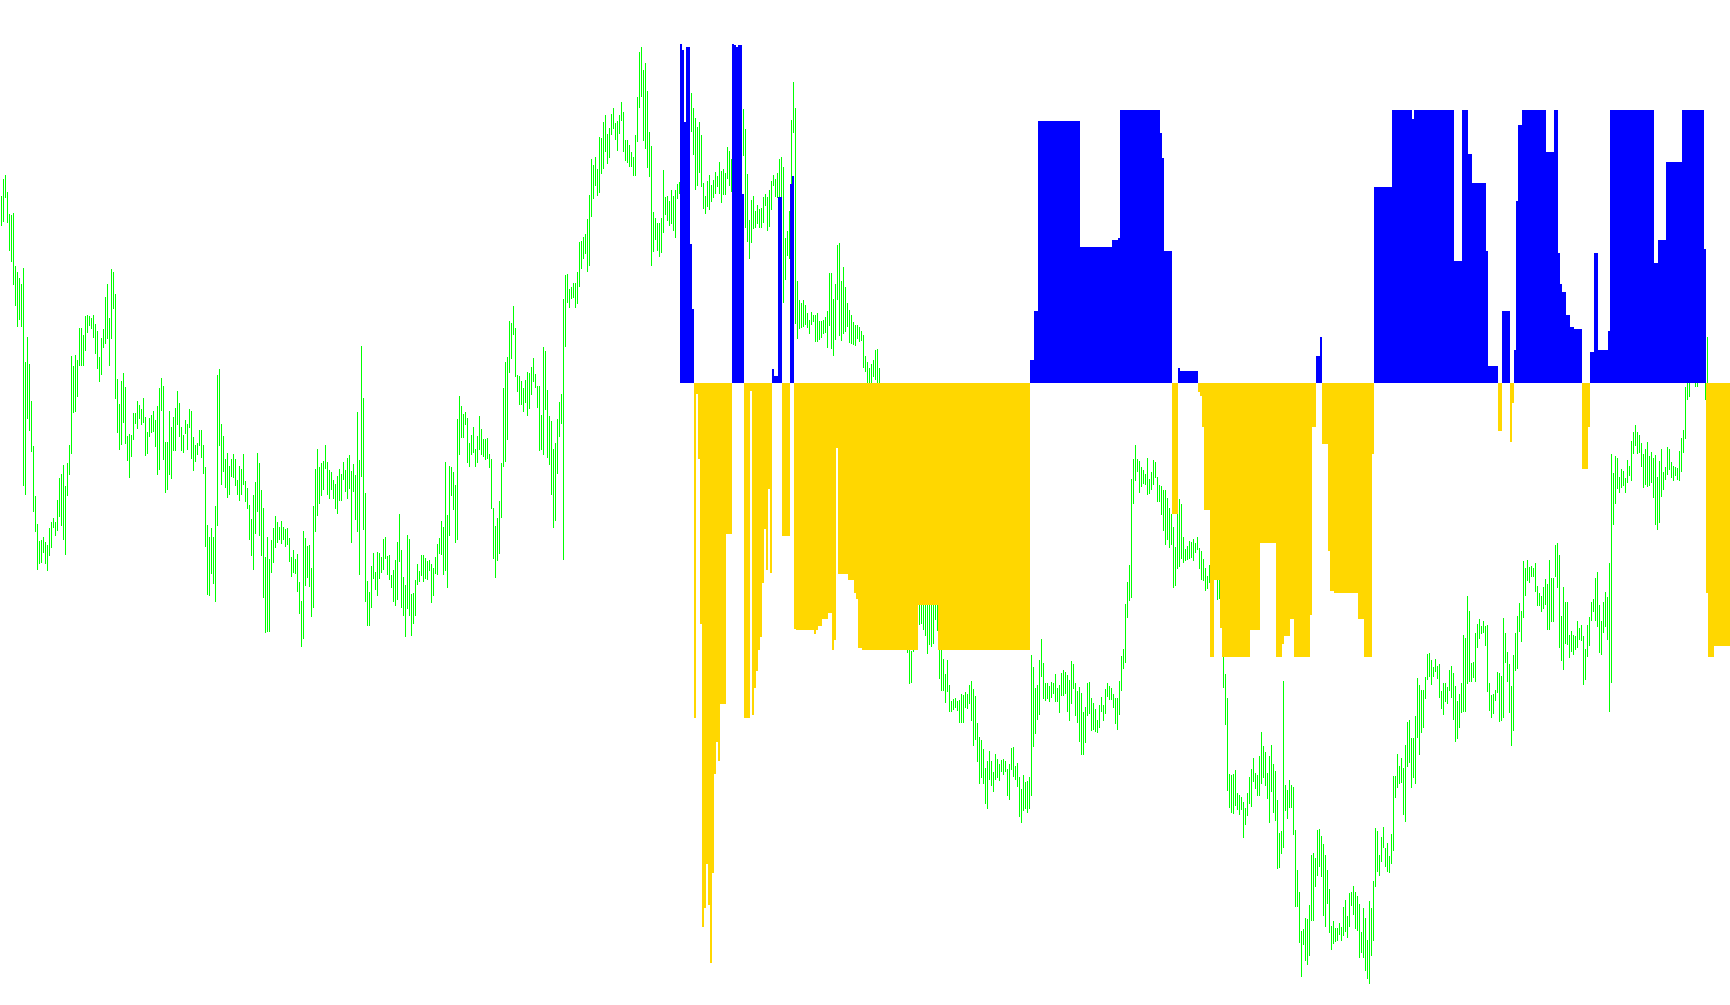
This script is a specialized technical analysis tool designed to identify price trends and momentum by creating a visual "staircase" effect on a chart. It works by calculating volatility, establishing dynamic boundaries for price movement, and converting these movements into a normalized histogram.
Here is a breakdown of the logic used by the script:
1. Volatility Measurement
The tool starts by analyzing a specific look-back period (defined by the user) to determine the market's current "noise" or volatility. It calculates a weighted average of price ranges. By tracking the highest and lowest volatility levels over time, the script creates three distinct "Step Sizes":
- Minimum Step: Based on the lowest recent volatility.
- Maximum Step: Based on the highest recent volatility.
- Mid Step: An average between the two extremes.
2. Dynamic Trend Identification
The script evaluates the current price relative to these calculated steps. It creates three different "zones" of potential movement:
- Conservative Zone: Uses the smallest step size for tight trend tracking.
- Aggressive Zone: Uses the largest step size to capture broader market moves.
- Balanced Zone: Uses the middle step size.
Based on whether the price closes above or below these calculated boundaries, the script assigns a "Trend" direction (Up or Down) for each of the three zones.
3. Step Logic and Momentum Calculation
Unlike standard moving averages that flow smoothly, this logic "locks" onto specific levels. If a trend is identified as upward, it identifies the lowest point the price can "step" to; if downward, it identifies the highest point. It then calculates a specific coordinate for each zone based on these steps.
To turn this into a readable indicator, the script performs a Stochastic Normalization:
- It takes the coordinates from the Conservative and Balanced zones.
- It compares them against the Aggressive Zone to calculate a percentage-based value (a "Stochastic" calculation).
- This converts raw price data into a relative value, making it easier to see the strength of the trend regardless of the actual price of the asset.
4. Visual Output
The final output is displayed as two separate histograms:
- Green/Red Differentiation: The script compares the Conservative trend against the Balanced trend.
- If the Conservative trend is stronger (more aggressive in its movement), it displays on one buffer.
- If the Balanced trend is stronger, it displays on the other.
Essentially, this allows a trader to see not just if the price is moving, but which "intensity" of the current market volatility is currently dominating the price action.
/*-----------------------------+
|			       |
| Shared by www.Aptrafx.com    |
|			       |
+------------------------------*/

//+------------------------------------------------------------------+
//|                                             StepMA_Stoch_KV1.mq4 |
//|                           Copyright © 2005, TrendLaboratory Ltd. |
//|                                       E-mail: igorad2004@list.ru |
//|                           modified by Kalenzo -> simone@konto.pl |
//+------------------------------------------------------------------+
#property copyright "Copyright © 2005, TrendLaboratory Ltd."
#property link      "E-mail: igorad2004@list.ru"

#property indicator_separate_window
#property indicator_buffers 2
#property indicator_color1 Red
#property indicator_color2 Green

//#property indicator_minimum -1
//#property indicator_maximum 1

//---- input parameters
extern int PeriodWATR=10;
extern double Kwatr=1.0000;
extern int HighLow=0;
extern int NumberOfBarsToCalculate = 500;
//---- indicator buffers
double LineMinBuffer[];
double LineMidBuffer[];
//+------------------------------------------------------------------+
//| Custom indicator initialization function                         |
//+------------------------------------------------------------------+
  int init()
  {
 Comment("");
//---- indicator line
   SetIndexStyle(0,DRAW_HISTOGRAM,STYLE_SOLID,2);
   SetIndexStyle(1,DRAW_HISTOGRAM,STYLE_SOLID,2);
   SetIndexBuffer(0,LineMinBuffer);
   SetIndexBuffer(1,LineMidBuffer);
   IndicatorDigits(MarketInfo(Symbol(),MODE_DIGITS));
//---- name for DataWindow and indicator subwindow label
   //short_name="StepMA Stoch("+PeriodWATR+","+Kwatr+","+HighLow+")";
   SetIndexLabel(0,"StepMA Stoch 1");
   SetIndexLabel(1,"StepMA Stoch 2");
//----
   SetIndexDrawBegin(0,PeriodWATR);
   SetIndexDrawBegin(1,PeriodWATR);
   ArrayInitialize(LineMinBuffer,0);
   ArrayInitialize(LineMidBuffer,0);
   SetIndexEmptyValue(0,0);
   SetIndexEmptyValue(1,0);
//----
   return(0);
  }

//+------------------------------------------------------------------+
//| StepMA_3D_v1                                                         |
//+------------------------------------------------------------------+
int start()
  {
      string short_name;
      short_name = "Max bars to count: |"+(Bars-1)+"| ";
      IndicatorShortName(short_name);

   int      i,shift,TrendMin,TrendMax,TrendMid;
   double   SminMin0,SmaxMin0,SminMin1,SmaxMin1,SumRange,dK,WATR0,WATRmax,WATRmin,WATRmid;
   double   SminMax0,SmaxMax0,SminMax1,SmaxMax1,SminMid0,SmaxMid0,SminMid1,SmaxMid1;
   double   linemin,linemax,linemid,Stoch1,Stoch2,bsmin,bsmax;

   double prev_y = 0,prev_b = 0;

   for(shift=NumberOfBarsToCalculate-1;shift>=0;shift--)
   {
	SumRange=0;
	for (i=PeriodWATR-1;i>=0;i--)
	    {
       dK = 1+1.0*(PeriodWATR-i)/PeriodWATR;
       SumRange+= dK*MathAbs(High[i+shift]-Low[i+shift]);
       }
	WATR0 = SumRange/PeriodWATR;

	WATRmax=MathMax(WATR0,WATRmax);
	if (shift==NumberOfBarsToCalculate-1-PeriodWATR) WATRmin=WATR0;
	WATRmin=MathMin(WATR0,WATRmin);

	int StepSizeMin=MathRound(Kwatr*WATRmin/Point);
	int StepSizeMax=MathRound(Kwatr*WATRmax/Point);
	int StepSizeMid=MathRound(Kwatr*0.5*(WATRmax+WATRmin)/Point);

	if (HighLow>0)
	  {
	  SmaxMin0=Low[shift]+2*StepSizeMin*Point;
	  SminMin0=High[shift]-2*StepSizeMin*Point;

	  SmaxMax0=Low[shift]+2*StepSizeMax*Point;
	  SminMax0=High[shift]-2*StepSizeMax*Point;

	  SmaxMid0=Low[shift]+2*StepSizeMid*Point;
	  SminMid0=High[shift]-2*StepSizeMid*Point;

	  if(Close[shift]>SmaxMin1) TrendMin=1;
	  if(Close[shift]<SminMin1) TrendMin=-1;

	  if(Close[shift]>SmaxMax1) TrendMax=1;
	  if(Close[shift]<SminMax1) TrendMax=-1;

	  if(Close[shift]>SmaxMid1) TrendMid=1;
	  if(Close[shift]<SminMid1) TrendMid=-1;
	  }

	if (HighLow == 0)
	  {
	  SmaxMin0=Close[shift]+2*StepSizeMin*Point;
	  SminMin0=Close[shift]-2*StepSizeMin*Point;

	  SmaxMax0=Close[shift]+2*StepSizeMax*Point;
	  SminMax0=Close[shift]-2*StepSizeMax*Point;

	  SmaxMid0=Close[shift]+2*StepSizeMid*Point;
	  SminMid0=Close[shift]-2*StepSizeMid*Point;

	  if(Close[shift]>SmaxMin1) TrendMin=1;
	  if(Close[shift]<SminMin1) TrendMin=-1;

	  if(Close[shift]>SmaxMax1) TrendMax=1;
	  if(Close[shift]<SminMax1) TrendMax=-1;

	  if(Close[shift]>SmaxMid1) TrendMid=1;
	  if(Close[shift]<SminMid1) TrendMid=-1;
	  }

	  if(TrendMin>0 && SminMin0<SminMin1) SminMin0=SminMin1;
	  if(TrendMin<0 && SmaxMin0>SmaxMin1) SmaxMin0=SmaxMin1;

	  if(TrendMax>0 && SminMax0<SminMax1) SminMax0=SminMax1;
	  if(TrendMax<0 && SmaxMax0>SmaxMax1) SmaxMax0=SmaxMax1;

	  if(TrendMid>0 && SminMid0<SminMid1) SminMid0=SminMid1;
	  if(TrendMid<0 && SmaxMid0>SmaxMid1) SmaxMid0=SmaxMid1;


	  if (TrendMin>0) linemin=SminMin0+StepSizeMin*Point;
	  if (TrendMin<0) linemin=SmaxMin0-StepSizeMin*Point;

	  if (TrendMax>0) linemax=SminMax0+StepSizeMax*Point;
	  if (TrendMax<0) linemax=SmaxMax0-StepSizeMax*Point;

	  if (TrendMid>0) linemid=SminMid0+StepSizeMid*Point;
	  if (TrendMid<0) linemid=SmaxMid0-StepSizeMid*Point;

	  bsmin=linemax-StepSizeMax*Point;
	  bsmax=linemax+StepSizeMax*Point;
	  Stoch1=NormalizeDouble((linemin-bsmin)/(bsmax-bsmin),6);
	  Stoch2=NormalizeDouble((linemid-bsmin)/(bsmax-bsmin),6);
	  prev_y = (Stoch1 - Stoch2);
	  if(prev_y<0.0){
	     LineMinBuffer[shift] = prev_y;
	     LineMidBuffer[shift] = 0;
	     }
	  else if(prev_y>0.0){
	     LineMidBuffer[shift] = prev_y;
	     LineMinBuffer[shift] = 0;
	     }

	  //prev_y = Stoch1;
	  //prev_b = Stoch2;


	  SminMin1=SminMin0;
	  SmaxMin1=SmaxMin0;

	  SminMax1=SminMax0;
	  SmaxMax1=SmaxMax0;

	  SminMid1=SminMid0;
	  SmaxMid1=SmaxMid0;
	 }
	return(0);
 }
Comments