Hist_StepMA_Stoch_KV1_Ex_03-All-bars
Download script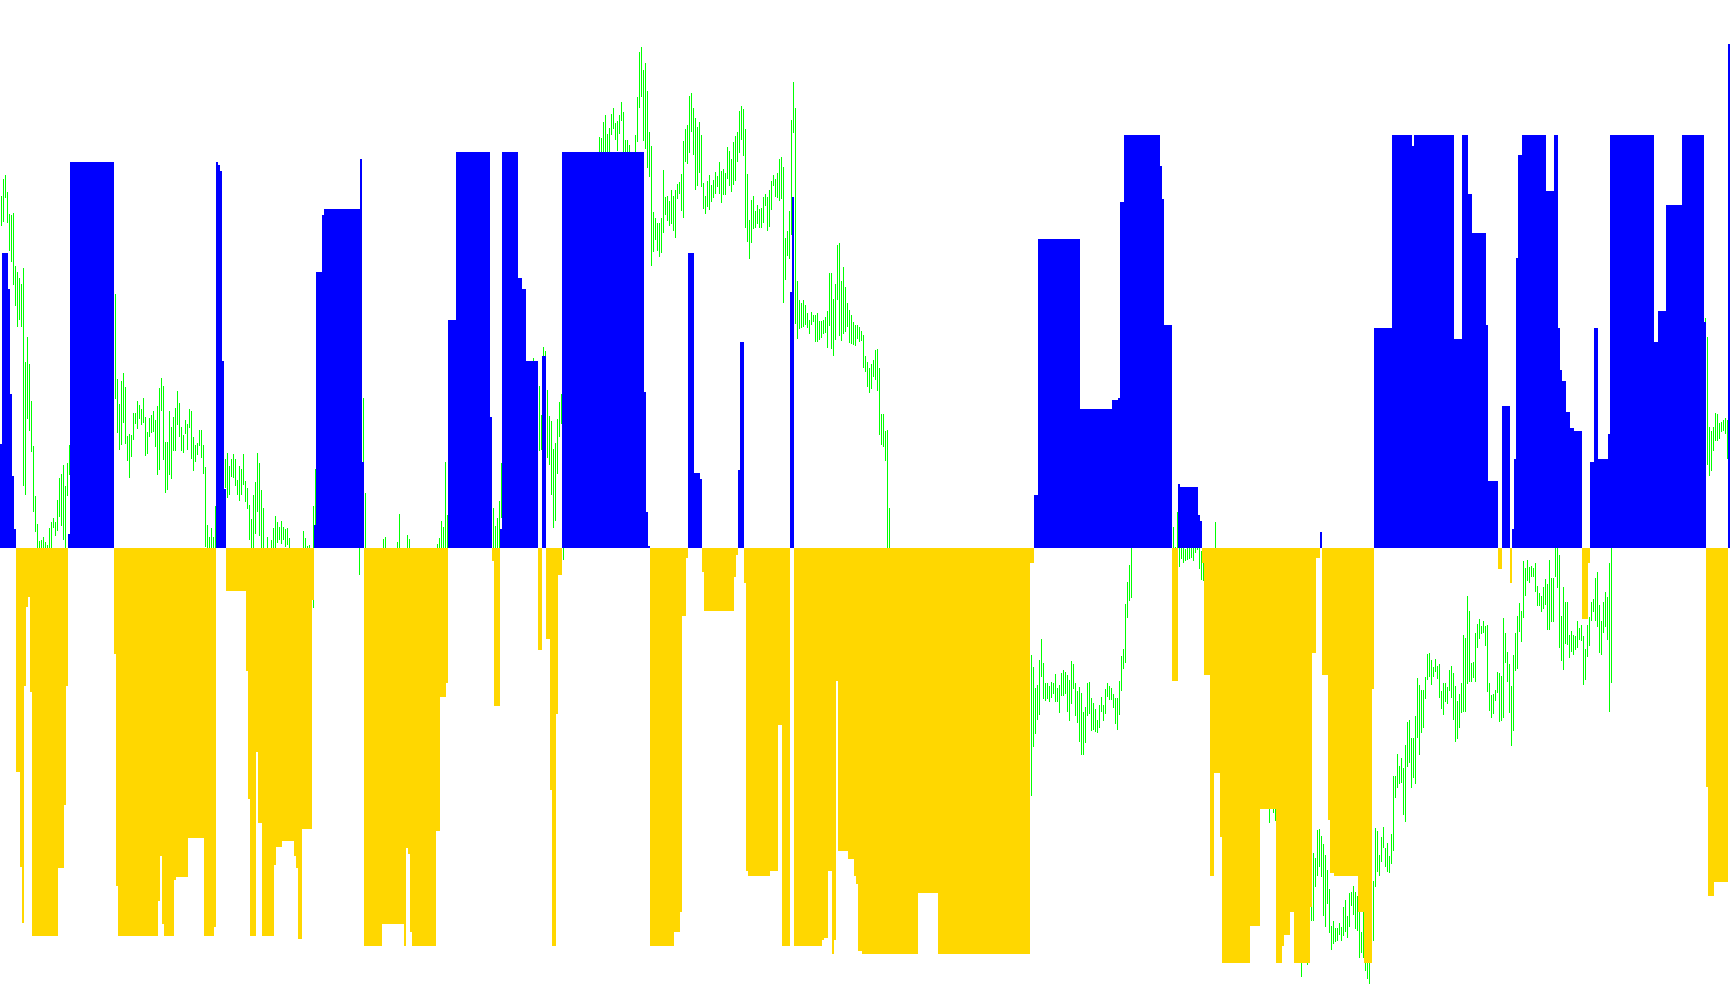
This script functions as a specialized technical analysis tool designed to visualize market trends by calculating "Step" values based on price volatility. Instead of showing traditional price movements, it identifies specific boundaries and levels to help traders understand the current momentum and direction of the market.
Core Logic Overview
The tool operates by analyzing price data over a specific window of time to determine the prevailing "range" or "volatility." It then establishes three different types of boundary levels based on this range: Minimum, Maximum, and Midpoint.
1. Volatility Assessment The script first calculates a weighted average of the price ranges (the difference between high and low prices) over a user-defined period. This allows the tool to understand how much the market is moving at any given moment. It identifies the highest and lowest volatility points within that timeframe to set the "scale" for its calculations.
2. Dynamic Boundary Creation Based on the volatility identified above, the script establishes three distinct sets of boundaries:
- Minimum Level: A tighter range representing small movements.
- Maximum Level: A wider range representing larger price swings.
- Midpoint Level: A balanced range sitting between the two.
The logic then checks the current closing price against these boundaries to determine the "Trend." If the price breaks above or below a specific boundary, the script updates the trend direction for that level.
3. Trend Persistence and Calculation A key feature of this logic is its "memory." It ensures that once a trend is established, the boundaries do not move backwards in a way that contradicts the current trend. This creates a "stepping" effect where the boundaries only shift forward or stay firm, providing a clearer visual of market progression.
4. Stochastic Normalization Once the final "Step" positions for the Minimum and Midpoint levels are calculated, the script converts these physical price values into a normalized ratio (a percentage-like value). This allows it to compare different types of movements on a single unified scale.
Visual Representation
The final output is displayed as two histograms in a separate window:
- Relative Strength: The script compares the "Minimum" trend against the "Midpoint" trend.
- Directional Color Coding:
- If the Minimum trend is stronger than the Midpoint trend, it highlights a specific value (often associated with one color/direction).
- If the Midpoint trend is stronger, it highlights the opposite (often associated with another color/direction).
In essence, this tool filters out "market noise" by focusing on significant structural steps in price movement rather than every minor tick, helping users see the underlying trend of the market's momentum.
//+------------------------------------------------------------------+
//|                                             StepMA_Stoch_KV1.mq4 |
//|                           Copyright © 2005, TrendLaboratory Ltd. |
//|                                       E-mail: igorad2004@list.ru |
//|                           modified by Kalenzo -> simone@konto.pl |
//|                           modified by raduga  21.04.2006         |
//+------------------------------------------------------------------+
#property copyright "Copyright © 2005, TrendLaboratory Ltd."
#property link      "E-mail: igorad2004@list.ru"

#property indicator_separate_window
#property indicator_buffers 2
#property indicator_color1 Red
#property indicator_color2 Green

//#property indicator_minimum -1
//#property indicator_maximum 1

//---- input parameters
extern int PeriodWATR=10;
extern double Kwatr=1.0000;
extern int HighLow=0;
// extern int NumberOfBarsToCalculate = Bars;
//---- indicator buffers
double LineMinBuffer[];
double LineMidBuffer[];
//+------------------------------------------------------------------+
//| Custom indicator initialization function                         |
//+------------------------------------------------------------------+
  int init()
  {
 Comment("");
//---- indicator line
   SetIndexStyle(0,DRAW_HISTOGRAM,STYLE_SOLID,2);
   SetIndexStyle(1,DRAW_HISTOGRAM,STYLE_SOLID,2);
   SetIndexBuffer(0,LineMinBuffer);
   SetIndexBuffer(1,LineMidBuffer);
   IndicatorDigits(MarketInfo(Symbol(),MODE_DIGITS));
//---- name for DataWindow and indicator subwindow label
   //short_name="StepMA Stoch("+PeriodWATR+","+Kwatr+","+HighLow+")";

   SetIndexLabel(0,"StepMA Stoch 1");
   SetIndexLabel(1,"StepMA Stoch 2");
//----
   SetIndexDrawBegin(0,PeriodWATR);
   SetIndexDrawBegin(1,PeriodWATR);
   /**
   *raduga:
   *USELESS !!!! Throws "ArrayInitialization" Exception !!!!
   **/
   //======================================================
   //ArrayInitialize(LineMinBuffer,0);
   //ArrayInitialize(LineMidBuffer,0);
   SetIndexEmptyValue(0,0.0);
   SetIndexEmptyValue(1,0.0);
   //=====================================================
//----
   return(0);
  }

//+------------------------------------------------------------------+
//| StepMA_3D_v1                                                         |
//+------------------------------------------------------------------+
int start()
  {
      string short_name;
      short_name = "Max bars to count: |"+(Bars-1)+"| ";
      IndicatorShortName(short_name);

   int      i,shift,TrendMin,TrendMax,TrendMid, limit, counted_bars=IndicatorCounted();
   double   SminMin0,SmaxMin0,SminMin1,SmaxMin1,SumRange,dK,WATR0,WATRmax,WATRmin,WATRmid;
   double   SminMax0,SmaxMax0,SminMax1,SmaxMax1,SminMid0,SmaxMid0,SminMid1,SmaxMid1;
   double   linemin,linemax,linemid,Stoch1,Stoch2,bsmin,bsmax;
   //raduga : Variable theDelta - has a differense between two bsmin/max lines
   double theDelta;

   double prev_y = 0,prev_b = 0;

   if(counted_bars>0) counted_bars--;
   limit=Bars-counted_bars;

   for(shift=limit-1;shift>=0;shift--)
   {
	SumRange=0;
	//raduga: initialization because of ZERO-DEVIDE ERROR
	//===============================
	Stoch1 = 0.0;
	Stoch2 = 0.0;
	//===============================
	for (i=PeriodWATR-1;i>=0;i--)
	    {
       dK = 1+1.0*(PeriodWATR-i)/PeriodWATR;
       //raduga: MathAbs has no sense ragarding High - Low... Probably Close - open !!!!
       //SumRange+= dK*MathAbs(High[i+shift]-Low[i+shift]);
       SumRange+= dK*(High[i+shift]-Low[i+shift]);
       }
	WATR0 = SumRange/PeriodWATR;

	WATRmax=MathMax(WATR0,WATRmax);
	if (shift==limit-1-PeriodWATR) WATRmin=WATR0;
	WATRmin=MathMin(WATR0,WATRmin);

	int StepSizeMin=MathRound(Kwatr*WATRmin/Point);
	int StepSizeMax=MathRound(Kwatr*WATRmax/Point);
	int StepSizeMid=MathRound(Kwatr*0.5*(WATRmax+WATRmin)/Point);

	if (HighLow>0)
	  {
	  SmaxMin0=Low[shift]+2*StepSizeMin*Point;
	  SminMin0=High[shift]-2*StepSizeMin*Point;

	  SmaxMax0=Low[shift]+2*StepSizeMax*Point;
	  SminMax0=High[shift]-2*StepSizeMax*Point;

	  SmaxMid0=Low[shift]+2*StepSizeMid*Point;
	  SminMid0=High[shift]-2*StepSizeMid*Point;

	  if(Close[shift]>SmaxMin1) TrendMin=1;
	  if(Close[shift]<SminMin1) TrendMin=-1;

	  if(Close[shift]>SmaxMax1) TrendMax=1;
	  if(Close[shift]<SminMax1) TrendMax=-1;

	  if(Close[shift]>SmaxMid1) TrendMid=1;
	  if(Close[shift]<SminMid1) TrendMid=-1;
	  }

	if (HighLow == 0)
	  {
	  SmaxMin0=Close[shift]+2*StepSizeMin*Point;
	  SminMin0=Close[shift]-2*StepSizeMin*Point;

	  SmaxMax0=Close[shift]+2*StepSizeMax*Point;
	  SminMax0=Close[shift]-2*StepSizeMax*Point;

	  SmaxMid0=Close[shift]+2*StepSizeMid*Point;
	  SminMid0=Close[shift]-2*StepSizeMid*Point;

	  if(Close[shift]>SmaxMin1) TrendMin=1;
	  if(Close[shift]<SminMin1) TrendMin=-1;

	  if(Close[shift]>SmaxMax1) TrendMax=1;
	  if(Close[shift]<SminMax1) TrendMax=-1;

	  if(Close[shift]>SmaxMid1) TrendMid=1;
	  if(Close[shift]<SminMid1) TrendMid=-1;
	  }

	  if(TrendMin>0 && SminMin0<SminMin1) SminMin0=SminMin1;
	  if(TrendMin<0 && SmaxMin0>SmaxMin1) SmaxMin0=SmaxMin1;

	  if(TrendMax>0 && SminMax0<SminMax1) SminMax0=SminMax1;
	  if(TrendMax<0 && SmaxMax0>SmaxMax1) SmaxMax0=SmaxMax1;

	  if(TrendMid>0 && SminMid0<SminMid1) SminMid0=SminMid1;
	  if(TrendMid<0 && SmaxMid0>SmaxMid1) SmaxMid0=SmaxMid1;


	  if (TrendMin>0) linemin=SminMin0+StepSizeMin*Point;
	  if (TrendMin<0) linemin=SmaxMin0-StepSizeMin*Point;

	  if (TrendMax>0) linemax=SminMax0+StepSizeMax*Point;
	  if (TrendMax<0) linemax=SmaxMax0-StepSizeMax*Point;

	  if (TrendMid>0) linemid=SminMid0+StepSizeMid*Point;
	  if (TrendMid<0) linemid=SmaxMid0-StepSizeMid*Point;

	  bsmin=linemax-StepSizeMax*Point;
	  bsmax=linemax+StepSizeMax*Point;
	  //raduga: ZERO-DEVIDE-ERROR
	  //=============================
	  theDelta = bsmax-bsmin;
	  if(theDelta != 0)
	  {
	     Stoch1=NormalizeDouble((linemin-bsmin)/theDelta,6);
	     Stoch2=NormalizeDouble((linemid-bsmin)/theDelta,6);
	  }
	  //==============================
	  prev_y = (Stoch1 - Stoch2);
	  if(prev_y<0.0){
	     LineMinBuffer[shift] = prev_y;
	     LineMidBuffer[shift] = 0;
	     }
	  else if(prev_y>0.0){
	     LineMidBuffer[shift] = prev_y;
	     LineMinBuffer[shift] = 0;
	     }

	  //prev_y = Stoch1;
	  //prev_b = Stoch2;


	  SminMin1=SminMin0;
	  SmaxMin1=SmaxMin0;

	  SminMax1=SminMax0;
	  SmaxMax1=SmaxMax0;

	  SminMid1=SminMid0;
	  SmaxMid1=SmaxMid0;
	 }
	return(0);
 }
Comments