Hi_Low_Indicator
Download script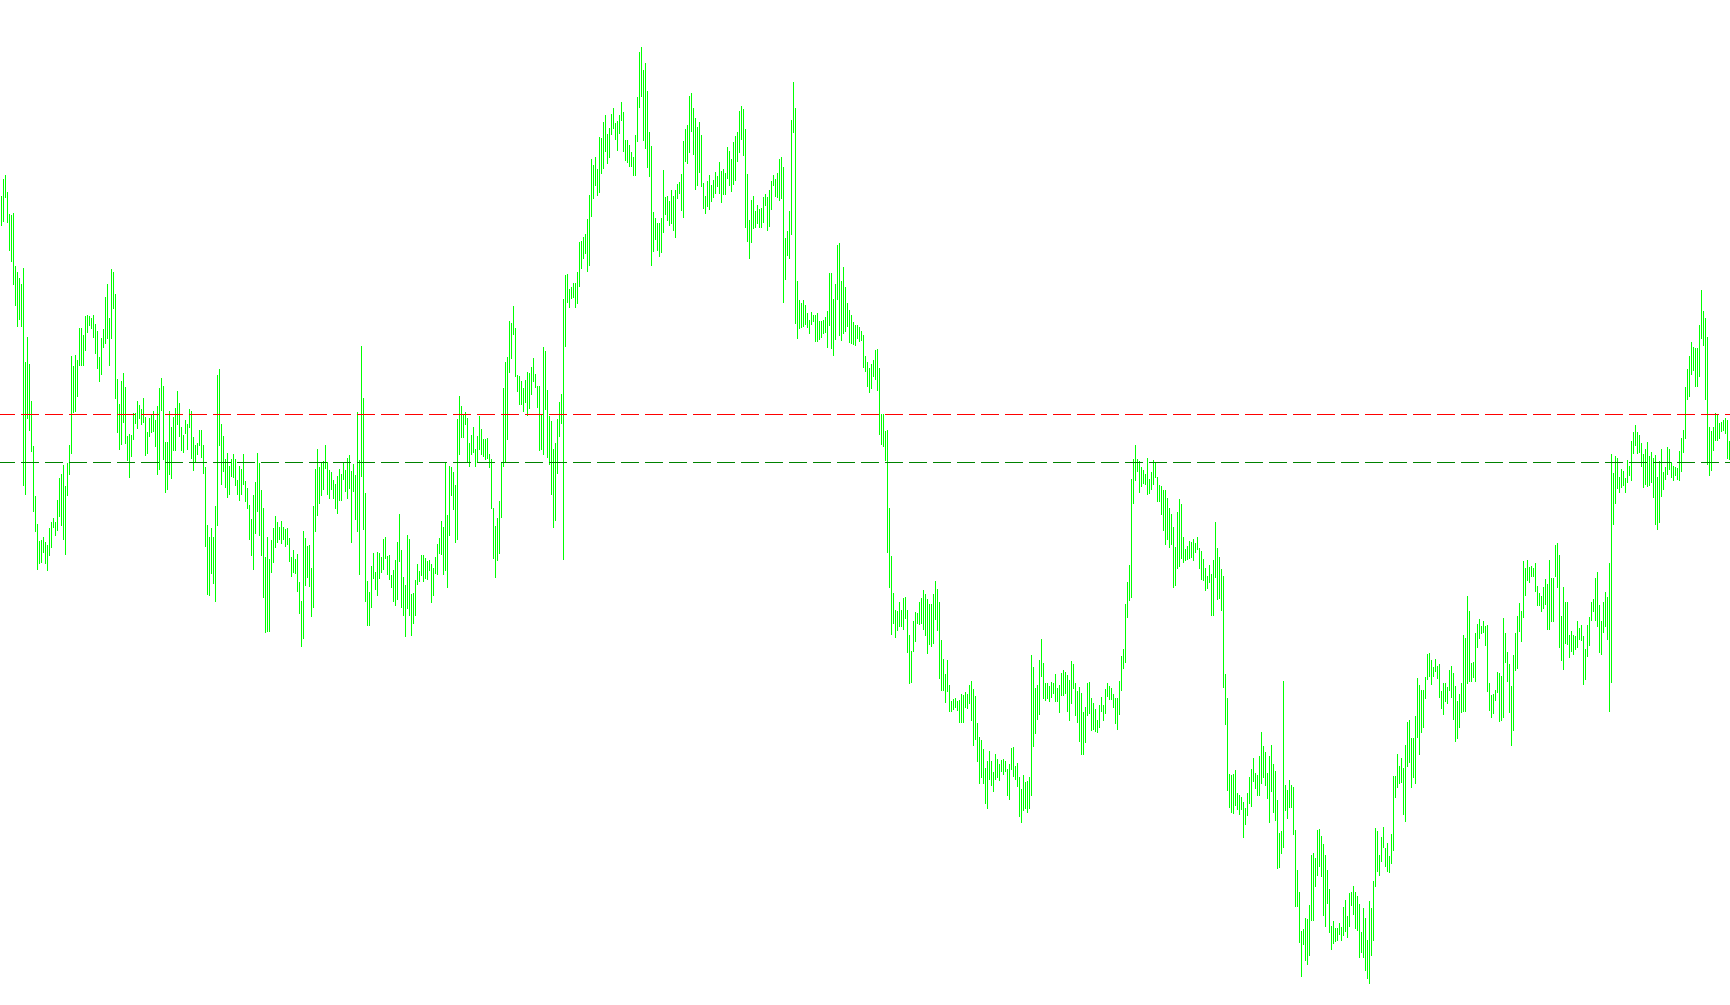
This tool is designed to provide traders with a clear visual reference of key price levels based on previous market activity. It specifically identifies and plots the highest and lowest price points reached during a recent period, helping users understand historical boundaries that may act as support or resistance in current trading.
How it Works
The script performs three main actions to assist with chart analysis:
- Data Identification: The tool automatically scans back through a specific number of previous hours (defined by the user) to find the absolute highest and lowest price points reached. By looking at this data, it identifies where the market "turned around" or peaked in the recent past.
- Visual Mapping: Once these two critical price levels are identified—the high point (peak) and the low point (base)—the tool draws horizontal lines across your current chart.
- The High Level is displayed as a red dashed line, highlighting the ceiling of previous price action.
- The Low Level is displayed as a green dashed line, highlighting the floor of previous price action.
- Dynamic Updates: The script is designed to update automatically. As new price data comes in, the lines will reposition themselves to reflect the most relevant highs and lows based on the settings you have chosen.
Key Features for the User
- Visual Clarity: By using dashed lines and distinct colors (Red for Highs, Green for Lows), it allows you to see at a glance whether the current price is trading near recent extremes.
- Automatic Cleanup: The tool is programmed to remove its markings automatically when it is no longer needed or removed from the chart, keeping your workspace clean.
- Timeframe Awareness: To ensure the visual data remains relevant, the tool is designed to display these lines primarily on shorter timeframes (like 1-hour charts), preventing the screen from becoming cluttered with unnecessary information on daily or weekly views.
Price Data Components
10
Views
1
Downloads
0
Favorites
Hi_Low_Indicator
//+------------------------------------------------------------------+
//|                                                Pivots_Hi_Low.mq4 |
//|                      Copyright © 2006, Cartwright Software Corp. |
//|                                        http://www.cartwright.net |
//+------------------------------------------------------------------+
#property copyright "Copyright © 2006, Cartwright Software Corp."
#property link      "http://www.cartwright.net"

#property indicator_chart_window

extern int BarsBack=8;    // (Set to 0 GMT) IBFX=GMT FXDD=GMT+3 5pm-17:00(PST)
extern bool ShowLines=true;
double yesterday_high, yesterday_low;


int init()
  {
//---- indicators
//----
   return(0);
  }
//+------------------------------------------------------------------+
//| Custom indicator deinitialization function                       |
//+------------------------------------------------------------------+
int deinit()
  {
//----
ObjectDelete("Yesterdays Low line");
ObjectDelete("Yesterdays High line");
//----
   return(0);
  }
//+------------------------------------------------------------------+
//| Custom indicator iteration function                              |
//+------------------------------------------------------------------+
int start()
  {

//----
yesterday_high=iHigh(NULL, PERIOD_H1,Highest(NULL, PERIOD_H1, MODE_HIGH, BarsBack, 0));
yesterday_low=iLow(NULL, PERIOD_H1,Lowest(NULL, PERIOD_H1, MODE_LOW, BarsBack, 0));

if (ShowLines==true && Period() < PERIOD_D1) {
ObjectDelete("Yesterdays Low line");
ObjectCreate("Yesterdays Low line",OBJ_HLINE, 0, Time[0], yesterday_low);
ObjectSet("Yesterdays Low line", OBJPROP_STYLE, STYLE_DASH);
ObjectSet("Yesterdays Low line", OBJPROP_COLOR, Green);

ObjectDelete("Yesterdays High line");
ObjectCreate("Yesterdays High line",OBJ_HLINE, 0, Time[0], yesterday_high);
ObjectSet("Yesterdays High line", OBJPROP_STYLE, STYLE_DASH);
ObjectSet("Yesterdays High line", OBJPROP_COLOR, Red);
}
//----
   return(0);
  }
//+------------------------------------------------------------------+
Comments