Hi_Low_Indicator_v2
Download script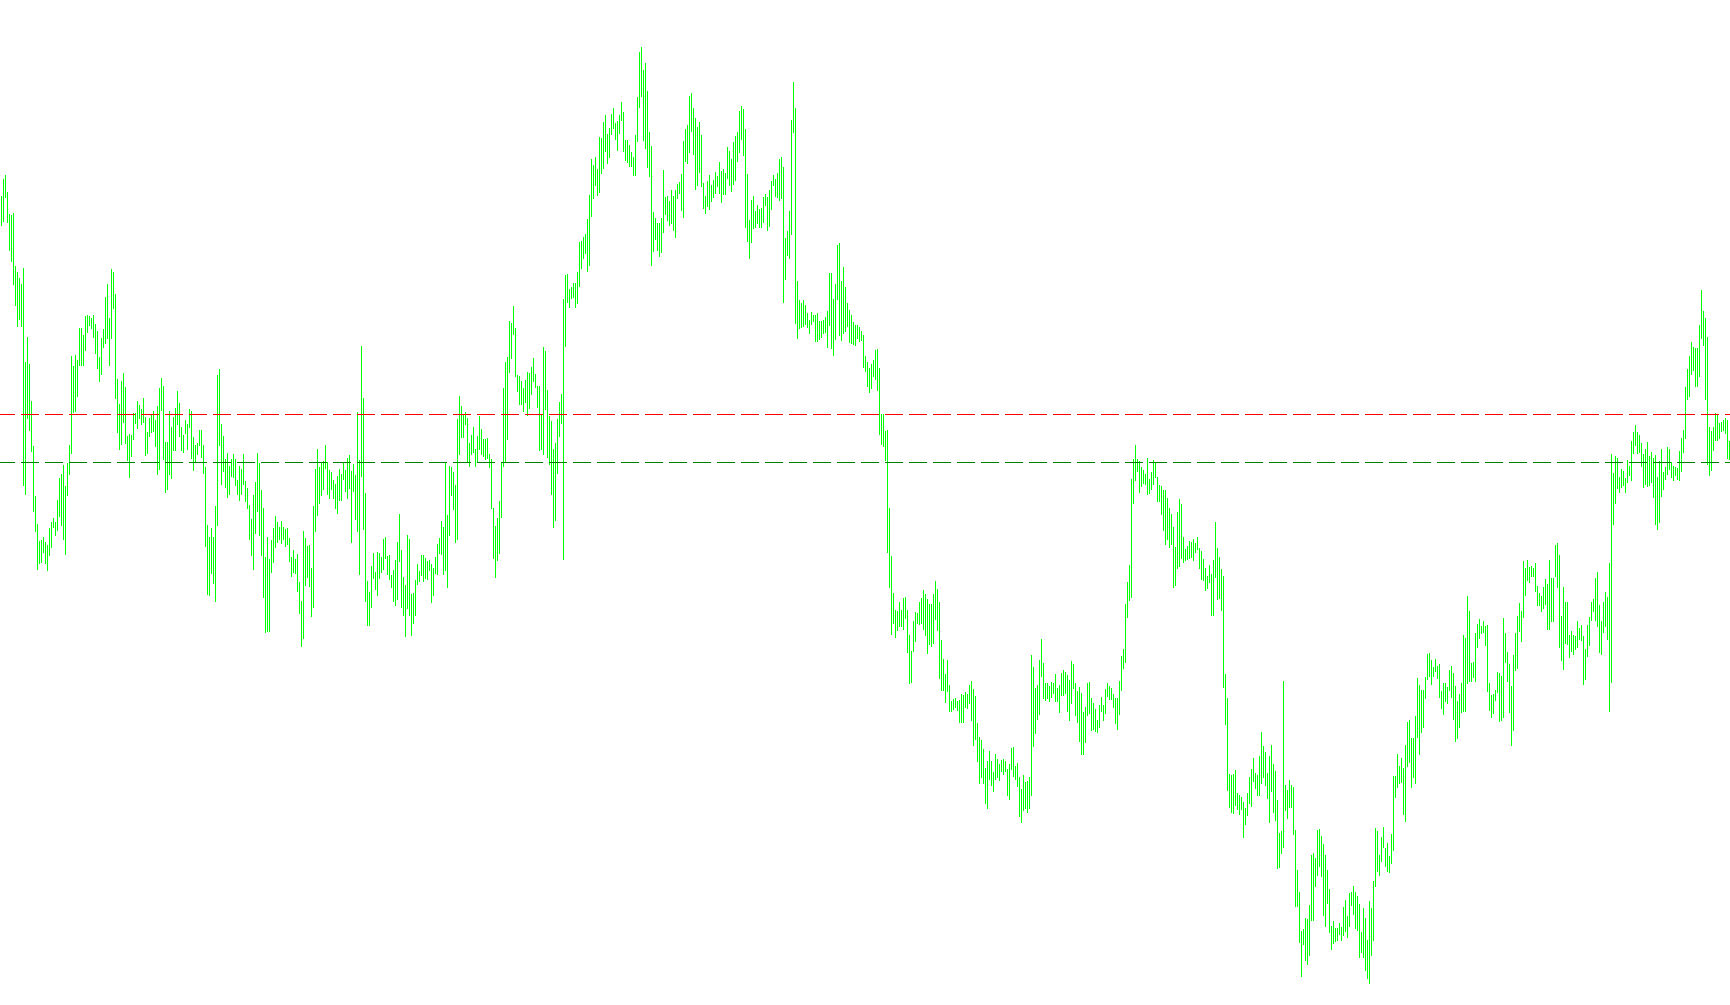
This tool is designed to provide traders with a clear visual reference of key price levels on their trading charts. Its primary purpose is to automatically identify and display the highest and lowest price points reached during a specific preceding timeframe, allowing you to see historical "boundaries" at a glance.
How the Logic Works
Data Identification The script scans the market history specifically looking at 1-hour intervals. It looks back over a user-defined number of bars (the default is set to 8) to find the maximum high and minimum low prices reached during that period. By calculating these values based on the previous trading sessions, it identifies important "Pivot" points where the price moved significantly in the past.
Visual Representation Once the script identifies these two critical price levels, it draws horizontal lines directly onto your current chart:
- The High Level: This is displayed as a dashed Red line. It represents the upper ceiling of the previous price action.
- The Low Level: This is displayed as a dashed Green line. It represents the lower floor of the previous price action.
Smart Display Rules To keep your charts clean and organized, the script includes built-in logic to manage how these lines appear:
- Timeframe Awareness: The lines will automatically disappear if you switch to a Daily chart or higher. This prevents the chart from becoming cluttered with redundant data when looking at large-scale trends.
- Dynamic Updates: Every time the market updates, the script refreshes these lines to ensure they are always aligned with the most recent data available from the previous period.
- Automatic Cleanup: When you remove the indicator or close the chart, the script is designed to automatically delete the lines so that no "ghost" drawings are left behind on your workspace.
Summary for the Trader
Essentially, this script automates the manual task of searching through old candles to find out where the price peaked and dipped previously. It places these "support" and "resistance" markers on your screen instantly, helping you visualize whether the current market price is breaking out above previous highs or falling below previous lows.
//+------------------------------------------------------------------+
//|                                                Pivots_Hi_Low.mq4 |
//|                      Copyright © 2006, Cartwright Software Corp. |
//|                                        http://www.cartwright.net |
//+------------------------------------------------------------------+
#property copyright "Copyright © 2006, Cartwright Software Corp."
#property link      "http://www.cartwright.net"
#property indicator_chart_window
//----
extern int BarsBack=8;    // (Set to 0 GMT) IBFX=GMT FXDD=GMT+3 5pm-17:00(PST)
extern bool ShowLines=true;
double yesterday_high, yesterday_low;
//+------------------------------------------------------------------+
//|                                                                  |
//+------------------------------------------------------------------+
int init()
  {
//---- indicators
//----
   return(0);
  }
//+------------------------------------------------------------------+
//| Custom indicator deinitialization function                       |
//+------------------------------------------------------------------+
int deinit()
  {
//----
   ObjectDelete("Yesterdays Low line");
   ObjectDelete("Yesterdays High line");
//----
   return(0);
  }
//+------------------------------------------------------------------+
//| Custom indicator iteration function                              |
//+------------------------------------------------------------------+
int start()
  {
//----
   yesterday_high=iHigh(NULL, PERIOD_H1,Highest(NULL, PERIOD_H1, MODE_HIGH, BarsBack, 0));
   yesterday_low=iLow(NULL, PERIOD_H1,Lowest(NULL, PERIOD_H1, MODE_LOW, BarsBack, 0));
//----
     if (ShowLines==true && Period() < PERIOD_D1)
     {
      ObjectDelete("Yesterdays Low line");
      ObjectCreate("Yesterdays Low line",OBJ_HLINE, 0, Time[0], yesterday_low);
      ObjectSet("Yesterdays Low line", OBJPROP_STYLE, STYLE_DASH);
      ObjectSet("Yesterdays Low line", OBJPROP_COLOR, Green);
      ObjectDelete("Yesterdays High line");
      ObjectCreate("Yesterdays High line",OBJ_HLINE, 0, Time[0], yesterday_high);
      ObjectSet("Yesterdays High line", OBJPROP_STYLE, STYLE_DASH);
      ObjectSet("Yesterdays High line", OBJPROP_COLOR, Red);
     }
//----
   return(0);
  }
//+------------------------------------------------------------------+
Comments