Hist_StepMA_Stoch_KV1_Ex_031
Download script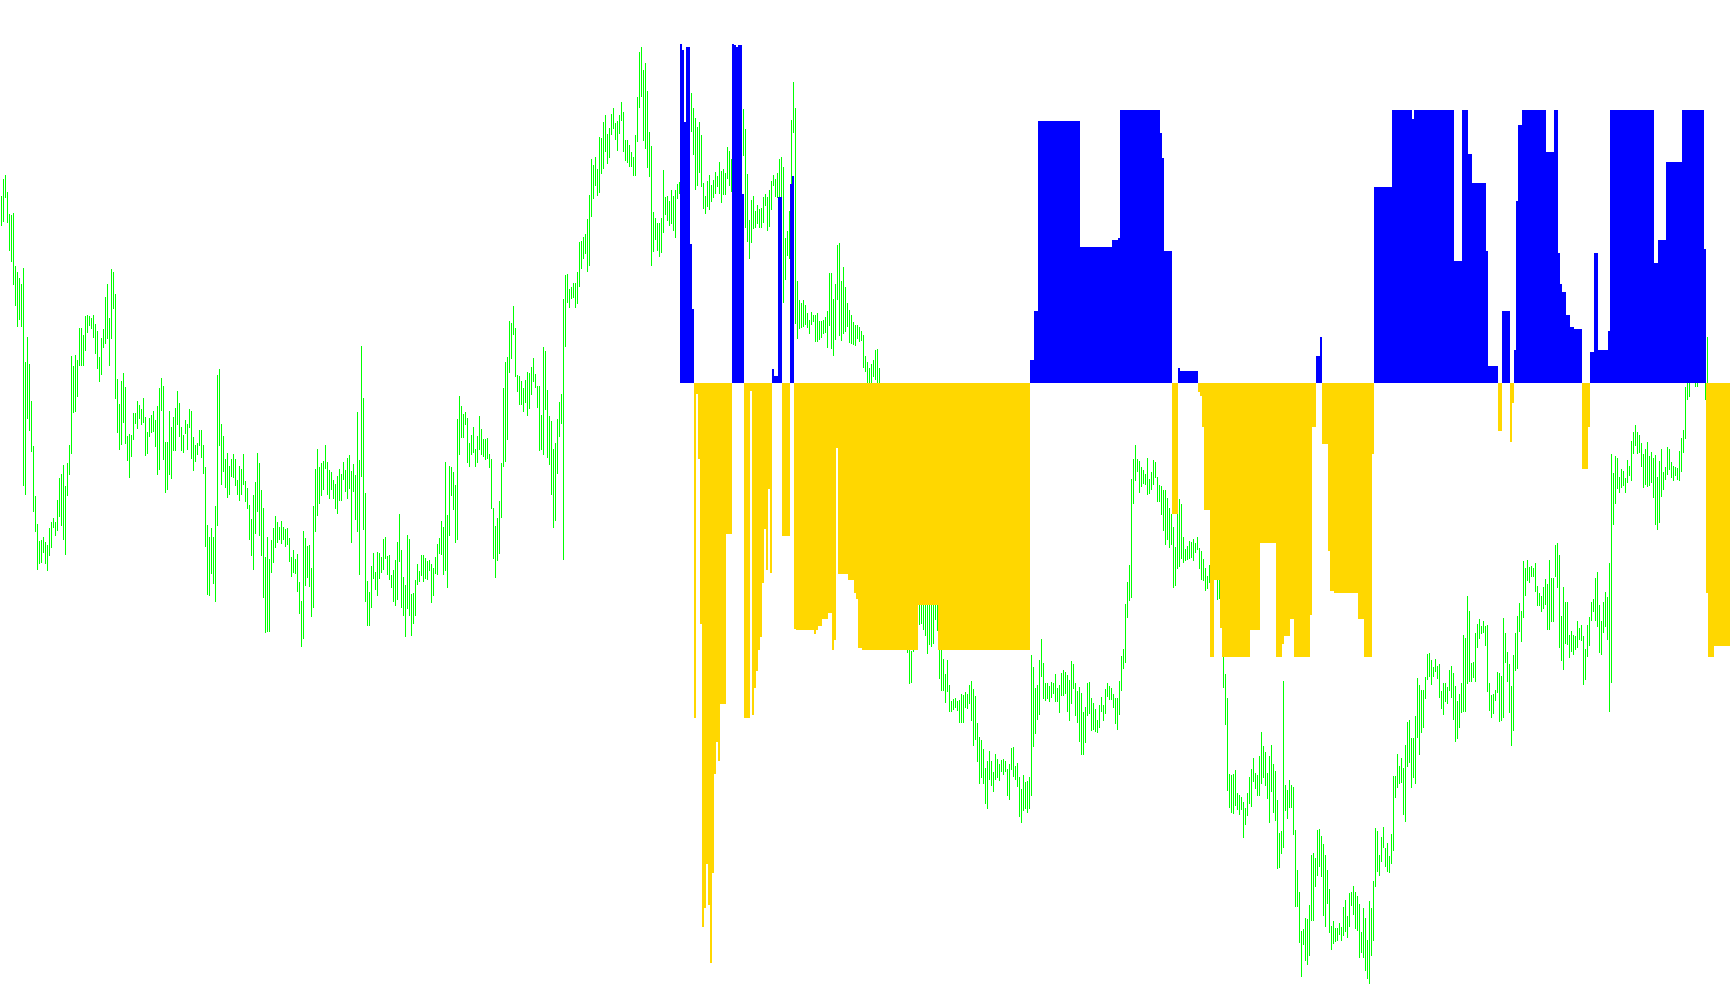
This script is designed to function as a visual trading indicator that identifies market trends and price momentum. It works by analyzing historical price action—specifically looking at the highs, lows, and closing prices—to determine whether the market is moving in a specific direction or if it is entering a phase of potential reversal.
Here is a breakdown of the logic used to generate the visual output:
Volatility and Range Analysis
The script begins by calculating a weighted average of the price range (the difference between the high and low prices) over a specific period. By applying weights to more recent bars, it creates a "Volatility ATR" value. This helps the indicator understand how much the market is swinging at any given time, which allows it to set dynamic boundaries for price movement rather than using fixed numbers.
Dynamic Trend Boundaries
Instead of using a simple moving average, the script establishes three different "Step" levels based on current volatility:
- Minimum Level: A tight boundary representing small movements.
- Maximum Level: A wide boundary representing significant volatility.
- Mid Level: A balanced boundary between the two.
The logic checks the relationship between the current market price and these boundaries. If the price pushes past a boundary, the script identifies a "Trend" (positive or negative). It then remembers these levels as it moves forward in time, creating a "staircase" effect where the trend lines stay steady until a significant new price movement forces them to step up or down.
Stochastic Calculation and Visualization
Once the trends for the Minimum, Mid, and Max levels are established, the script converts these values into a relative scale (similar to a Stochastic Oscillator).
It calculates two main indicators:
- Stoch 1: Represents the position of the "Minimum" trend relative to the "Maximum" trend.
- Stoch 2: Represents the position of the "Mid" trend relative to the "Maximum" trend.
The final visual output is a histogram that measures the distance between these two stochastic values.
How to Read the Result
The indicator produces two colored lines (histograms) in a separate window:
- Positive Values: When one trend is moving significantly faster or further than the other, a green histogram appears.
- Negative Values: When the opposing trend takes precedence, a red histogram appears.
Essentially, the tool filters out minor market "noise" by focusing on significant price steps, providing the user with a visual representation of which trend (Minimum, Mid, or Max) is currently dominating the market momentum.
//+------------------------------------------------------------------+
//|                                             StepMA_Stoch_KV1.mq4 |
//|                           Copyright © 2005, TrendLaboratory Ltd. |
//|                                       E-mail: igorad2004@list.ru |
//|                           modified by Kalenzo -> simone@konto.pl |
//|                           modified by raduga  21.04.2006         |
//+------------------------------------------------------------------+
#property copyright "Copyright © 2005, TrendLaboratory Ltd."
#property link      "E-mail: igorad2004@list.ru"

#property indicator_separate_window
#property indicator_buffers 2
#property indicator_color1 Red
#property indicator_color2 Green

//#property indicator_minimum -1
//#property indicator_maximum 1

//---- input parameters
extern int PeriodWATR=10;
extern double Kwatr=1.0000;
extern int HighLow=0;
extern int NumberOfBarsToCalculate = 500;
//---- indicator buffers
double LineMinBuffer[];
double LineMidBuffer[];
//+------------------------------------------------------------------+
//| Custom indicator initialization function                         |
//+------------------------------------------------------------------+
  int init()
  {
 Comment("");
//---- indicator line
   SetIndexStyle(0,DRAW_HISTOGRAM,STYLE_SOLID,2);
   SetIndexStyle(1,DRAW_HISTOGRAM,STYLE_SOLID,2);
   SetIndexBuffer(0,LineMinBuffer);
   SetIndexBuffer(1,LineMidBuffer);
   IndicatorDigits(MarketInfo(Symbol(),MODE_DIGITS));
//---- name for DataWindow and indicator subwindow label
   //short_name="StepMA Stoch("+PeriodWATR+","+Kwatr+","+HighLow+")";

   SetIndexLabel(0,"StepMA Stoch 1");
   SetIndexLabel(1,"StepMA Stoch 2");
//----
   SetIndexDrawBegin(0,PeriodWATR);
   SetIndexDrawBegin(1,PeriodWATR);
   /**
   *raduga:
   *USELESS !!!! Throws "ArrayInitialization" Exception !!!!
   **/
   //======================================================
   //ArrayInitialize(LineMinBuffer,0);
   //ArrayInitialize(LineMidBuffer,0);
   SetIndexEmptyValue(0,0.0);
   SetIndexEmptyValue(1,0.0);
   //=====================================================
//----
   return(0);
  }

//+------------------------------------------------------------------+
//| StepMA_3D_v1                                                         |
//+------------------------------------------------------------------+
int start()
  {
      string short_name;
      short_name = "Max bars to count: |"+(Bars-1)+"| ";
      IndicatorShortName(short_name);

   int      i,shift,TrendMin,TrendMax,TrendMid;
   double   SminMin0,SmaxMin0,SminMin1,SmaxMin1,SumRange,dK,WATR0,WATRmax,WATRmin,WATRmid;
   double   SminMax0,SmaxMax0,SminMax1,SmaxMax1,SminMid0,SmaxMid0,SminMid1,SmaxMid1;
   double   linemin,linemax,linemid,Stoch1,Stoch2,bsmin,bsmax;
   //raduga : Variable theDelta - has a differense between two bsmin/max lines
   double theDelta;

   double prev_y = 0,prev_b = 0;

   for(shift=NumberOfBarsToCalculate-1;shift>=0;shift--)
   {
	SumRange=0;
	//raduga: initialization because of ZERO-DEVIDE ERROR
	//===============================
	Stoch1 = 0.0;
	Stoch2 = 0.0;
	//===============================
	for (i=PeriodWATR-1;i>=0;i--)
	    {
       dK = 1+1.0*(PeriodWATR-i)/PeriodWATR;
       //raduga: MathAbs has no sense ragarding High - Low... Probably Close - open !!!!
       //SumRange+= dK*MathAbs(High[i+shift]-Low[i+shift]);
       SumRange+= dK*(High[i+shift]-Low[i+shift]);
       }
	WATR0 = SumRange/PeriodWATR;

	WATRmax=MathMax(WATR0,WATRmax);
	if (shift==NumberOfBarsToCalculate-1-PeriodWATR) WATRmin=WATR0;
	WATRmin=MathMin(WATR0,WATRmin);

	int StepSizeMin=MathRound(Kwatr*WATRmin/Point);
	int StepSizeMax=MathRound(Kwatr*WATRmax/Point);
	int StepSizeMid=MathRound(Kwatr*0.5*(WATRmax+WATRmin)/Point);

	if (HighLow>0)
	  {
	  SmaxMin0=Low[shift]+2*StepSizeMin*Point;
	  SminMin0=High[shift]-2*StepSizeMin*Point;

	  SmaxMax0=Low[shift]+2*StepSizeMax*Point;
	  SminMax0=High[shift]-2*StepSizeMax*Point;

	  SmaxMid0=Low[shift]+2*StepSizeMid*Point;
	  SminMid0=High[shift]-2*StepSizeMid*Point;

	  if(Close[shift]>SmaxMin1) TrendMin=1;
	  if(Close[shift]<SminMin1) TrendMin=-1;

	  if(Close[shift]>SmaxMax1) TrendMax=1;
	  if(Close[shift]<SminMax1) TrendMax=-1;

	  if(Close[shift]>SmaxMid1) TrendMid=1;
	  if(Close[shift]<SminMid1) TrendMid=-1;
	  }

	if (HighLow == 0)
	  {
	  SmaxMin0=Close[shift]+2*StepSizeMin*Point;
	  SminMin0=Close[shift]-2*StepSizeMin*Point;

	  SmaxMax0=Close[shift]+2*StepSizeMax*Point;
	  SminMax0=Close[shift]-2*StepSizeMax*Point;

	  SmaxMid0=Close[shift]+2*StepSizeMid*Point;
	  SminMid0=Close[shift]-2*StepSizeMid*Point;

	  if(Close[shift]>SmaxMin1) TrendMin=1;
	  if(Close[shift]<SminMin1) TrendMin=-1;

	  if(Close[shift]>SmaxMax1) TrendMax=1;
	  if(Close[shift]<SminMax1) TrendMax=-1;

	  if(Close[shift]>SmaxMid1) TrendMid=1;
	  if(Close[shift]<SminMid1) TrendMid=-1;
	  }

	  if(TrendMin>0 && SminMin0<SminMin1) SminMin0=SminMin1;
	  if(TrendMin<0 && SmaxMin0>SmaxMin1) SmaxMin0=SmaxMin1;

	  if(TrendMax>0 && SminMax0<SminMax1) SminMax0=SminMax1;
	  if(TrendMax<0 && SmaxMax0>SmaxMax1) SmaxMax0=SmaxMax1;

	  if(TrendMid>0 && SminMid0<SminMid1) SminMid0=SminMid1;
	  if(TrendMid<0 && SmaxMid0>SmaxMid1) SmaxMid0=SmaxMid1;


	  if (TrendMin>0) linemin=SminMin0+StepSizeMin*Point;
	  if (TrendMin<0) linemin=SmaxMin0-StepSizeMin*Point;

	  if (TrendMax>0) linemax=SminMax0+StepSizeMax*Point;
	  if (TrendMax<0) linemax=SmaxMax0-StepSizeMax*Point;

	  if (TrendMid>0) linemid=SminMid0+StepSizeMid*Point;
	  if (TrendMid<0) linemid=SmaxMid0-StepSizeMid*Point;

	  bsmin=linemax-StepSizeMax*Point;
	  bsmax=linemax+StepSizeMax*Point;
	  //raduga: ZERO-DEVIDE-ERROR
	  //=============================
	  theDelta = bsmax-bsmin;
	  if(theDelta != 0)
	  {
	     Stoch1=NormalizeDouble((linemin-bsmin)/theDelta,6);
	     Stoch2=NormalizeDouble((linemid-bsmin)/theDelta,6);
	  }
	  //==============================
	  prev_y = (Stoch1 - Stoch2);
	  if(prev_y<0.0){
	     LineMinBuffer[shift] = prev_y;
	     LineMidBuffer[shift] = 0;
	     }
	  else if(prev_y>0.0){
	     LineMidBuffer[shift] = prev_y;
	     LineMinBuffer[shift] = 0;
	     }

	  //prev_y = Stoch1;
	  //prev_b = Stoch2;


	  SminMin1=SminMin0;
	  SmaxMin1=SmaxMin0;

	  SminMax1=SminMax0;
	  SmaxMax1=SmaxMax0;

	  SminMid1=SminMid0;
	  SmaxMid1=SmaxMid0;
	 }
	return(0);
 }
Comments