HLR
Download script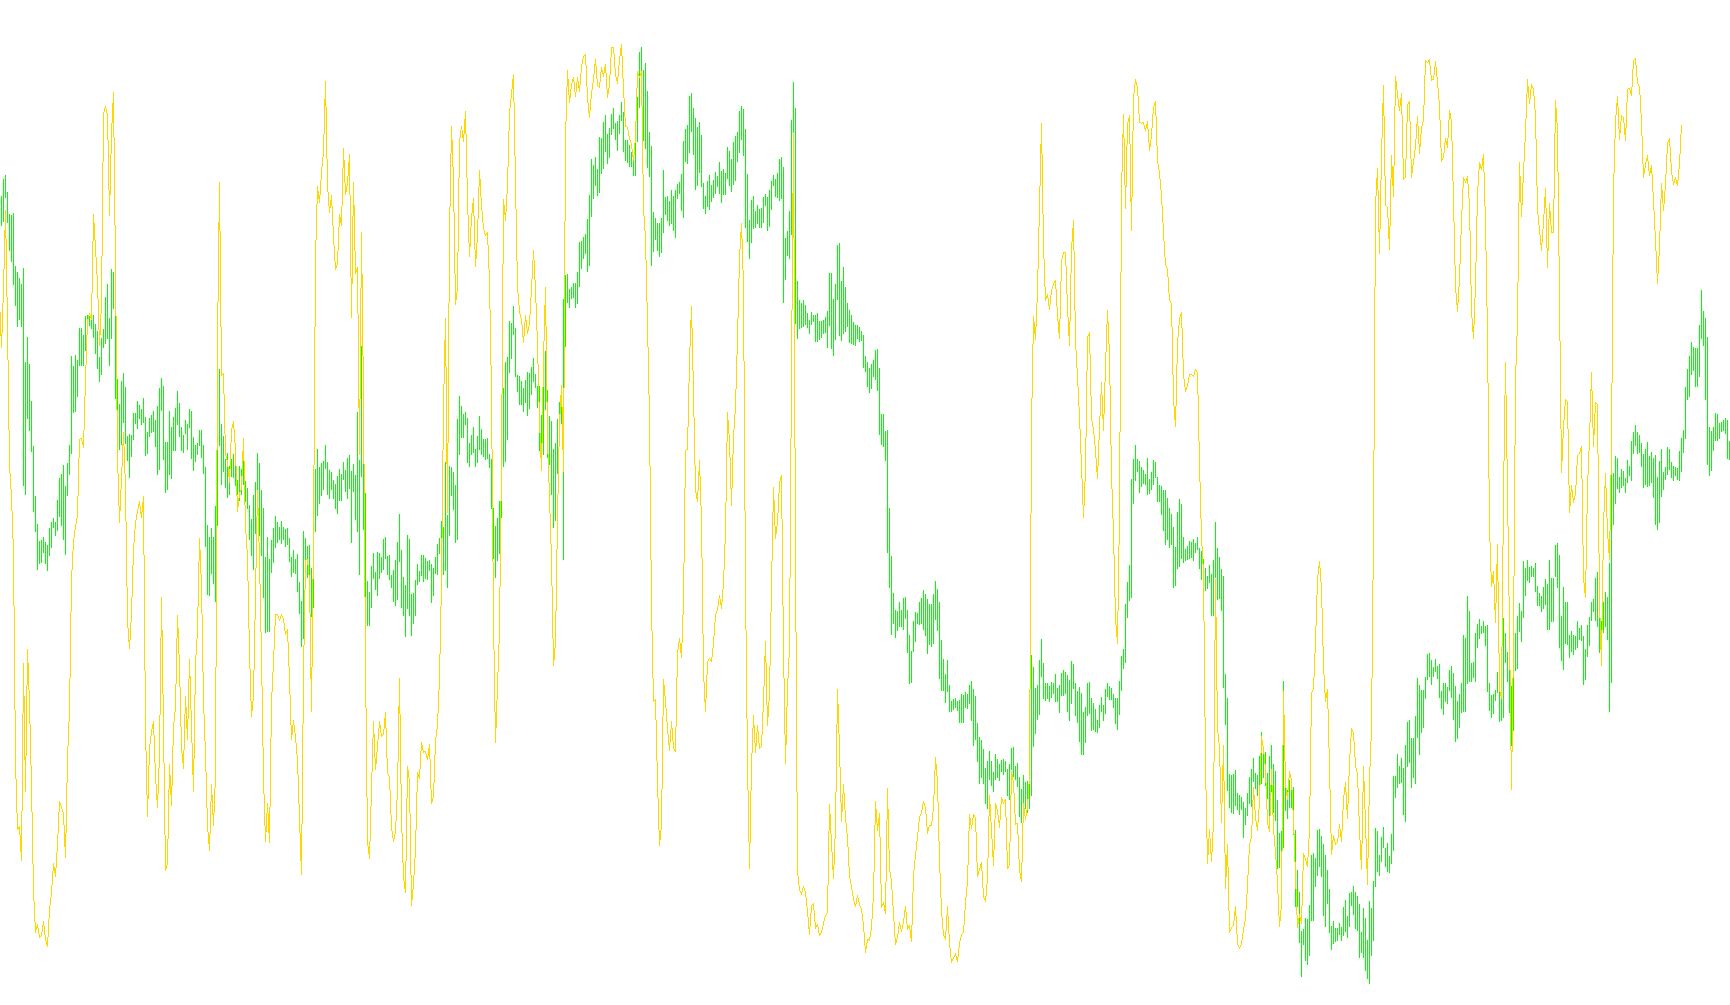
The Hi-Lo Range Oscillator is a specialized technical analysis tool designed to measure where the current price sits relative to a specific recent period of market activity. Instead of simply looking at where the price is going, this indicator helps visualize "where we are" within a defined range of highs and lows.
Core Logic and Functionality
The script operates by analyzing a user-defined window of past price action (the "Range"). It identifies the highest peak and the lowest valley reached during that specific timeframe to establish a boundary. Once these boundaries are set, the indicator calculates the midpoint of the current price candle.
By comparing this current midpoint to the extremes of the range, the tool generates a percentage-based value. This value is then plotted on a separate window in your trading platform, typically ranging from 0 to 100.
Key Components of the Logic:
- Dynamic Range Assessment: The tool automatically scans back through a set number of candles (determined by the user) to find the absolute highest and lowest points. This allows the indicator to adapt to different market volatilities.
- Relative Positioning: The primary calculation takes the distance between the current price and the bottom of the range, then divides it by the total height of the range.
- If the price is near the recent low, the value will be closer to 0.
- If the price is near the recent high, the value will approach 100.
- A value near 50 indicates that the price is currently trading in the middle of its recent range.
- Smart Filtering: The script includes logic to ensure stability. It checks if the midpoint of the price has actually changed before performing new calculations, which helps prevent unnecessary processing and ensures a smoother visual output on your chart.
- Visual Thresholds: The indicator is equipped with pre-defined horizontal levels (20, 50, and 80). These serve as visual landmarks to help traders quickly identify "overextended" price action—for example, when the price pushes into the top 20% or bottom 20% of its recent trading range.
How it is used by Traders
This tool is primarily used to identify potential exhaustion points. When the oscillator reaches the extreme ends of the scale (near 0 or 100), it suggests that the market has moved significantly in one direction relative to its recent history, often signaling a potential slowdown or a reversal in price momentum.
//+------------------------------------------------------------------+
//|                                                          HLR.mq4 |
//|                                      Copyright © 2007, Alexandre |
//|                      http://www.kroufr.ru/content/view/1184/124/ |
//+------------------------------------------------------------------+
#property copyright "Copyright © 2006, Alexandre"
#property link      "http://www.kroufr.ru/content/view/1184/124/"
//----
#property indicator_separate_window
#property indicator_buffers 1
#property indicator_minimum 0
#property indicator_maximum 100
#property indicator_color1 Red
#property indicator_level1 20
#property indicator_level2 50
#property indicator_level3 80
//---- input parameters
extern bool LastBarOnly = true;
extern int  HLR_Range   = 40;
//---- buffers
double HLR_Buffer[];
//+------------------------------------------------------------------+
//| Custom indicator initialization function                         |
//+------------------------------------------------------------------+
int init()
  {
//----
   if(HLR_Range <= 1)
       HLR_Range = 1;
//---- indicators
   IndicatorShortName("Hi-Lo Range Oscillator (" + HLR_Range + ")");
   SetLevelStyle(STYLE_DASHDOT, 1, DodgerBlue);
   SetIndexStyle(0, DRAW_LINE);
   SetIndexLabel(0, "HLR");
   SetIndexBuffer(0, HLR_Buffer);
   SetIndexDrawBegin(0, HLR_Range);
//----
   return(0);
  }
//+------------------------------------------------------------------+
//| Custom indicator deinitialization function                       |
//+------------------------------------------------------------------+
int deinit()
  {
//----
   return(0);
  }
//+------------------------------------------------------------------+
//| Custom indicator iteration function                              |
//+------------------------------------------------------------------+
int start()
  {
   int counted_bars = IndicatorCounted();
   int i, Limit, cnt_bars;
   double hhv, llv, m_pr;
   static bool   run_once;
   static double m_pr_old;
// to prevent possible error
   if(counted_bars < 0)
       return(-1);
   Limit = Bars - counted_bars;
// run once on start
   if(run_once == false)
       cnt_bars = Limit - HLR_Range;
   else
       if(LastBarOnly == false)
           cnt_bars = Limit;
       else
           cnt_bars = 0;
   m_pr = (High[cnt_bars] + Low[cnt_bars]) / 2.0;
//----
   if(MathAbs(m_pr - m_pr_old) < Point)
       return(0);
   else
       m_pr_old = m_pr;
//----
   for(i = cnt_bars; i >= 0; i--)
     {
       hhv  = High[iHighest(NULL, 0, MODE_HIGH, HLR_Range, i)];
       llv  =  Low[iLowest (NULL, 0, MODE_LOW,  HLR_Range, i)];
       m_pr = (High[i] + Low[i]) / 2.0;
       HLR_Buffer[i] = 100.0 * (m_pr - llv) / (hhv - llv);
     }
//----
   if(run_once == false)
       run_once = true;
//----
   return(0);
  }
//+------------------------------------------------------------------+
Comments