HLBolinger
Download script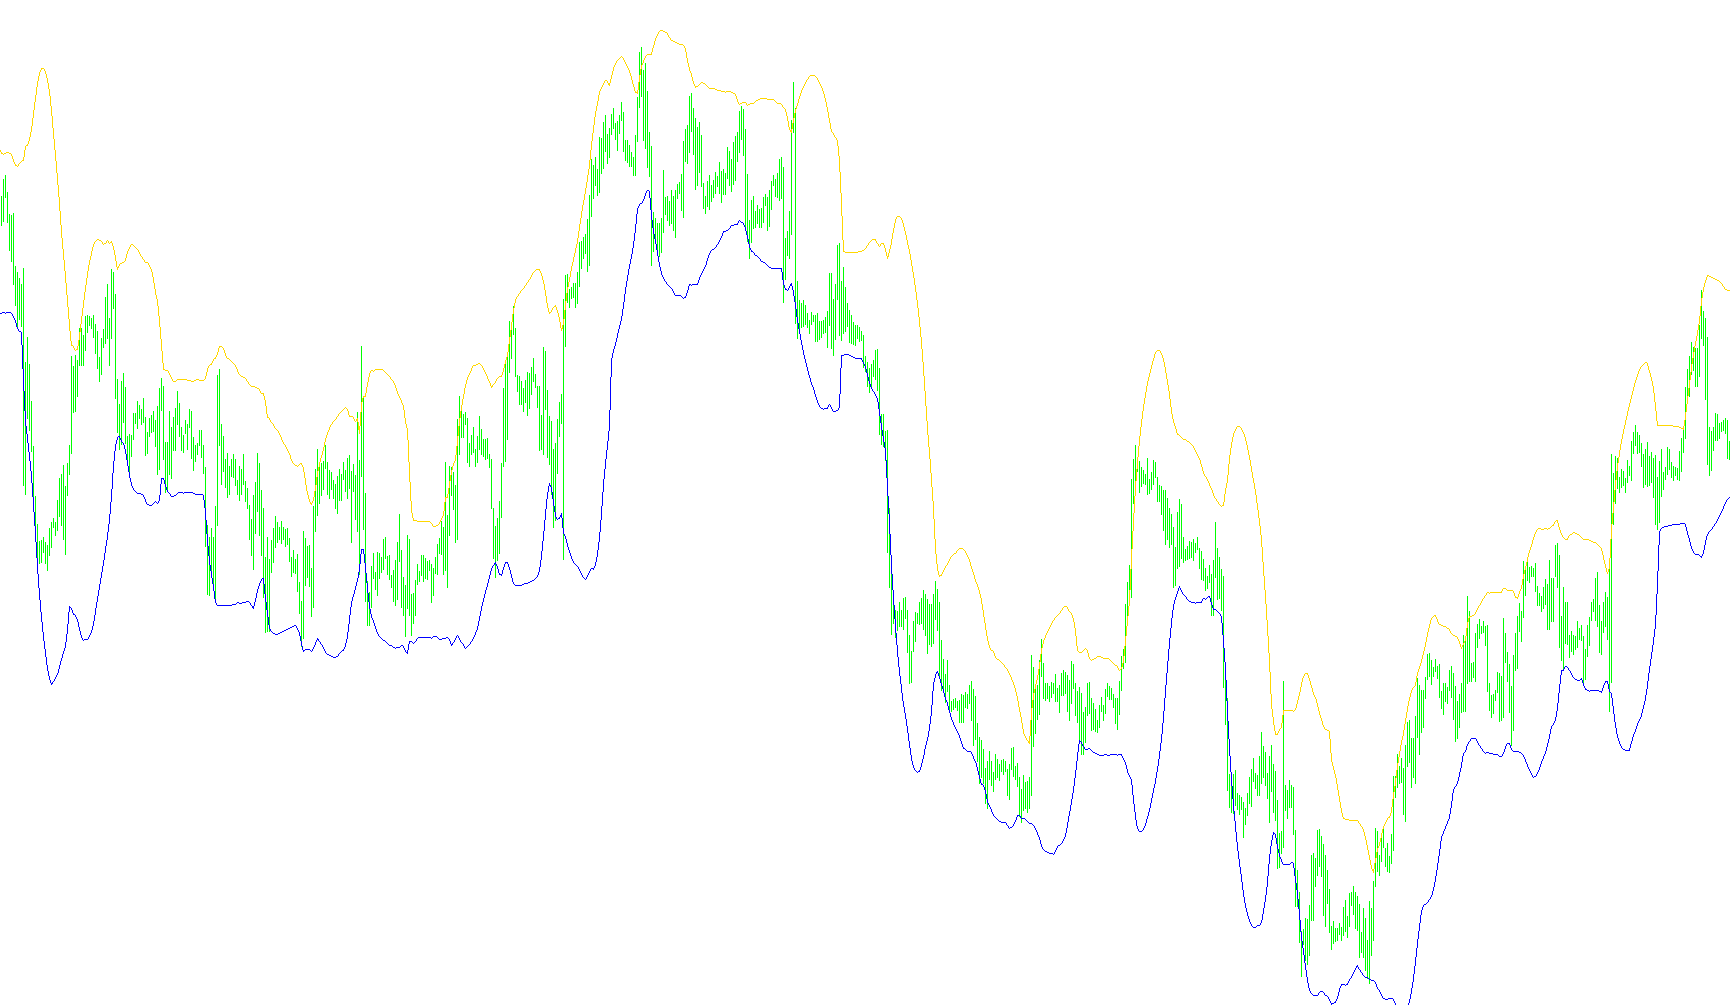
This tool is designed to provide traders with a specialized visual map of market price action by identifying significant "high" and "low" boundaries. Unlike standard indicators that might focus on the average closing price, this script specifically analyzes the extremes of price movement to help define the trading range.
How it Works
The logic operates by calculating two distinct types of boundaries simultaneously:
- The Upper Boundary (Top): The script looks at the highest prices reached during a specific timeframe. It calculates how far above the average high these peaks typically swing. This creates a "ceiling" line on your chart, representing the upper limit of recent price volatility.
- The Lower Boundary (Bottom): Similarly, the script monitors the lowest prices reached within that same timeframe. It calculates the typical downward swings to establish a "floor" line.
Key Features and Behavior
- High/Low Focus: By utilizing the High and Low prices rather than just the closing price, the tool provides a more comprehensive view of the market's "reach." It captures the full extent of the candles' wicks, showing where the price actually touched.
- Dual Independent Tracking: The script allows for two different sets of calculations (Top and Bottom). This means you can customize the sensitivity and timeframes for the upper and lower boundaries independently to better suit your specific trading style.
- Visual Clarity: The results are displayed as two smooth lines on your main chart window. These lines act as dynamic guides, shifting in real-time as new price data enters the market.
Purpose for the Trader
The primary goal of this logic is to define the "trading corridor." By visualizing these boundaries, you can better identify when the market is stretching toward its limits or when it might be reversing from an extreme high or low. It serves as a technical guide to help identify potential areas of support and resistance based on historical price extremes.
//+--------------------------------------------------------------------+
//|                                                     HLBolinger.mq4 |
//|                     Copyright © 2008, Sugeng Pudjiono & Associate  |
//|                                       http://www.payroll-kita.com/ |
//+--------------------------------------------------------------------+
#property copyright "Copyright © 2008, Sugeng Pudjiono & Associate"
#property link      "http://www.payroll-kita.com/"
#property indicator_chart_window
#property indicator_buffers 2
#property indicator_color1 LightBlue
#property indicator_color2 LightBlue

extern double TPeriod=24,TStd=2,BPeriod=24,BStd=2;

//---- indicator buffers
double   TBuffer[];
double   BBuffer[];
int      limit;

//+------------------------------------------------------------------+
//| Custom indicator initialization function                         |
//+------------------------------------------------------------------+


int init()
  {
   SetIndexShift(0,0);
   SetIndexDrawBegin(0,0);
   SetIndexBuffer(0,TBuffer);
   SetIndexStyle(0,DRAW_LINE,0,1);
   SetIndexLabel(0,"Top");

   SetIndexShift(1,0);
   SetIndexDrawBegin(1,0);
   SetIndexBuffer(1,BBuffer);
   SetIndexStyle(1,DRAW_LINE,0,1);
   SetIndexLabel(1,"Bottom");

   return(0);
  }


int deinit()
  {
  GlobalVariablesDeleteAll();
  return(0);
  }


//+----------------------+
//| H/L Bollinger Bands  |
//+----------------------+
int start()
  {
   int counted_bars=IndicatorCounted();
   limit=Bars-counted_bars;
   if(counted_bars>0) limit++;
   for(int i=limit; i>-1; i--)
     {
         TBuffer[i]=iBands(NULL,0,TPeriod,TStd,0,PRICE_HIGH,MODE_UPPER,i);
         BBuffer[i]=iBands(NULL,0,BPeriod,BStd,0,PRICE_LOW ,MODE_LOWER,i);
     }
  return(0);
  }
Comments