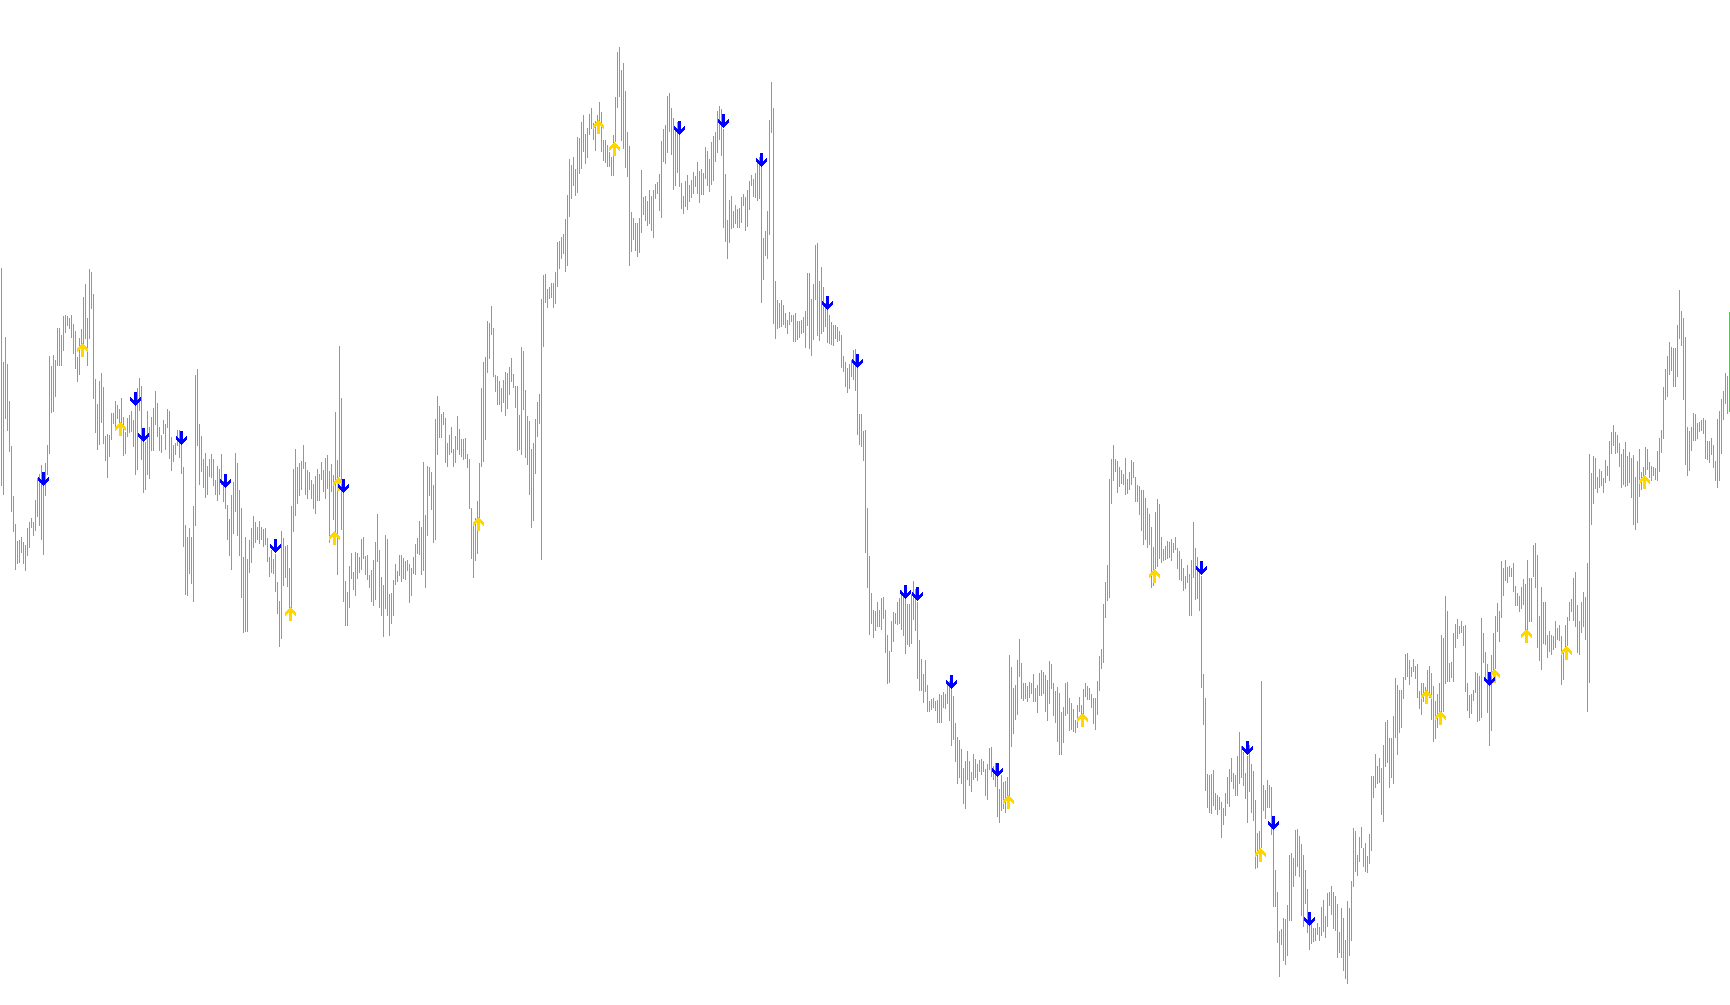
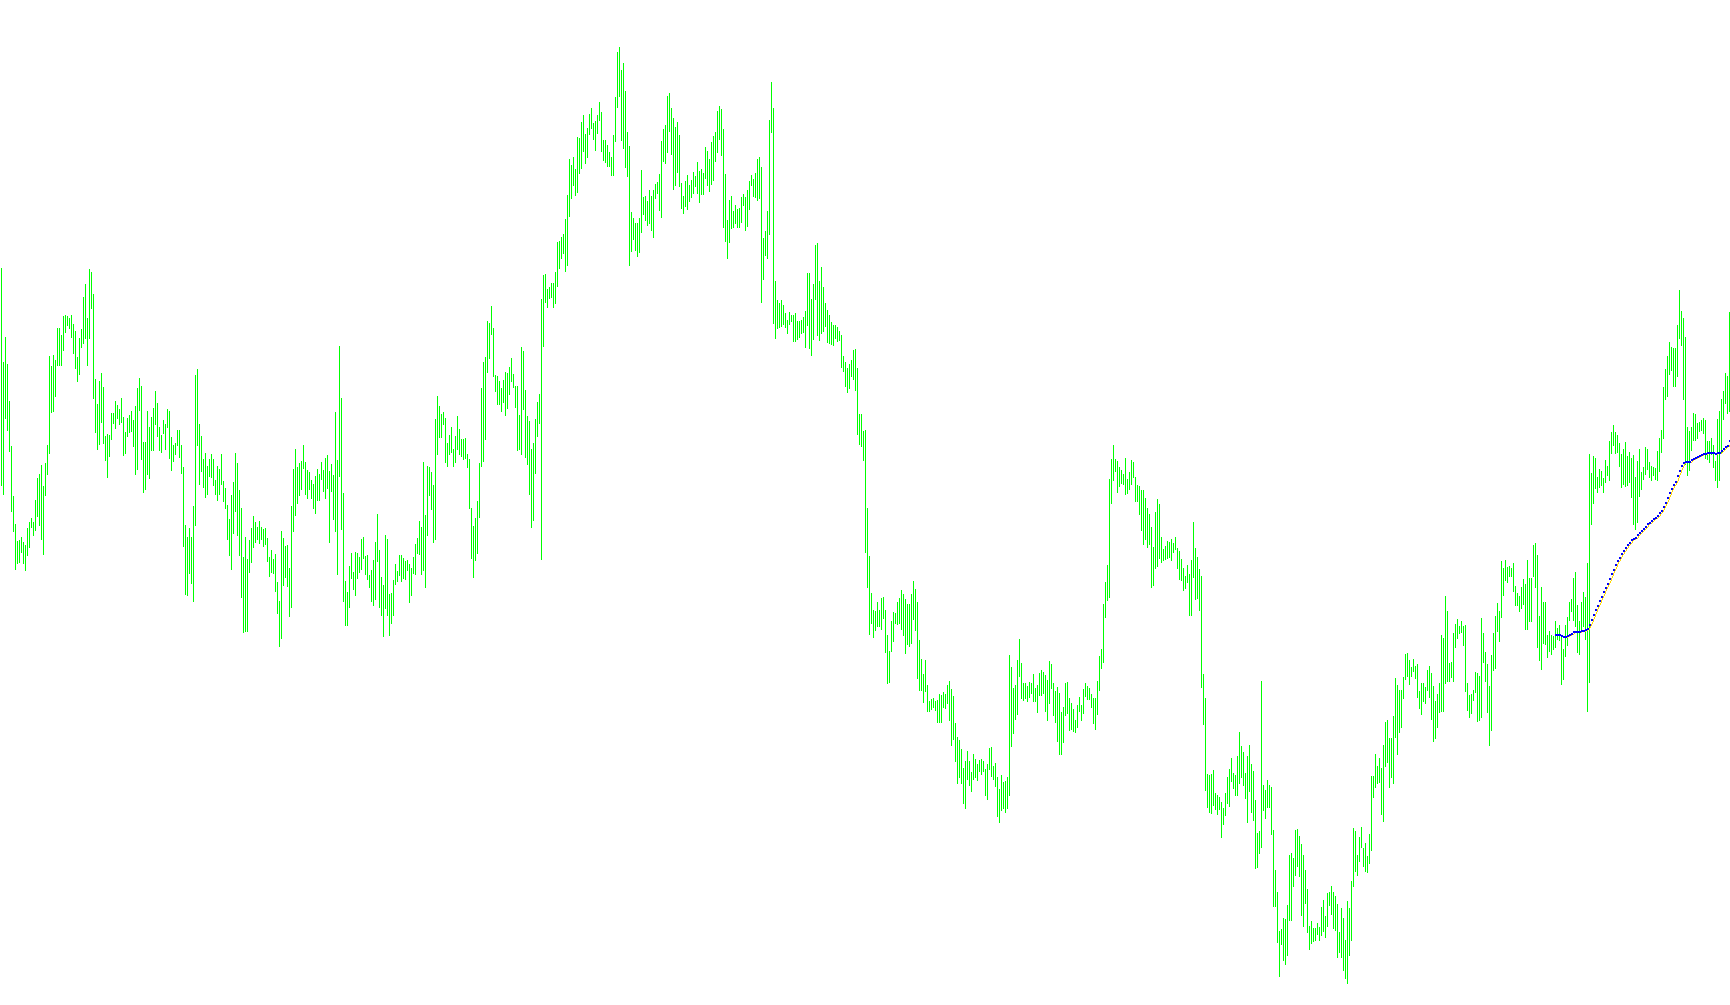
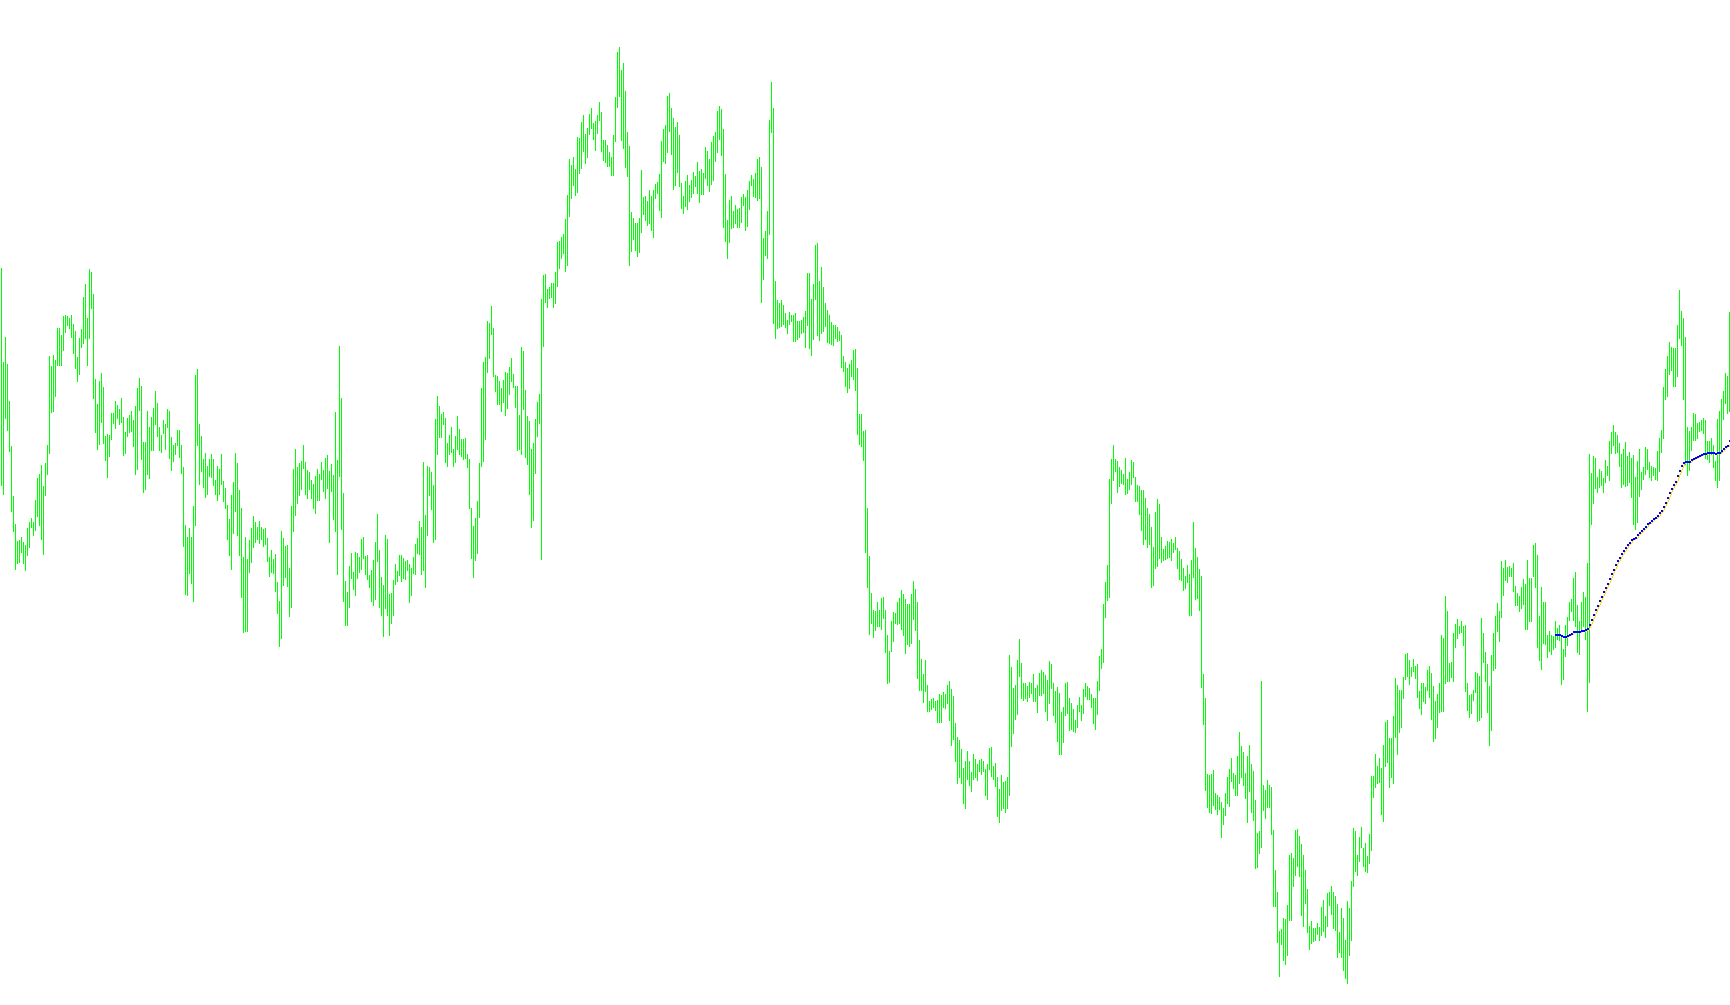
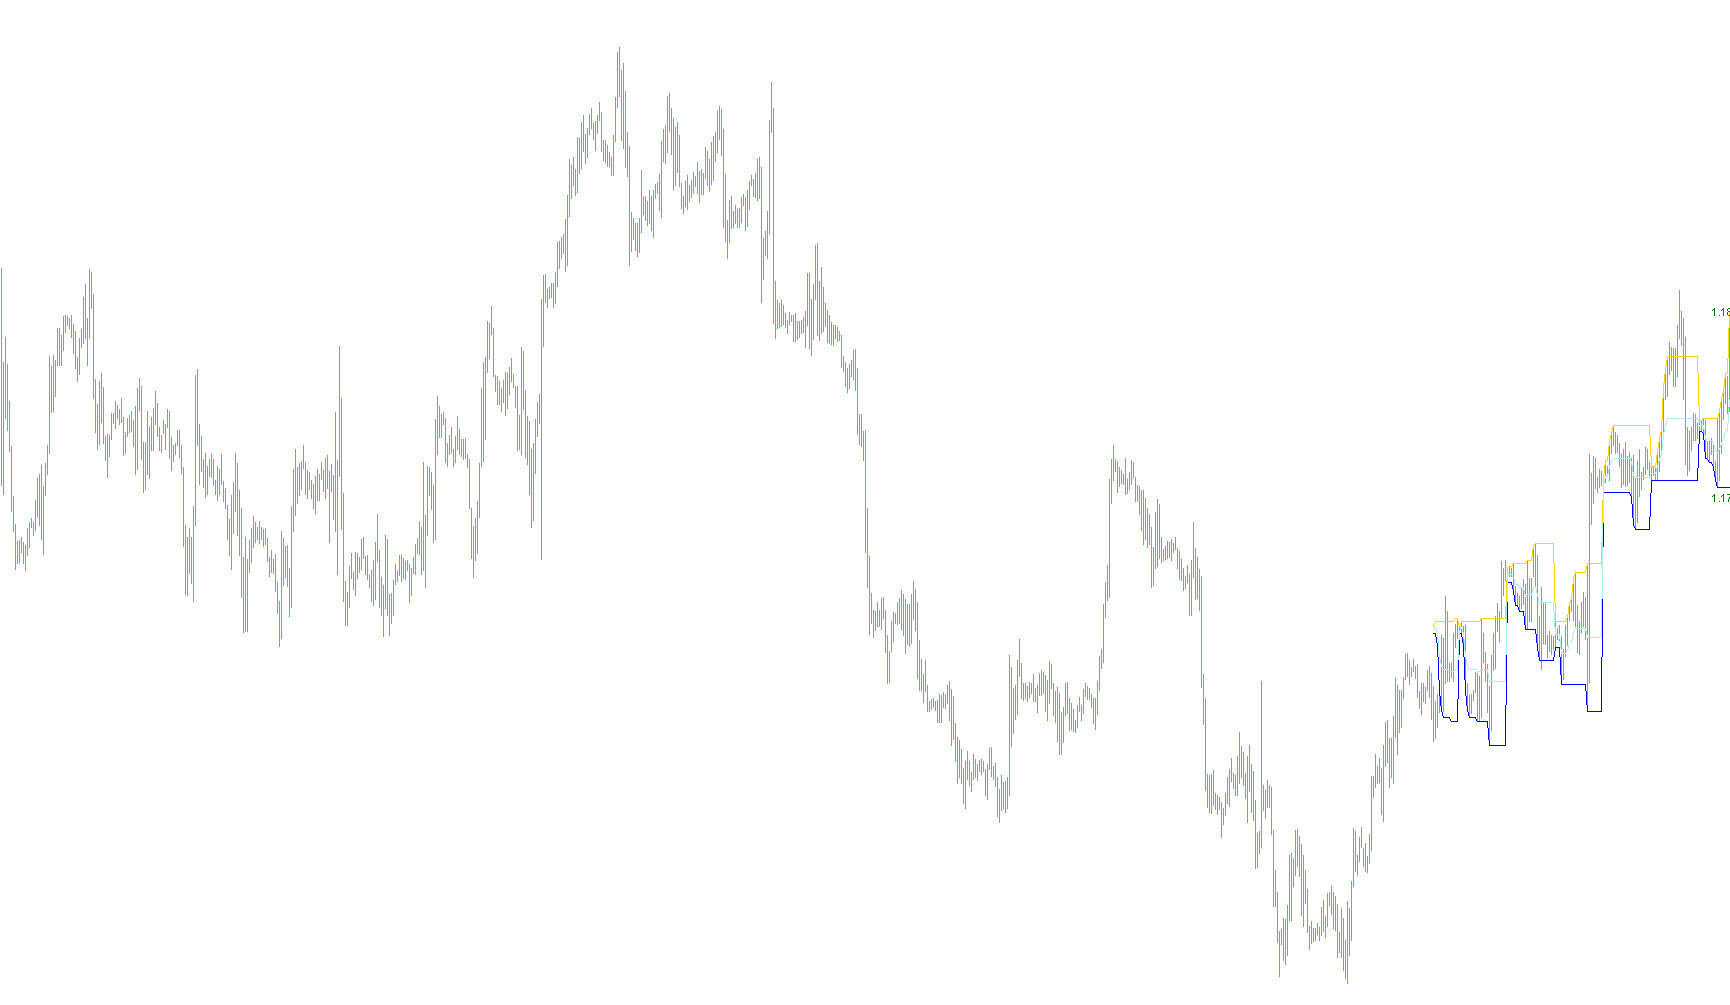
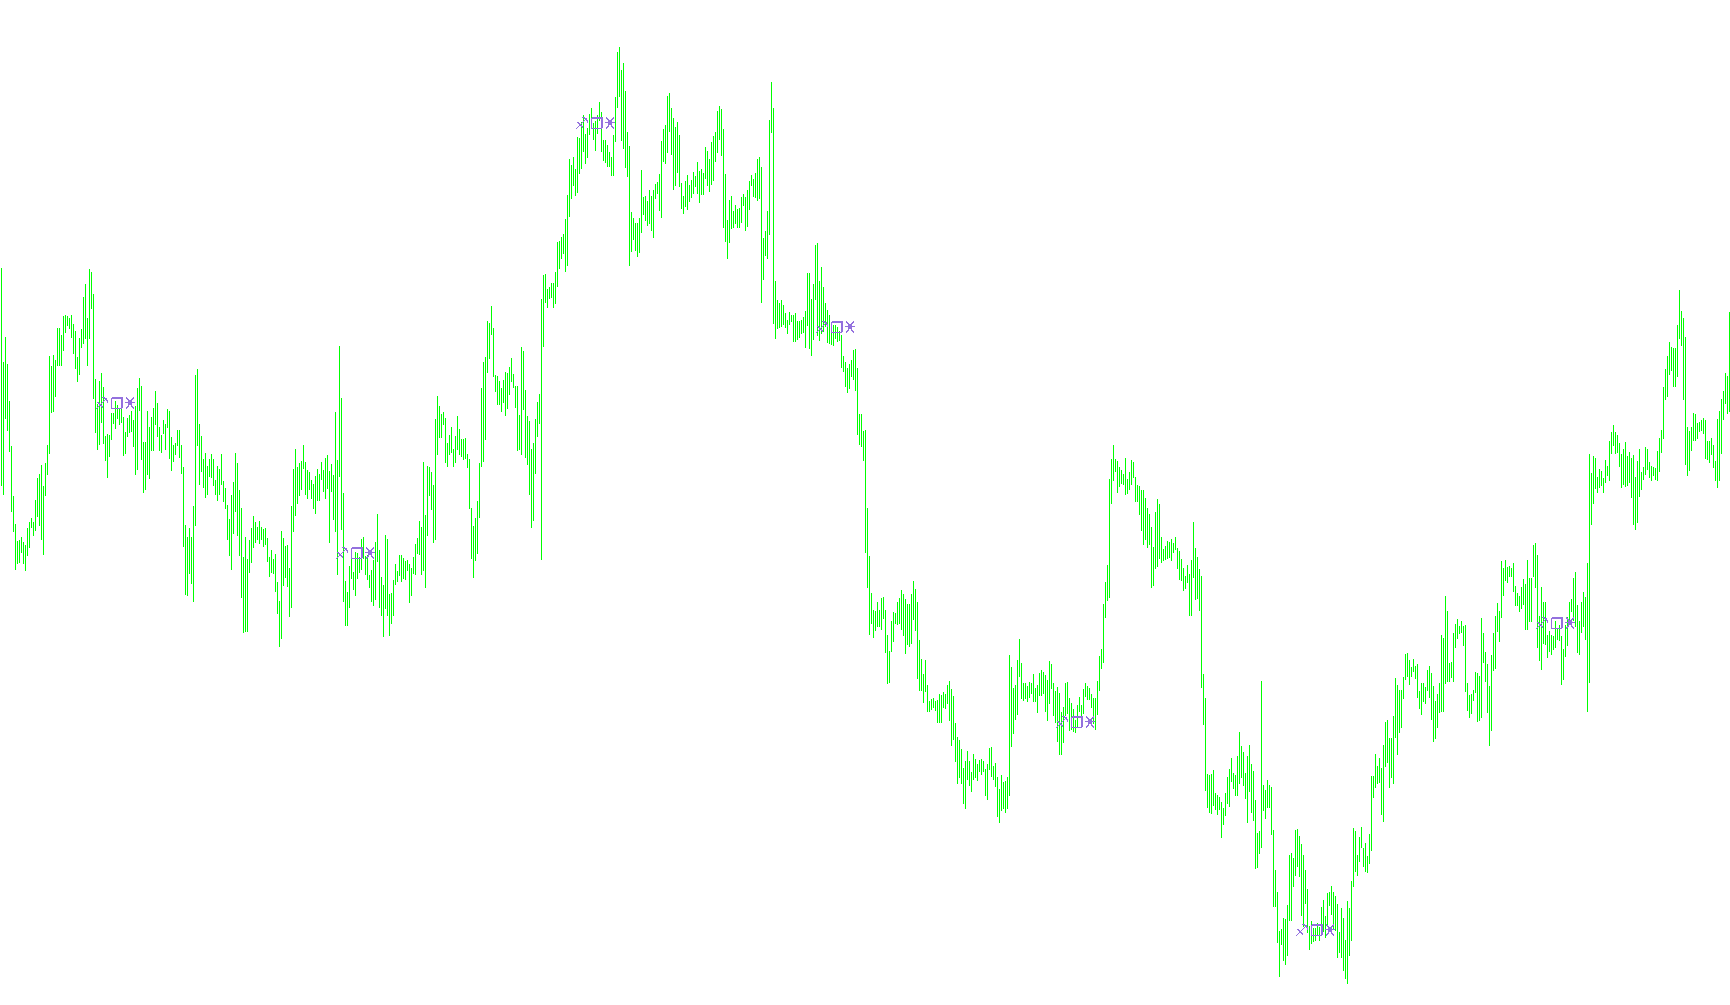
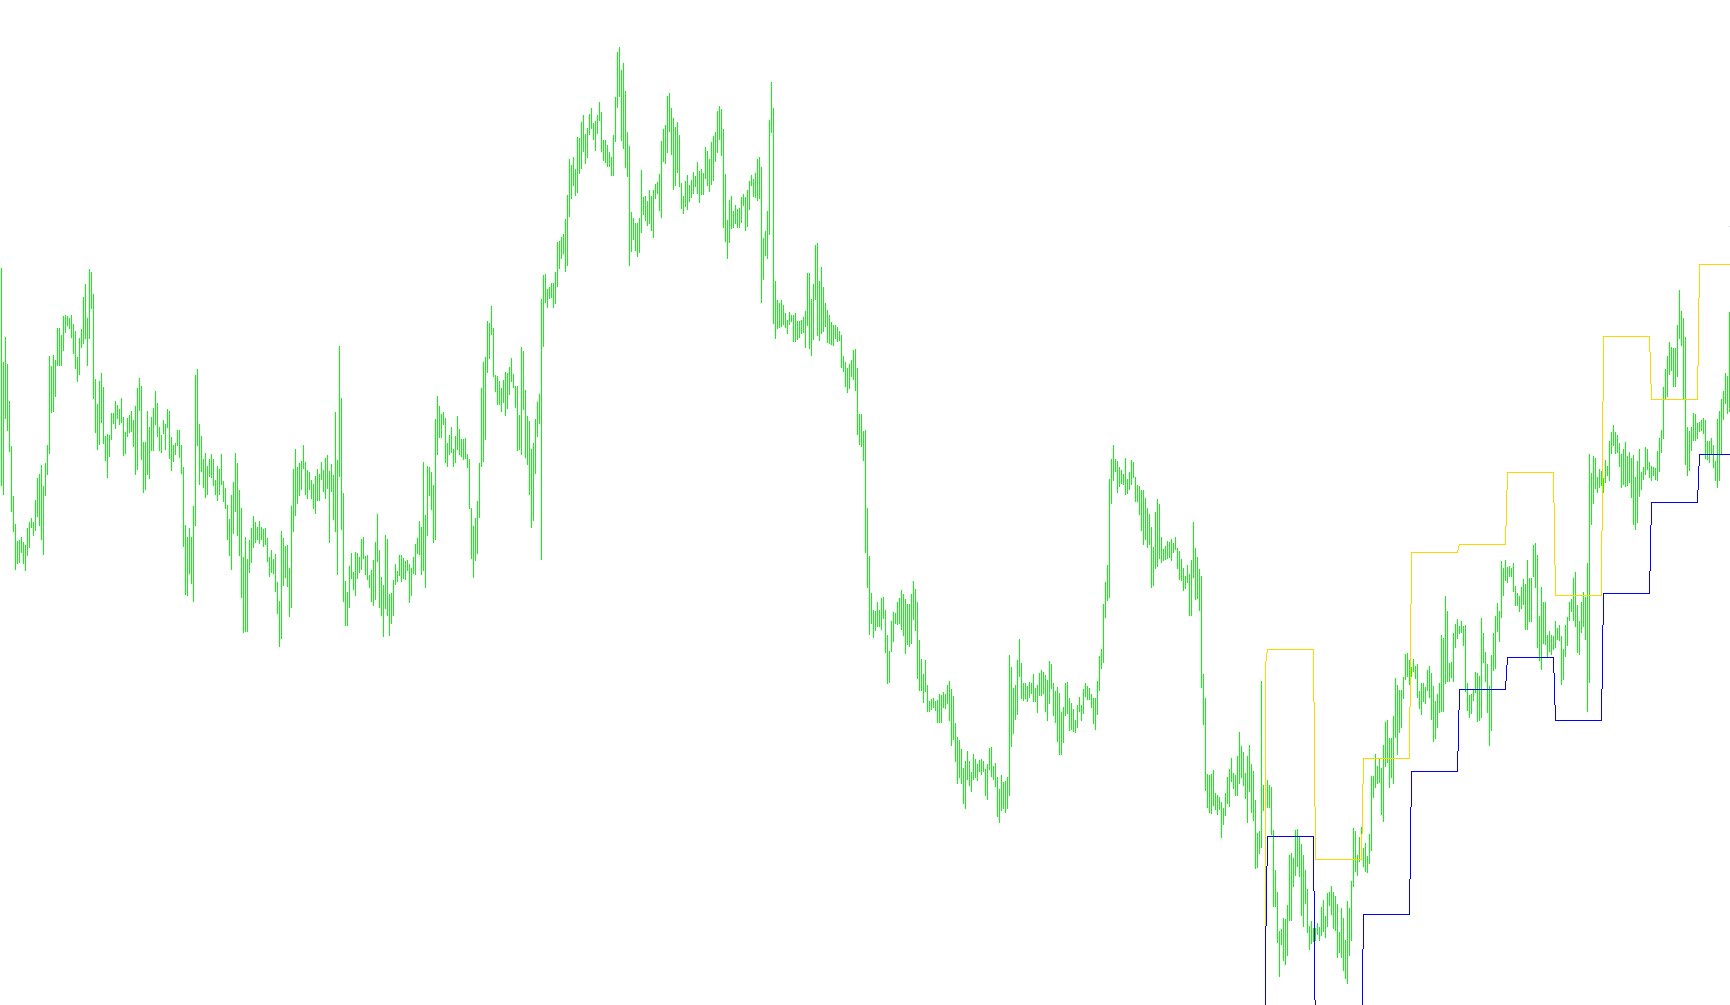
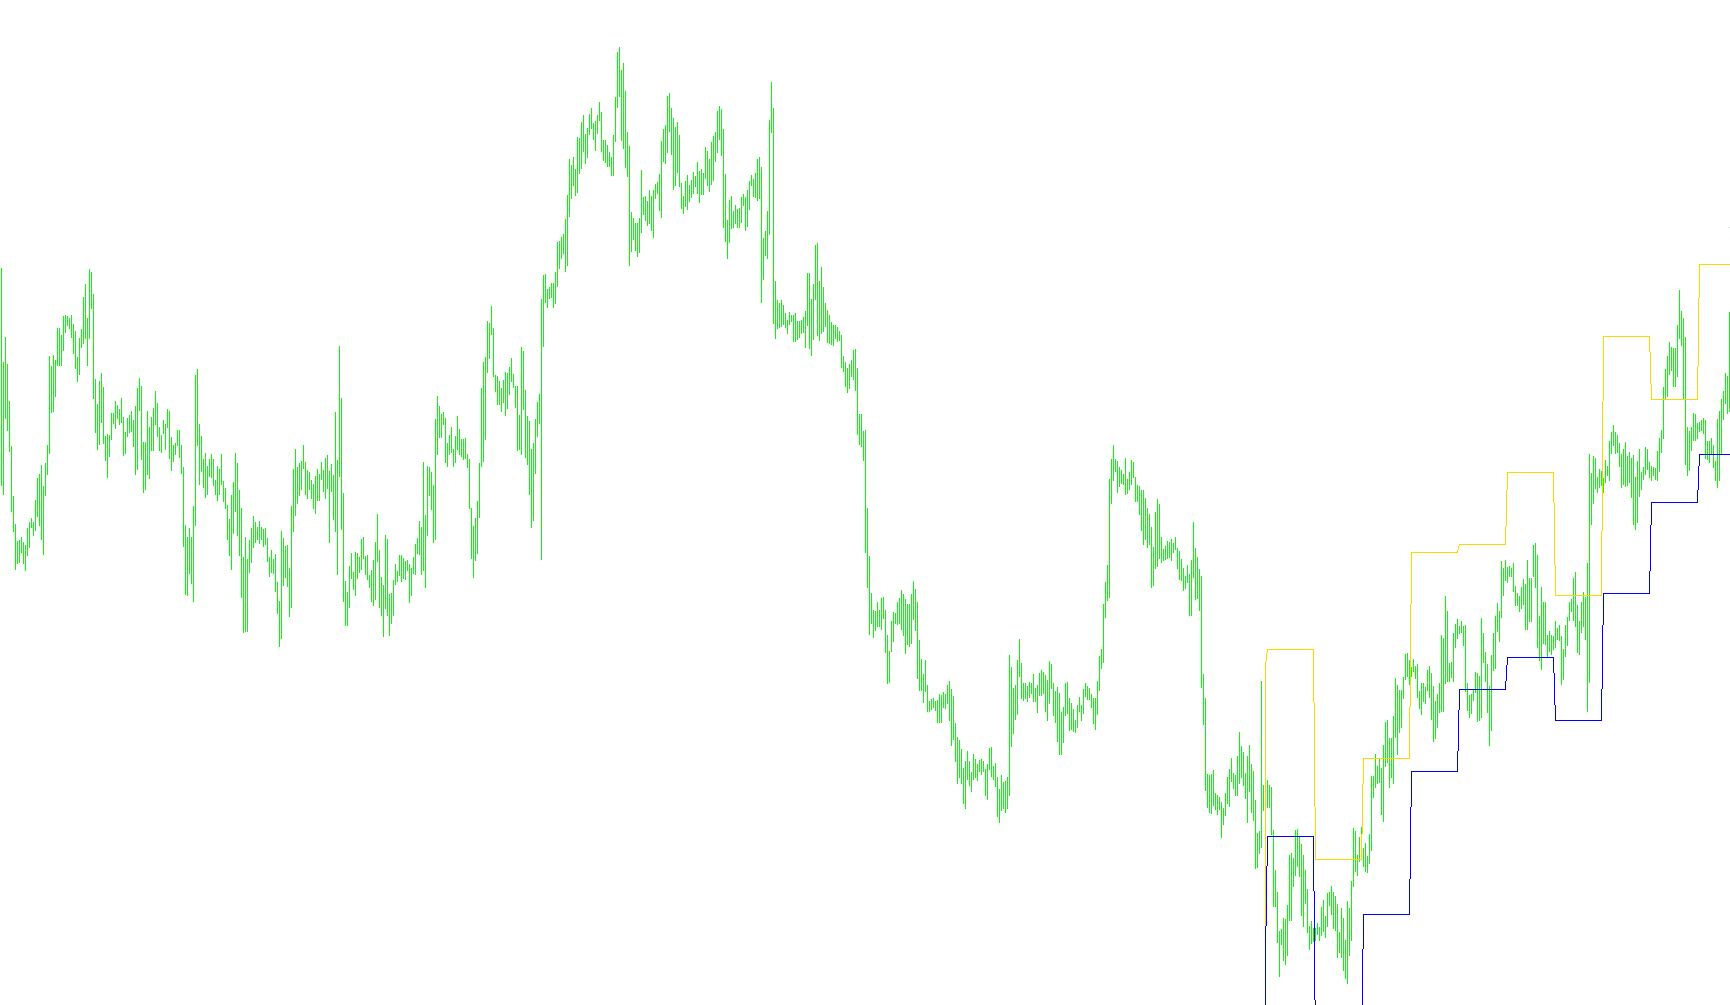
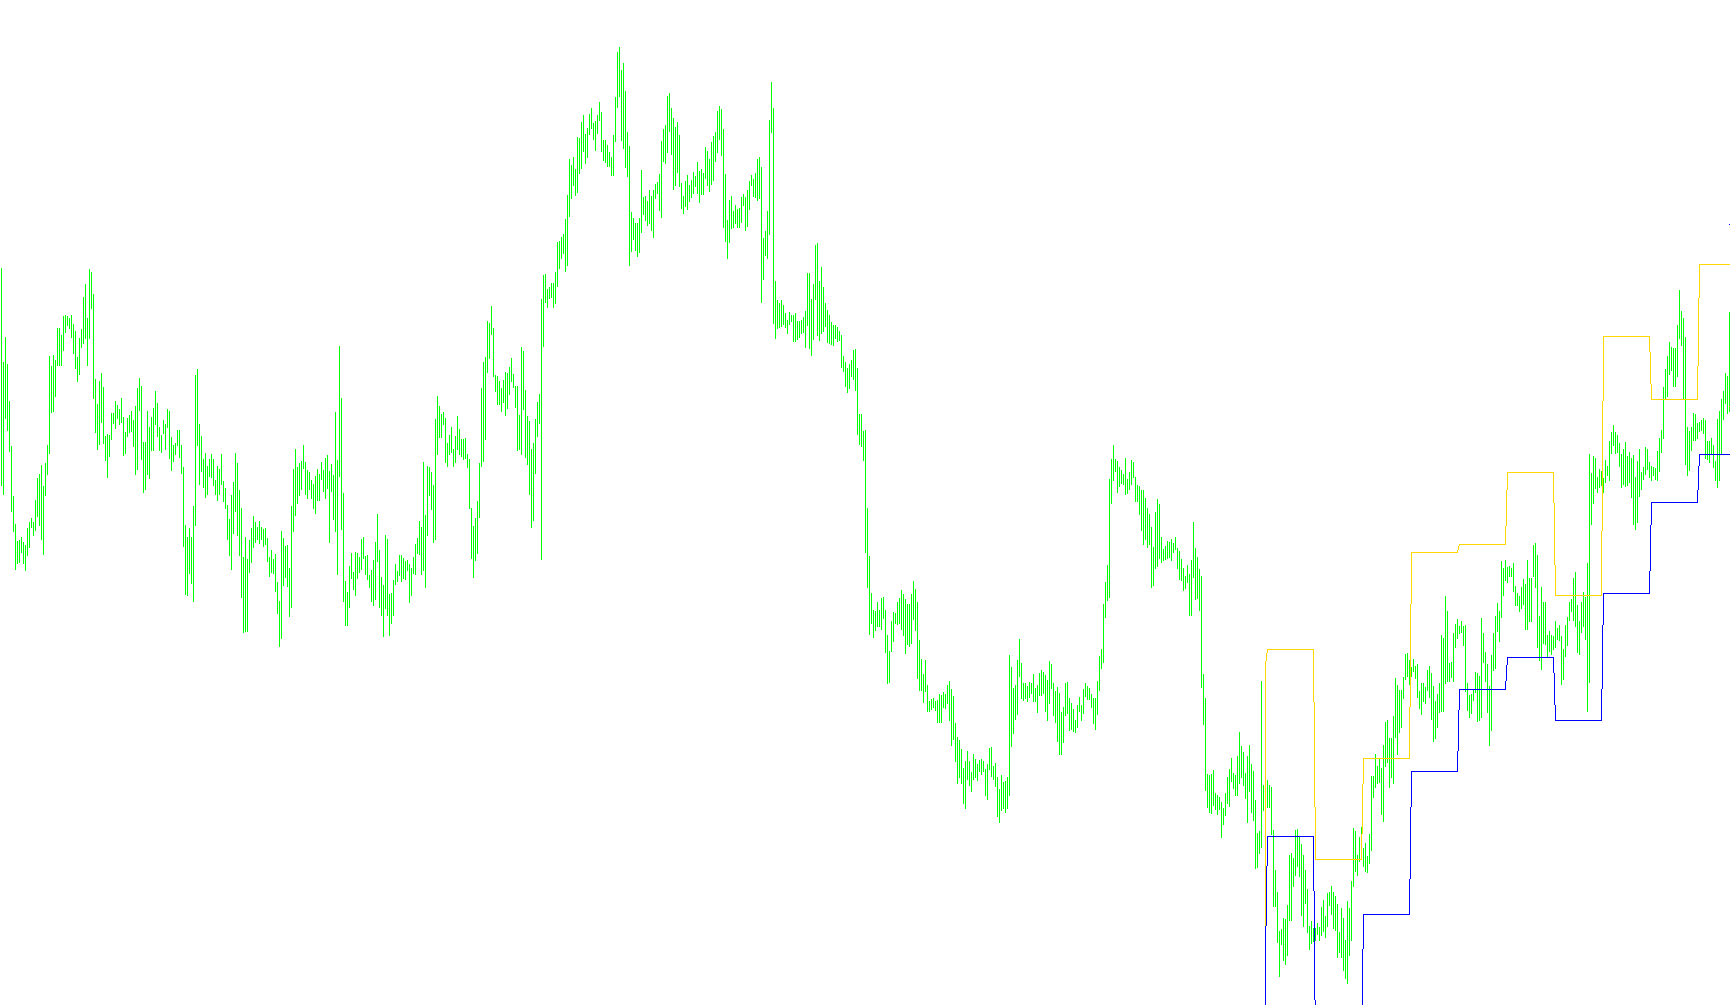
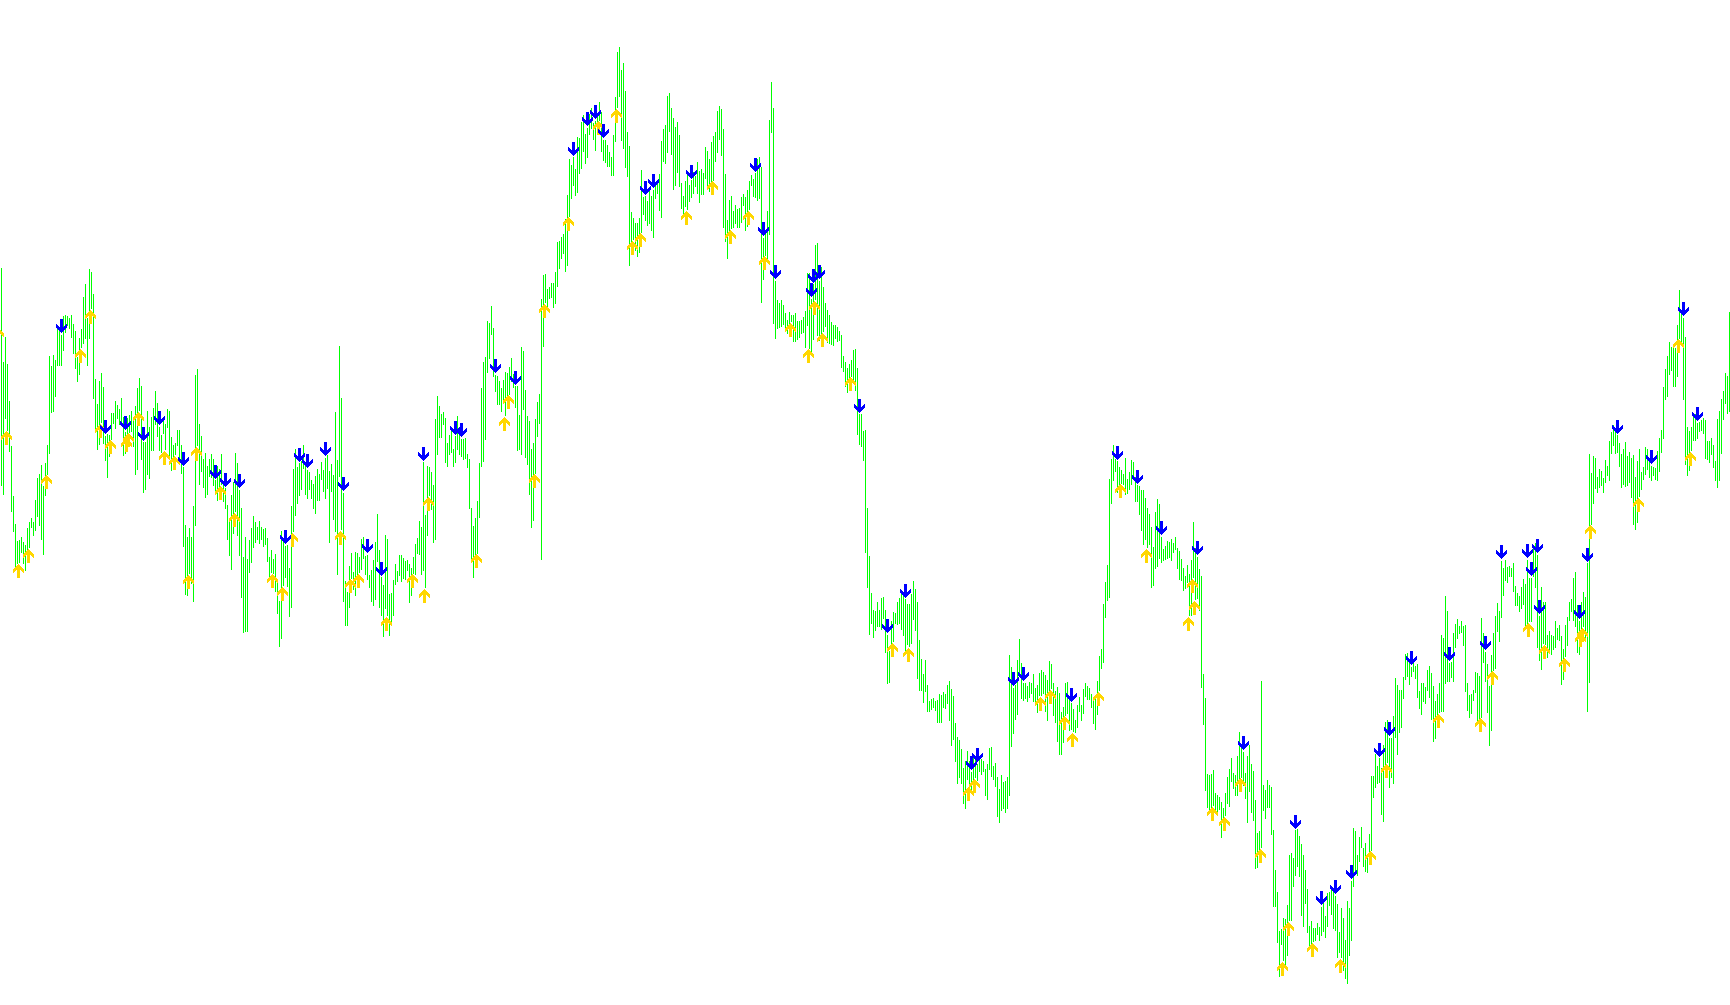
Hull_Style_ADX_v3
Indicator

Hull_Style_ADX_v3

iADXiMAOnArray

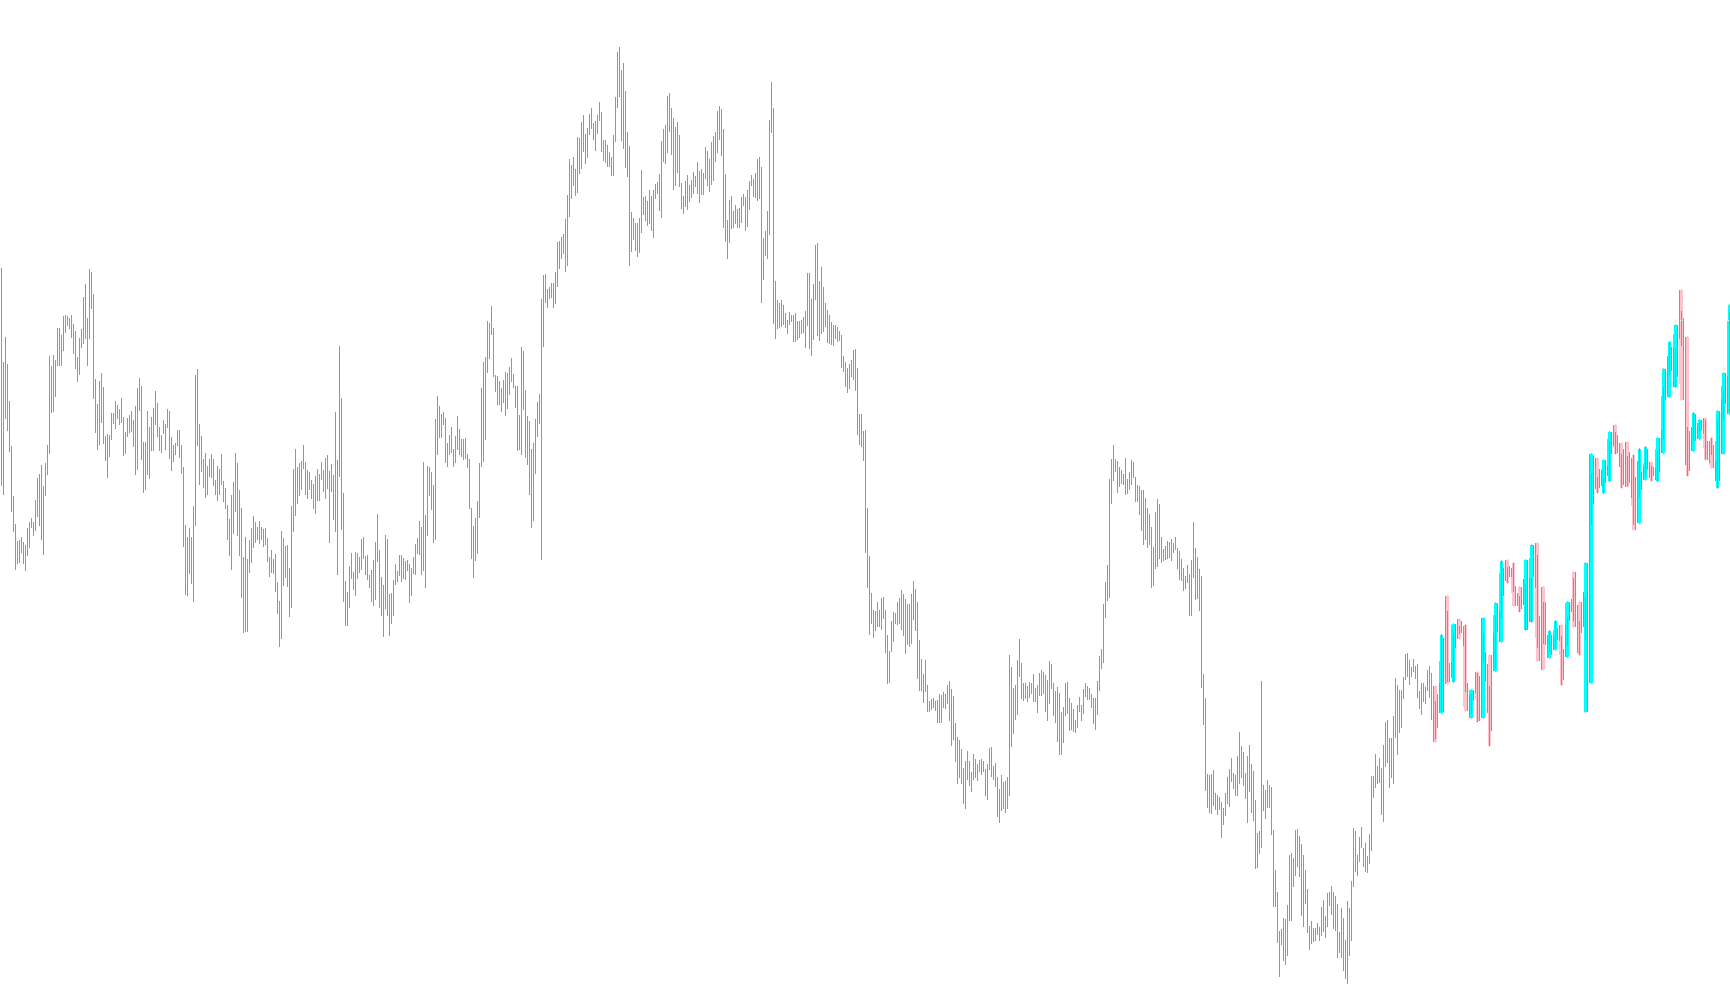
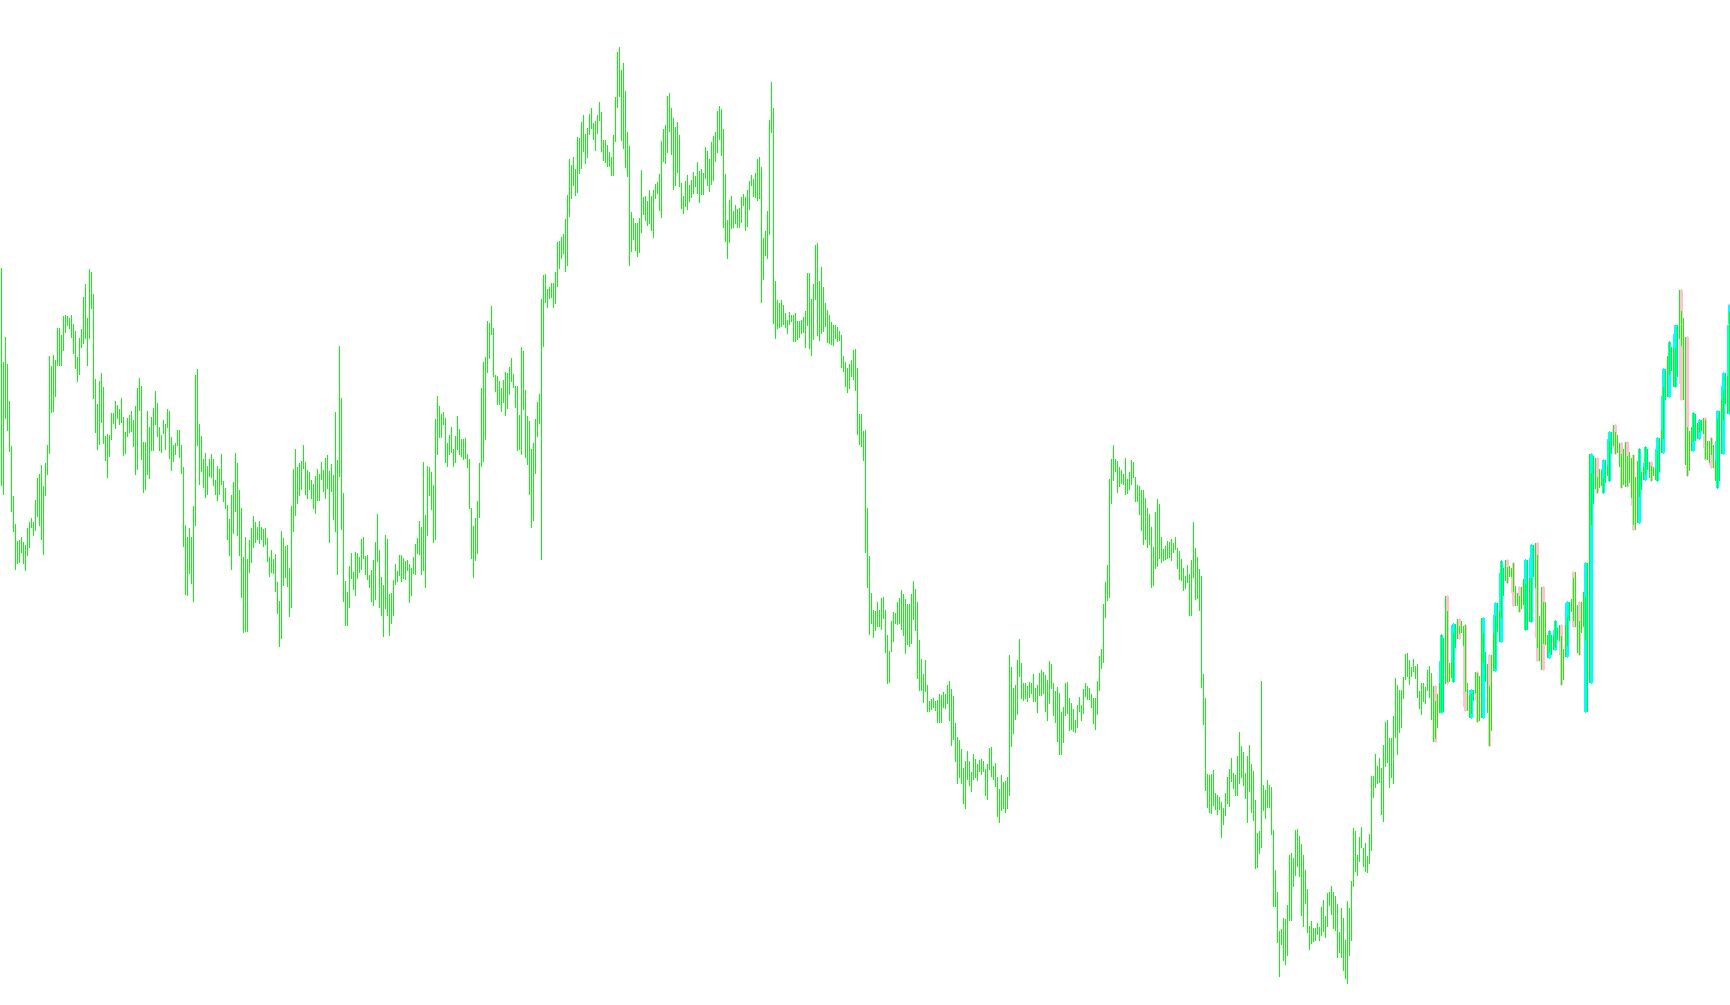
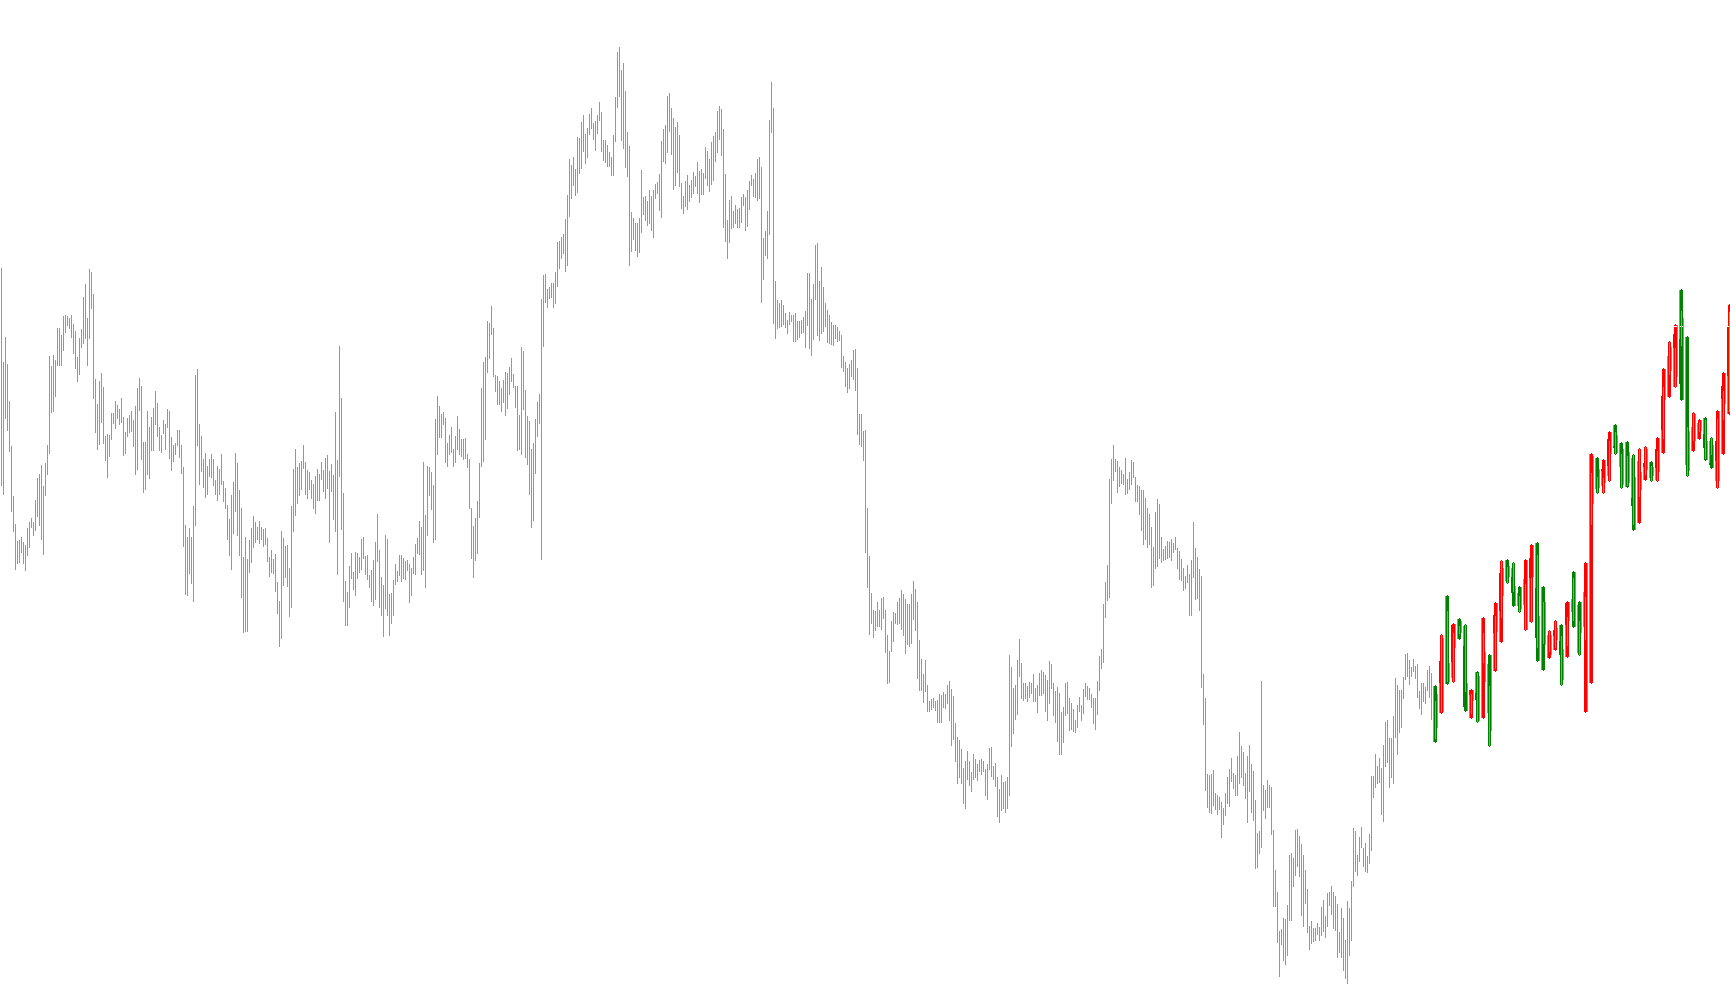
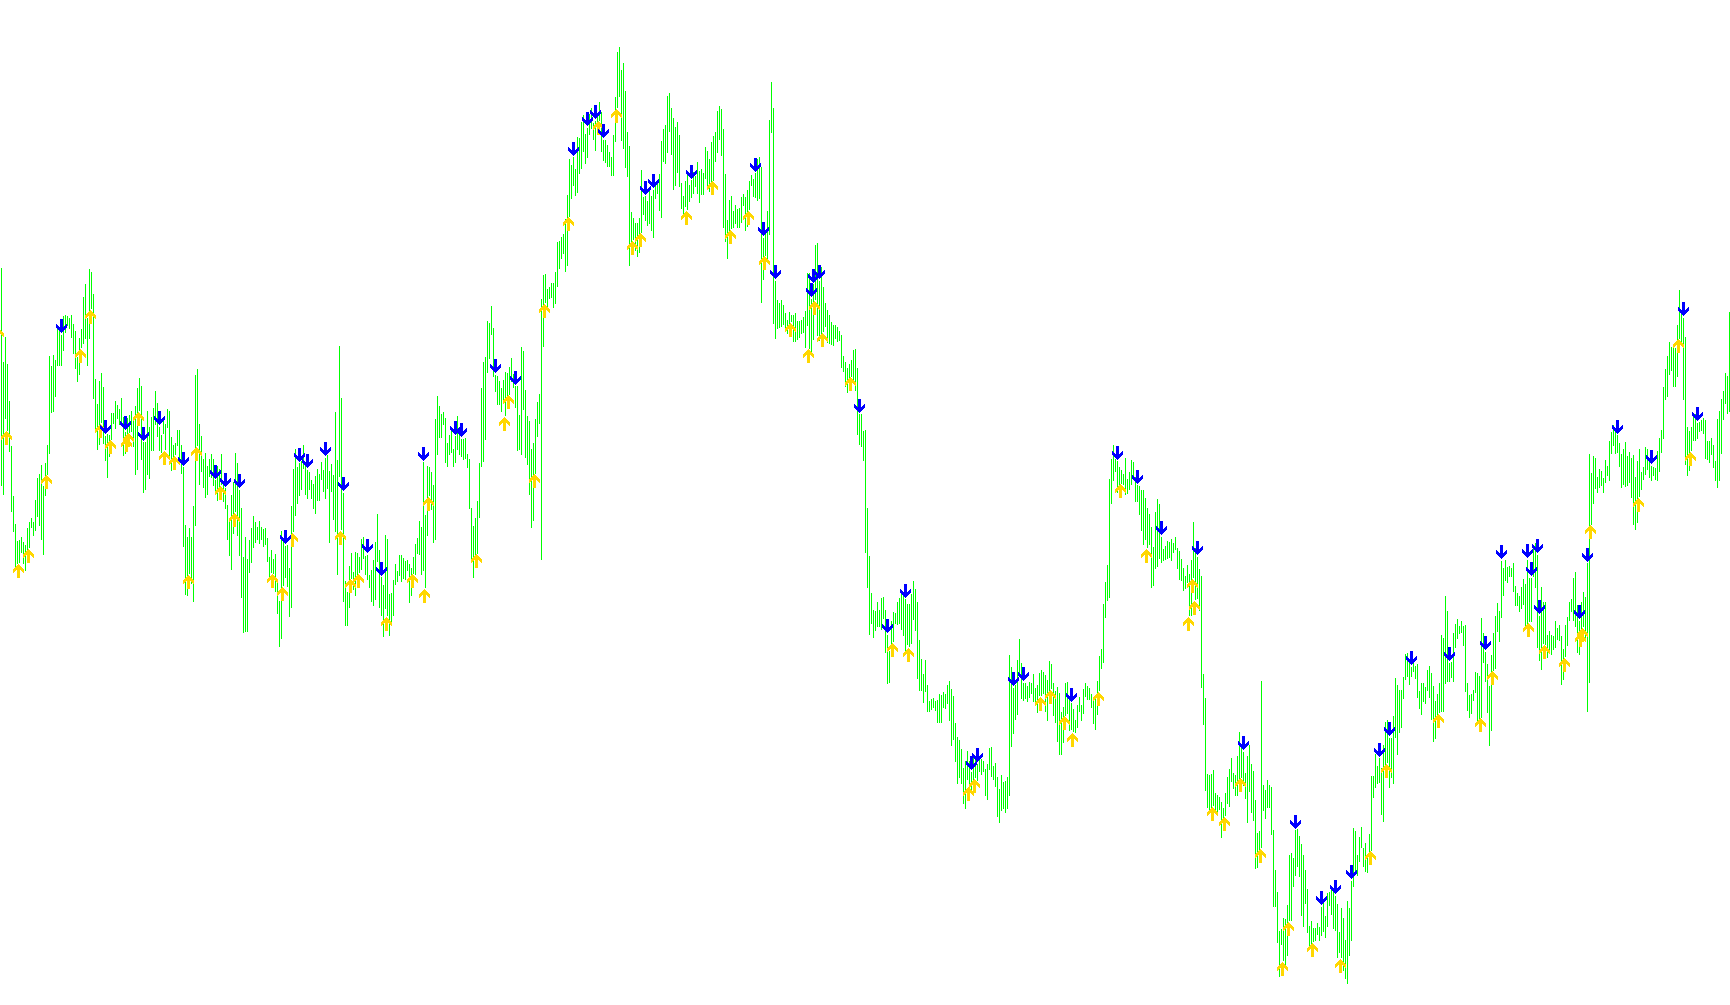
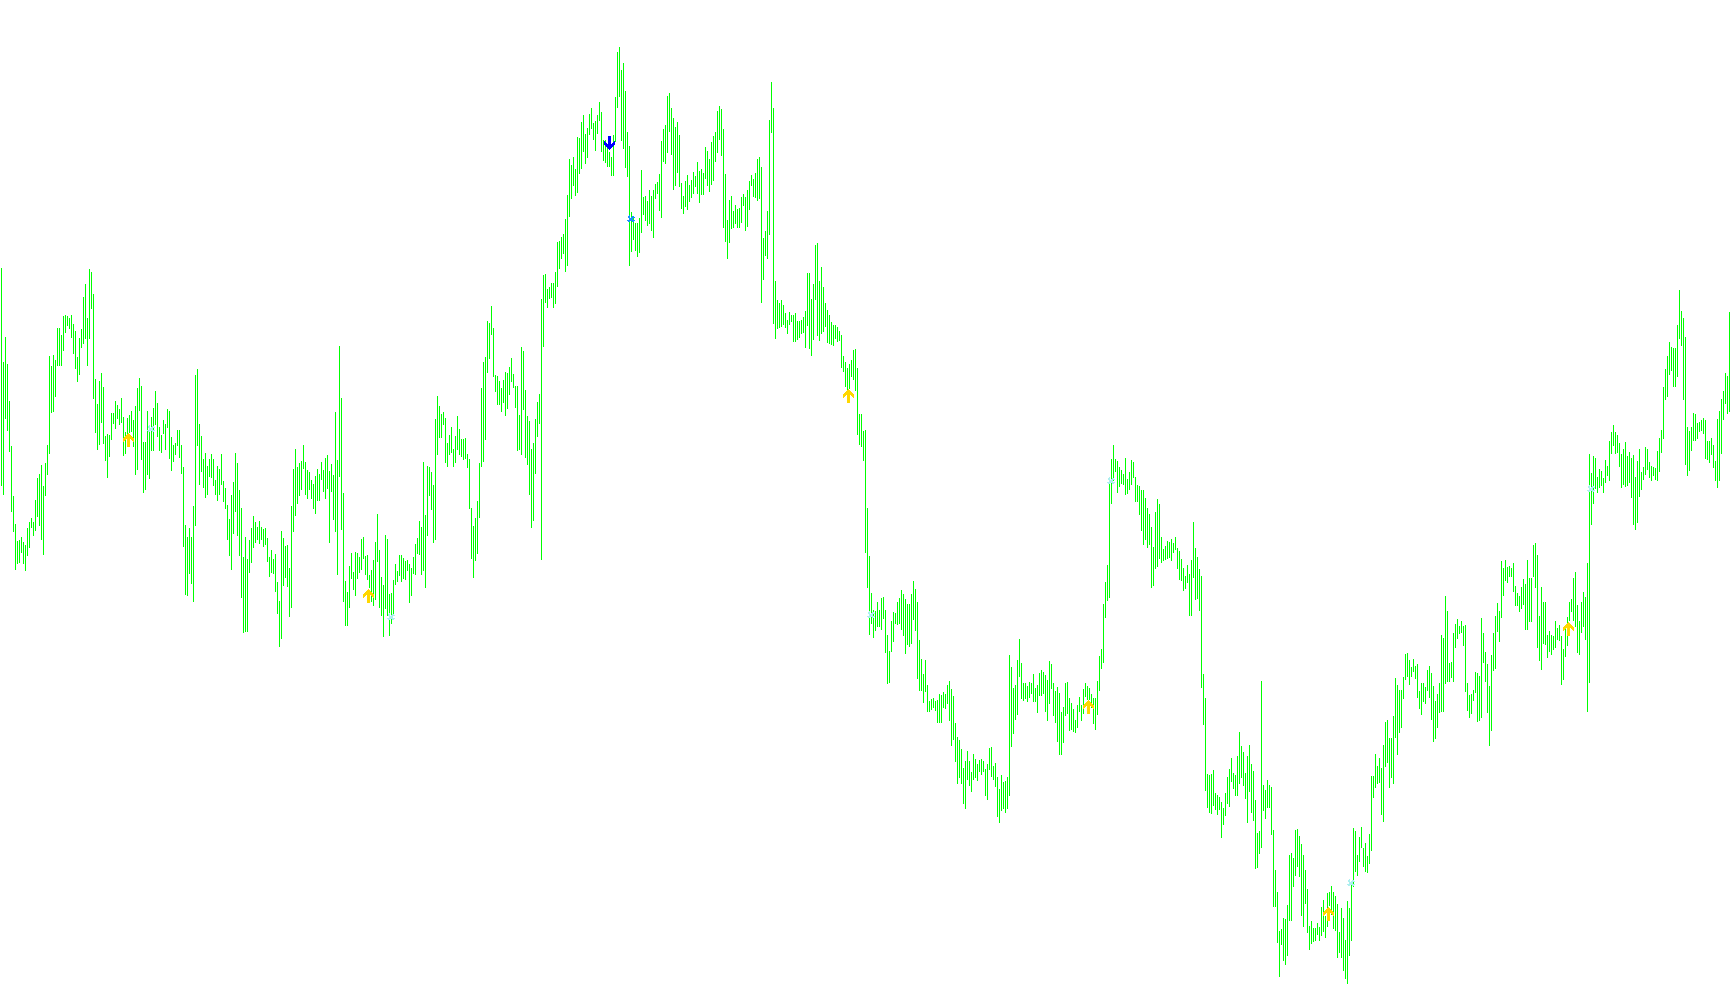
This indicator calculates a weighted moving average of differentiated ADX components to generate smoother trend strength and directional velocity signals.

Hull_Style_ATR
Indicator

Hull_Style_ATR

iATRiMAOnArray

This indicator synthesizes an accelerated ATR calculation with a multi-method moving average to smooth volatility fluctuations and identify momentum shifts.

Hull_Style_ATR_v1
Indicator

Hull_Style_ATR_v1

iATRiMAOnArray

This indicator calculates a volatility metric by applying a Hull Moving Average transformation to an ATR-based calculation to filter noise and identify momentum trends.

Hull_Trend
Indicator

Hull_Trend

iMAiMAOnArray

This indicator calculates the Hull Moving Average to identify trend direction and dynamically plots high-low boundaries based on momentum crossover thresholds.

humaverages
Indicator

humaverages

This indicator computes four distinct arithmetic and geometric smoothing algorithms—SMA, EMA, SMMA, and LWMA—to visualize price momentum and trend directionality.

Indicator

HVR 1[1].00

iMAOnArray
HVR test
Indicator

HVR test

iStdDev

This indicator calculates the ratio between short-term and long-term standard deviations to identify shifts in price velocity and expansion.

HVR
Indicator

HVR

This indicator calculates the ratio of short-term price variance to long-term price variance using natural logarithms of price changes.

i Trend
Indicator

i Trend

iBearsPoweriBandsiBullsPower

This indicator calculates the variance between current price action and Bollinger Band components while simultaneously quantifying directional momentum through a weighted sum of bullish and bearish power forces.

i Trend_v1
Indicator

i Trend_v1

iBearsPoweriBandsiBullsPower

This indicator calculates the variance between current price action and Bollinger Band components while correlating it with aggregate bull and bear power dynamics.

i-3SAR-Sig
Indicator

i-3SAR-Sig

iSAR

This indicator identifies momentum shifts by detecting price crossovers on a primary parabolic point combined with synchronized trend confirmations from two secondary historical periods.

i-5DaysOfTheWeek
Indicator

i-5DaysOfTheWeek

This indicator identifies and labels specific weekdays on the chart by detecting day-of-week transitions and rendering customizable text labels above high price points.

i-AMA-Optimum
Indicator

i-AMA-Optimum

This algorithm dynamically adjusts its smoothing coefficient by calculating the efficiency ratio of price movement relative to cumulative market noise.

i-AMA-Optimum_v1
Indicator

i-AMA-Optimum_v1

This indicator calculates an adaptive moving average by dynamically adjusting the smoothing factor based on the ratio of price volatility to market noise.

Indicator

i-AMMA

i-BalEq
Indicator

i-BalEq

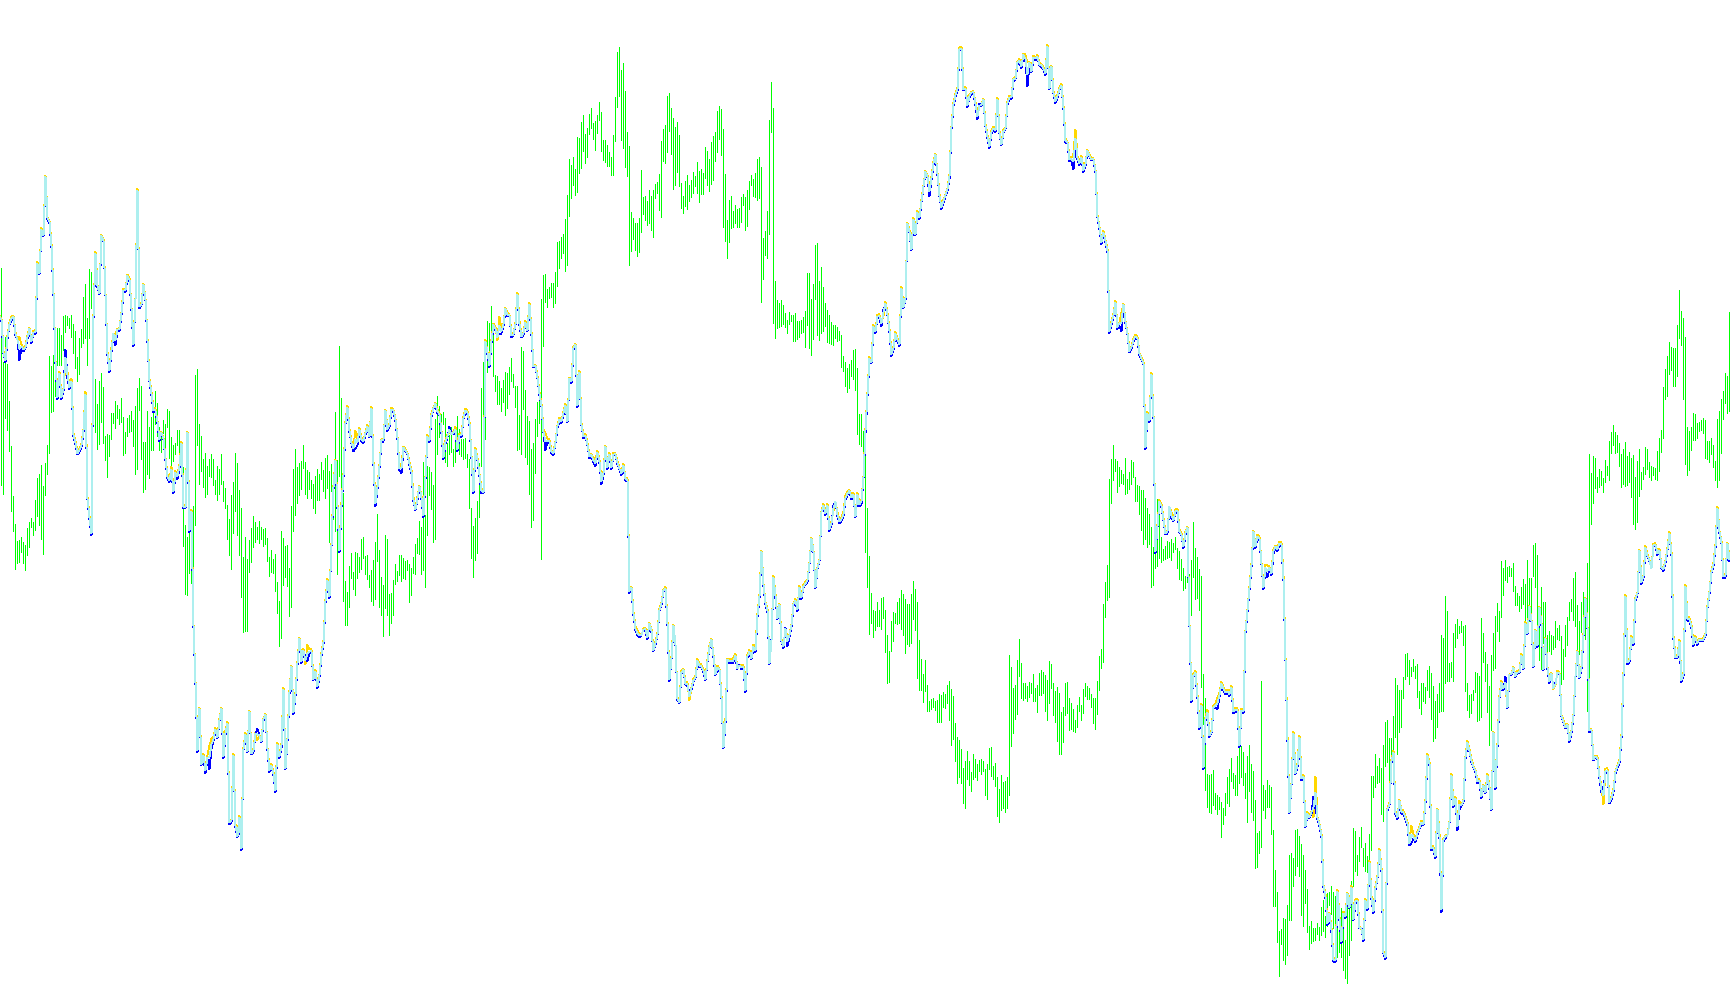
This indicator reconstructs historical account growth by calculating the real-time floating profit of open positions and the realized gains of closed trades across specific symbols.

i-BandsPrice
Indicator

i-BandsPrice

iMAiMAOnArray

This indicator quantifies the relative position of current price within Bollinger Band boundaries to produce a normalized value smoothed by an移動平均線 array.

i-BandsWidth
Indicator

i-BandsWidth

iMAiMAOnArray

This indicator quantifies market expansion by calculating the relative ratio between upper and lower Bollinger Band extremes against the moving average price.

i-BigBarsFromH1
Indicator

i-BigBarsFromH1

This indicator projects historical hourly candle bodies and shadows onto the current chart to provide a multi-timeframe structural overview.

i-BigBarsFromH1_v1
Indicator

i-BigBarsFromH1_v1

This indicator projects historical hourly price action onto the chart by visually clustering multiple candles into consolidated blocks based on user-defined periodicity.

i-BigBarsFromH1_v2
Indicator

i-BigBarsFromH1_v2

This indicator projects historical hourly candle bodies and shadows onto lower timeframes by calculating price extremes and temporal offsets.

i-Breakeven
Indicator

i-Breakeven

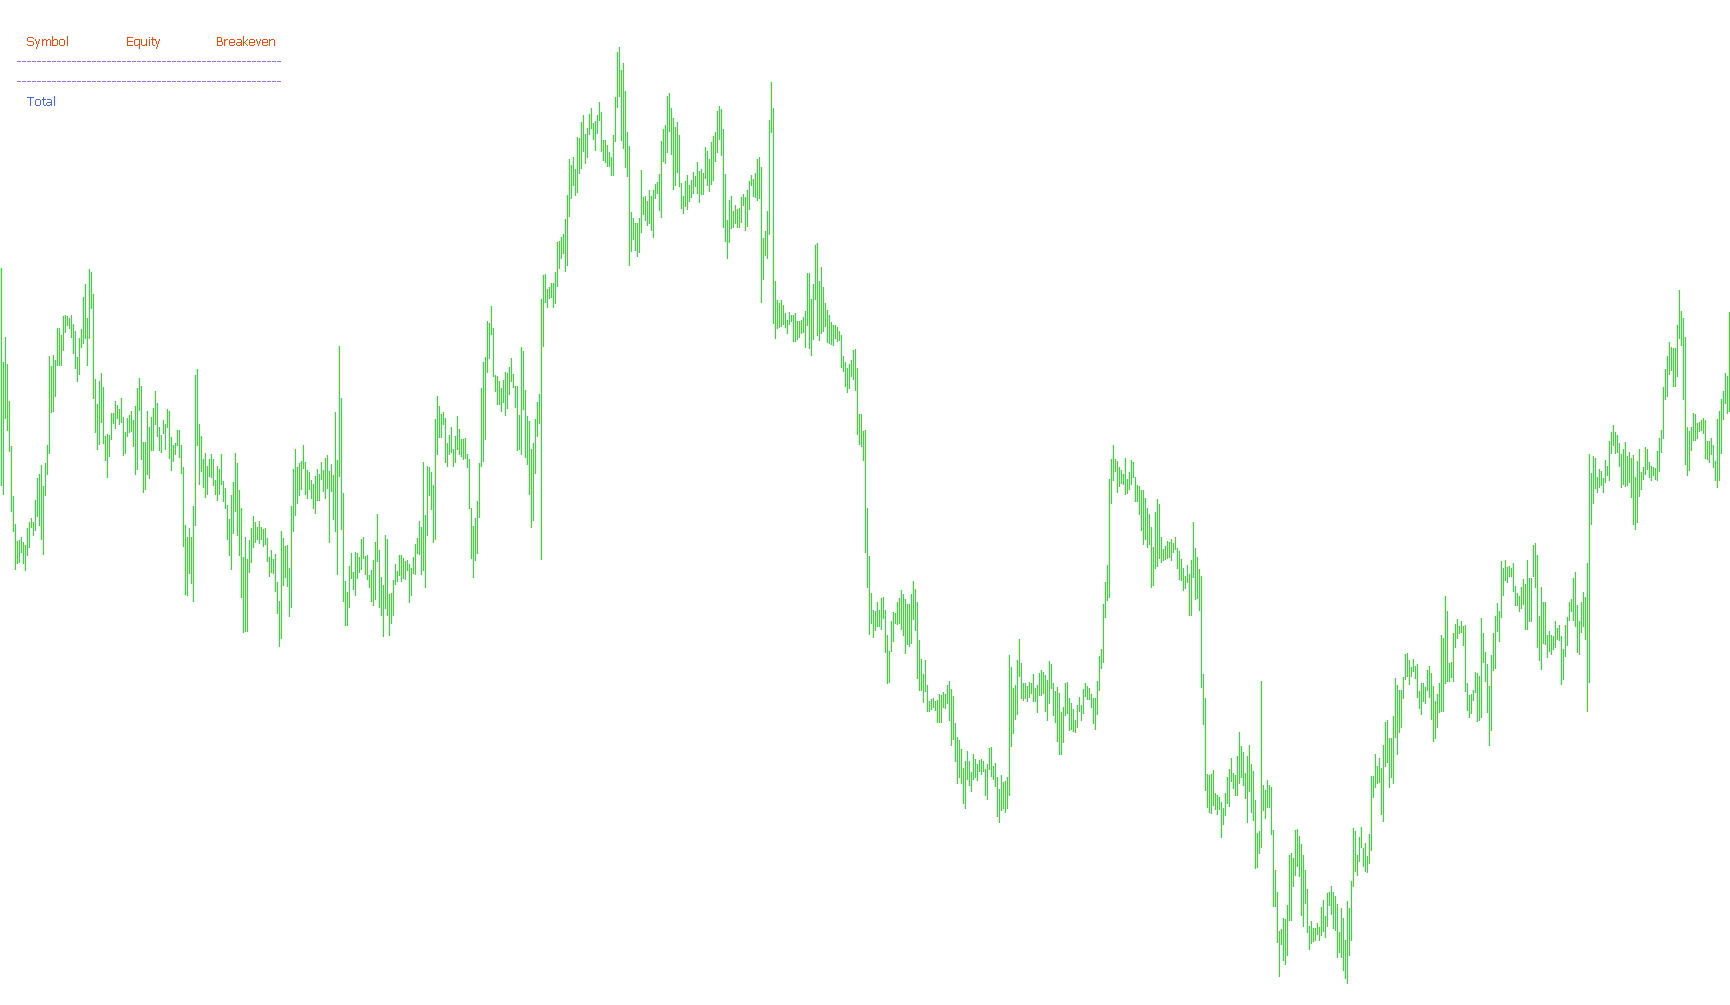
This indicator aggregates floating profits and costs across multiple currency pairs to calculate real-time break-even price levels and total portfolio equity.

i-Breakeven_EqPips
Indicator

i-Breakeven_EqPips

This indicator calculates real-time net equity and the specific price point required to reach a zero-profit balance for individual symbols and combined total exposure.

Indicator

i-CAi

iMAiStdDev
Indicator

i-CAi_v1

iMAiStdDev
i-Cross%26Main-maloma
Indicator

i-Cross%26Main-maloma

This indicator visualizes the mathematical relationship between a cross pair and the product of two primary base currencies to identify triangular arbitrage discrepancies.

i-Cross%26Main_m
Indicator

i-Cross%26Main_m

Visualizes the mathematical relationship between a cross pair and the product of two constituent base pairs to identify pricing inefficiencies.

i-Cross&Main
Indicator

i-Cross&Main

This indicator visualizes the price action of a cross currency pair alongside the real-time ratio of two primary base currencies to identify relative strength dynamics.

i-Cross&Main_v1
Indicator

i-Cross&Main_v1

This indicator visualizes the direct closing price of a cross currency alongside the mathematical product of two constituent base pairs to identify structural interdependencies.

i-Cross_Main
Indicator

i-Cross_Main

This indicator visualizes the relationship between a cross pair and the product of its two component base currencies to identify structural discrepancies.

i-DayOfWeek(1)
Indicator

i-DayOfWeek(1)

This indicator identifies and marks specific days of the week on the chart by projecting visual arrows based on daily high and low price boundaries.

i-DayOfWeek
Indicator

i-DayOfWeek

This indicator identifies specific days of the week by plotting visual markers at the high and low price levels of the corresponding daily candles.

i-dayofweek_205
Indicator

i-dayofweek_205

This indicator identifies and highlights specific days of the week by plotting visual arrows based on daily high and low price boundaries.

i-DayRange
Indicator

i-DayRange

This indicator dynamically maps historical daily price extremes to project high, low, and median equilibrium corridors with user-defined volatility caps.

Indicator

i-DayRange1

Indicator

i-DayRange_v1

i-days_of_the_week
Indicator

i-days_of_the_week

An on-chart visual overlay that dynamically annotates specific trading days of the week with customizable colors and labels based on historical candle data.

i-Divergency
Indicator

i-Divergency

iStochastic

The algorithm identifies potential trend exhaustion by detecting directional conflicts between Stochastic oscillator peak slopes and actual price action extremes.

i-DivMACD
Indicator

i-DivMACD

iMACD

This indicator identifies structural price discrepancies by comparing the slope of MACD momentum peaks against corresponding price action extrema.

i-DRProjections_v[1][1].0.1
Indicator

i-DRProjections_v[1][1].0.1

This indicator calculates potential future price boundaries by extrapolating the weighted average of daily high, low, open, and close prices based on the DeMarki theory.

i-DRProjections_v[1][1].0.1_v1
Indicator

i-DRProjections_v[1][1].0.1_v1

This indicator calculates potential price boundaries by extrapolating the previous days' high, low, open, and close values to project expected trading ranges for the current session.

i-DRProjections_v[1][1].0.1_v2
Indicator

i-DRProjections_v[1][1].0.1_v2

This indicator calculates projected price boundaries by applying Thomas DeMark's methodology to historical daily high, low, open, and close data to forecast potential volatility limits.

i-Example-Add
Indicator

i-Example-Add

iMACD

This indicator identifies entry and exit points by synthesizing MACD crossover mechanics, trend exhaustion reversals, and price-momentum divergence detection.

i-Fractals-3172552-sig
Indicator

i-Fractals-3172552-sig

The indicator identifies potential trend reversals by detecting multi-point fractal structures, double tops, and double bottoms based on relative shadow deviations and candle body thresholds.

i-Fractals-3172552-sig_v1
Indicator

i-Fractals-3172552-sig_v1

This indicator identifies potential trend reversals by detecting specific structural patterns including unconfirmed, double, and long-bar fractal geometries based on relative price extremes and candle body proportions.

i-Fractals-3172552-sig_v2
Indicator

i-Fractals-3172552-sig_v2

This indicator identifies potential trend reversals by detecting specific structural price patterns, including asymmetric fractal peaks, double tops/bottoms, and elongated bar body momentum.

Indicator

i-FractalsEx

i-Friday_Sig(1)
Indicator

i-Friday_Sig(1)

The indicator identifies specific entry and exit signals based on the relationship between the previous day's opening and closing prices during Friday trading sessions.

i-Friday_Sig
Indicator

i-Friday_Sig

Identifies potential trade entries and exits based on the opening and closing price relationship of the previous daily candle specifically during Friday trading sessions.

i-Friday_Sig_v1
Indicator

i-Friday_Sig_v1

This indicator identifies potential reversal points by analyzing daily candle dynamics specifically during designated high-impact Friday hourly windows.