HMA - Ogeima
Download script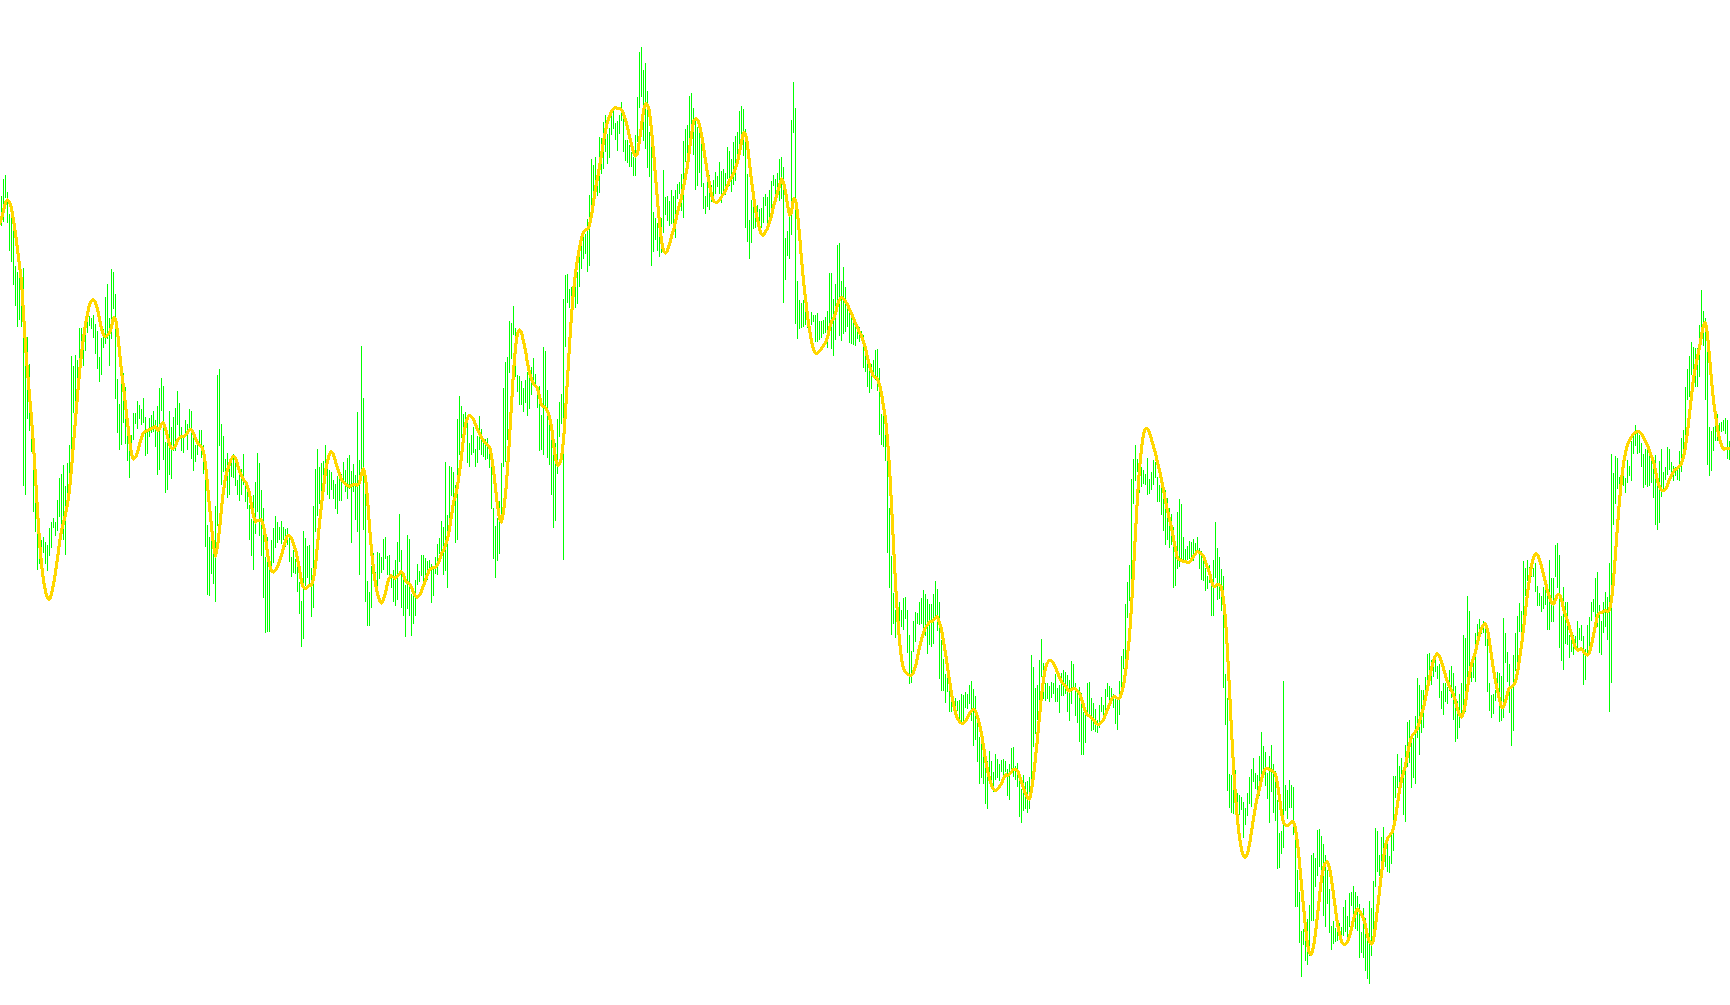
This tool is designed to provide traders with a smoothed visual representation of market trends, helping to identify the underlying momentum of an asset by filtering out minor price fluctuations.
Core Logic and Methodology
The script functions by calculating the difference between two distinct moving averages. Instead of simply showing you one line, it compares a "fast" moving average against a "slow" moving average to determine the distance or gap between them.
Here is the step-by-step breakdown of how that information is processed:
- Calculating the Gap: The tool looks at two different time horizons based on your settings. It takes the faster data point, multiplies it by a specific factor, and then subtracts the slower data point from it. This calculation highlights the "stretch" or momentum between short-term and long-term price movements.
- Smoothing the Data: Because raw calculations can often appear jagged or "noisy," the script applies a secondary smoothing layer to the results. It uses a mathematical power function to refine the data, ensuring that the resulting line on your chart is fluid and easier to read.
- Dynamic Adaptation: The indicator is built to be flexible. It allows for adjustments in how many bars of history are analyzed (Period), how much weight to give to the fast average (Factor), and how aggressively the smoothing should be applied.
Visual Interpretation
The final result is a single, continuous line displayed on your chart. Rather than just showing you where the price is, this indicator helps reveal the strength and direction of the current trend. When the line moves significantly, it suggests a stronger pull in one direction; when it flattens out, it may indicate a period of consolidation or a potential shift in market sentiment.
//+------------------------------------------------------------------+
//|                                                 HMA - Ogeima.mq4 |
//|                                         Copyright © 2006, Ogeima |
//|                                             ph_bresson@yahoo.com |
//|                                 Develloped on request for FXiGoR |
//+------------------------------------------------------------------+
#property copyright "Copyright © 2006, Ogeima & FXiGoR"
#property link      "ph_bresson@yahoo.com"

#property indicator_chart_window
#property indicator_buffers 5
#property indicator_color1 MediumBlue
#property indicator_color2 SkyBlue
#property indicator_color3 SkyBlue
#property indicator_color4 SkyBlue
#property indicator_color5 SkyBlue
//---- input parameters
extern double    period=20;
extern double    factor=2.0;
extern double    period_divider=2.0;
extern double    smoothing_power=0.5;
extern int       method=3;
extern int       price=0;
extern int       time_frame = 0;
//---- buffers
double ExtMapBuffer1[];

//+------------------------------------------------------------------+
//| Custom indicator initialization function                         |
//+------------------------------------------------------------------+
int init()
  {
//---- indicators
   SetIndexStyle(0,DRAW_LINE, STYLE_SOLID, 3);
   SetIndexBuffer(0,ExtMapBuffer1);
//----
   return(0);
  }
//+------------------------------------------------------------------+
//| Custom indicator deinitialization function                       |
//+------------------------------------------------------------------+
int deinit()
  {
//----

//----
   return(0);
  }
//+------------------------------------------------------------------+
//| Custom indicator iteration function                              |
//+------------------------------------------------------------------+
int start()
{
   int    counted_bars=IndicatorCounted();

   if(counted_bars < 0)
   return(-1);

   int x      = 0;
   int power  = MathPow(period, smoothing_power);
   int e      = Bars - counted_bars + period + 1;

   double vect[], trend[];

   if(e > Bars)   e = Bars;

   ArrayResize(vect, e);
   ArraySetAsSeries(vect, true);

   for(x = 0; x < e; x++)

      vect[x] = factor*iMA(NULL,time_frame, period/period_divider, 0, method, price, x)-iMA(NULL, 0, period, 0, method, price, x);

   for(x = 0; x < e-period; x++)

      ExtMapBuffer1[x] = iMAOnArray(vect, 0, power, 0, method, x);

   return(0);
  }
//+------------------------------------------------------------------+
Comments