Hist_StepMA_Stoch_KV1_Ex_03_v2
Download script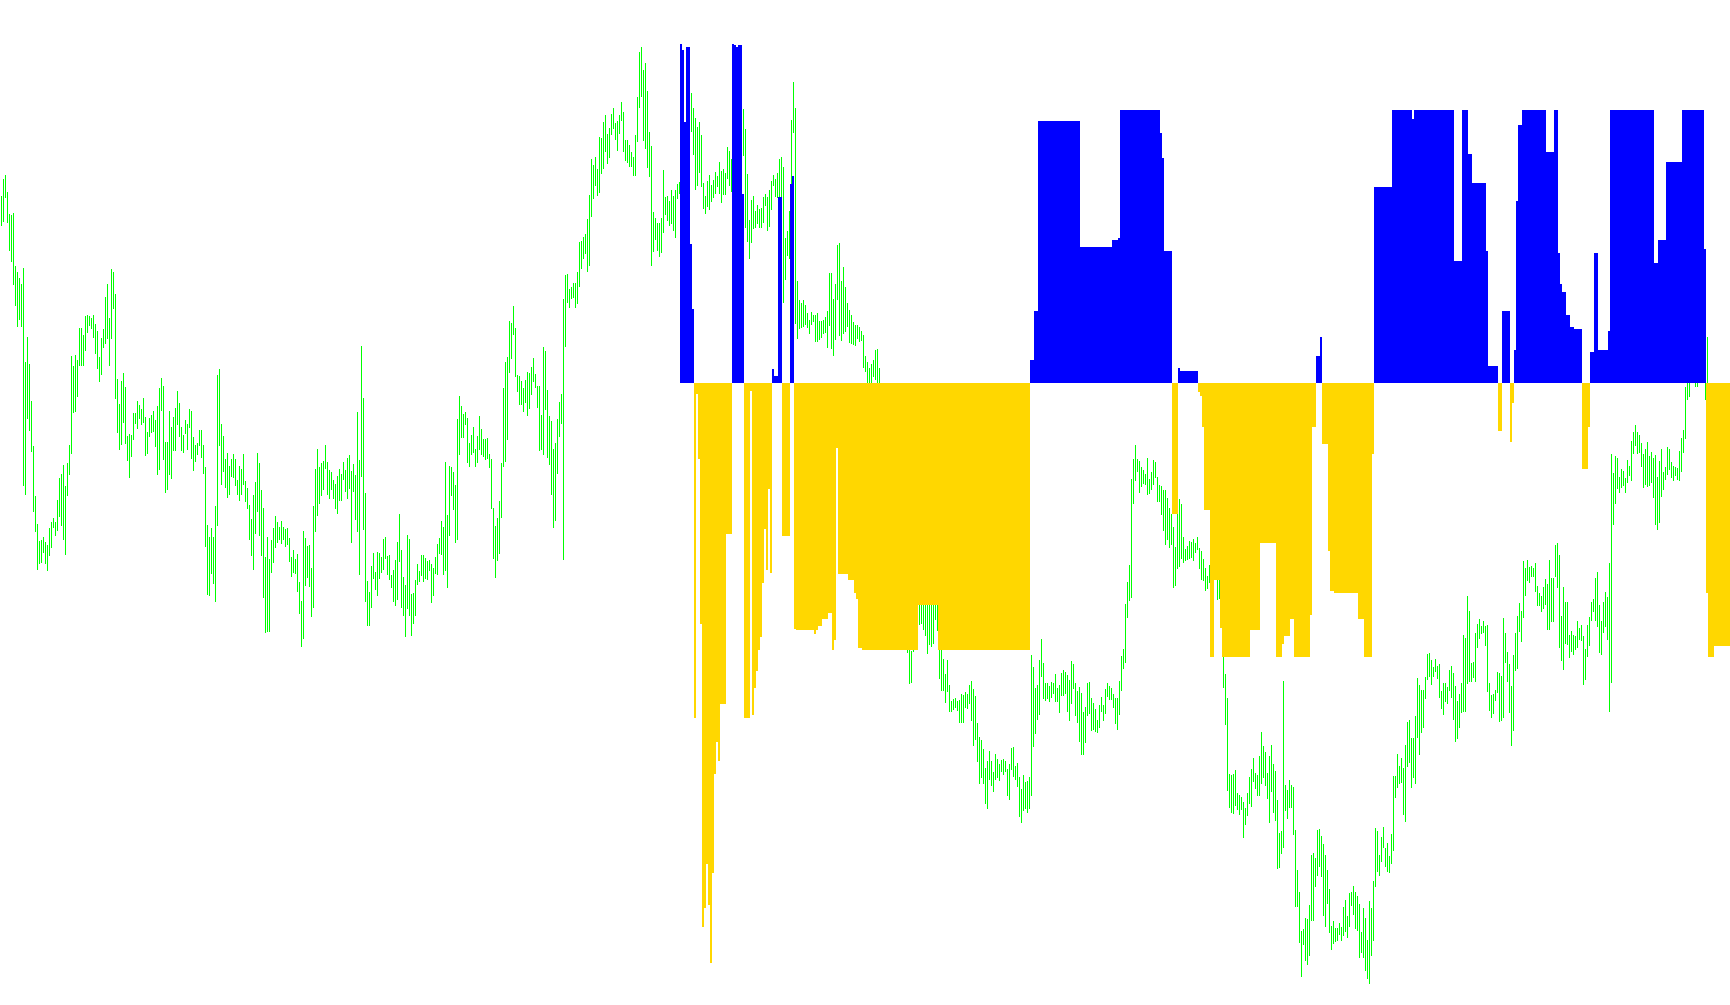
This script is a custom technical analysis tool designed to visualize market trends and volatility by creating a specialized "Step Moving Average" system. Instead of a standard smooth line, it identifies distinct price levels and movement patterns to help traders see the underlying structure of the market.
Here is a breakdown of the logic used:
1. Volatility Assessment
The tool begins by calculating the market's volatility over a specific period. It looks at the range between high and low prices to determine how much the asset typically moves. From this, it establishes "minimum," "maximum," and "middle" price steps. This ensures that the indicator adapts to different market conditions—expanding when the market is volatile and contracting when it is stable.
2. Trend Identification
The script evaluates the current price relative to these calculated price steps. It determines the trend by checking where the closing price sits in relation to several "boundaries":
- Minimum Boundaries: Used to identify the tightest, most immediate price movements.
- Maximum Boundaries: Used to identify the wider, more aggressive trend limits.
- Middle Boundaries: Used to establish a balanced, median trend path.
By comparing the current price against these three different levels of boundaries, the tool can distinguish between minor fluctuations and significant trend shifts.
3. Step Logic and Persistence
The indicator uses "Step" logic, meaning it doesn't immediately jump to new values based on every tick of price. It maintains a sense of "memory." If a price moves into a new zone but doesn't strongly break the established step, the indicator holds its current position. This helps filter out market "noise" and prevents the visual data from flickering or changing too rapidly during consolidation.
4. Stochastic Normalization
Once the trends for the Minimum, Maximum, and Middle steps are identified, the script converts these values into a normalized format (similar to a Stochastic Oscillator). It calculates the relative position of these trend lines against each other.
5. Visual Output
The final result is plotted as a histogram in a separate window:
- Line 1: Represents the variance between the Minimum and Maximum trends.
- Line 2: Represents the variance between the Middle and Maximum trends.
By looking at these two lines, traders can see the strength of the current trend relative to historical volatility. When the lines move in opposite directions or change intensity, it signals a shift in market momentum or a potential exhaustion of the current price movement.
//+------------------------------------------------------------------+
//|                                             StepMA_Stoch_KV1.mq4 |
//|                           Copyright © 2005, TrendLaboratory Ltd. |
//|                                       E-mail: igorad2004@list.ru |
//|                           modified by Kalenzo -> simone@konto.pl |
//|                           modified by raduga  21.04.2006         |
//+------------------------------------------------------------------+
#property copyright "Copyright © 2005, TrendLaboratory Ltd."
#property link      "E-mail: igorad2004@list.ru"

#property indicator_separate_window
#property indicator_buffers 2
#property indicator_color1 Red
#property indicator_color2 Green

//#property indicator_minimum -1
//#property indicator_maximum 1

//---- input parameters
extern int PeriodWATR=10;
extern double Kwatr=1.0000;
extern int HighLow=0;
extern int NumberOfBarsToCalculate = 500;
//---- indicator buffers
double LineMinBuffer[];
double LineMidBuffer[];
//+------------------------------------------------------------------+
//| Custom indicator initialization function                         |
//+------------------------------------------------------------------+
  int init()
  {
 Comment("");
//---- indicator line
   SetIndexStyle(0,DRAW_HISTOGRAM,STYLE_SOLID,2);
   SetIndexStyle(1,DRAW_HISTOGRAM,STYLE_SOLID,2);
   SetIndexBuffer(0,LineMinBuffer);
   SetIndexBuffer(1,LineMidBuffer);
   IndicatorDigits(MarketInfo(Symbol(),MODE_DIGITS));
//---- name for DataWindow and indicator subwindow label
   //short_name="StepMA Stoch("+PeriodWATR+","+Kwatr+","+HighLow+")";

   SetIndexLabel(0,"StepMA Stoch 1");
   SetIndexLabel(1,"StepMA Stoch 2");
//----
   SetIndexDrawBegin(0,PeriodWATR);
   SetIndexDrawBegin(1,PeriodWATR);
   /**
   *raduga:
   *USELESS !!!! Throws "ArrayInitialization" Exception !!!!
   **/
   //======================================================
   //ArrayInitialize(LineMinBuffer,0);
   //ArrayInitialize(LineMidBuffer,0);
   SetIndexEmptyValue(0,0.0);
   SetIndexEmptyValue(1,0.0);
   //=====================================================
//----
   return(0);
  }

//+------------------------------------------------------------------+
//| StepMA_3D_v1                                                         |
//+------------------------------------------------------------------+
int start()
  {
      string short_name;
      short_name = "Max bars to count: |"+(Bars-1)+"| ";
      IndicatorShortName(short_name);

	int StepSizeMin, StepSizeMax, StepSizeMid;
	int      i,shift,TrendMin,TrendMax,TrendMid;
   double   SminMin0,SmaxMin0,SminMin1,SmaxMin1,SumRange,dK,WATR0,WATRmax,WATRmin,WATRmid;
   double   SminMax0,SmaxMax0,SminMax1,SmaxMax1,SminMid0,SmaxMid0,SminMid1,SmaxMid1;
   double   linemin,linemax,linemid,Stoch1,Stoch2,bsmin,bsmax;
   //raduga : Variable theDelta - has a differense between two bsmin/max lines
   double theDelta;

   double prev_y = 0,prev_b = 0;

   for(shift=NumberOfBarsToCalculate-1;shift>=0;shift--)
   {
	SumRange=0;
	//raduga: initialization because of ZERO-DEVIDE ERROR
	//===============================
	Stoch1 = 0.0;
	Stoch2 = 0.0;
	//===============================
	for (i=PeriodWATR-1;i>=0;i--)
	    {
       dK = 1+1.0*(PeriodWATR-i)/PeriodWATR;
       //raduga: MathAbs has no sense ragarding High - Low... Probably Close - open !!!!
       //SumRange+= dK*MathAbs(High[i+shift]-Low[i+shift]);
       SumRange+= dK*(High[i+shift]-Low[i+shift]);
       }
	WATR0 = SumRange/PeriodWATR;

	WATRmax=MathMax(WATR0,WATRmax);
	if (shift==NumberOfBarsToCalculate-1-PeriodWATR) WATRmin=WATR0;
	WATRmin=MathMin(WATR0,WATRmin);

	StepSizeMin=MathRound(Kwatr*WATRmin/Point);
	StepSizeMax=MathRound(Kwatr*WATRmax/Point);
	StepSizeMid=MathRound(Kwatr*0.5*(WATRmax+WATRmin)/Point);

	if (HighLow>0)
	  {
	  SmaxMin0=Low[shift]+2*StepSizeMin*Point;
	  SminMin0=High[shift]-2*StepSizeMin*Point;

	  SmaxMax0=Low[shift]+2*StepSizeMax*Point;
	  SminMax0=High[shift]-2*StepSizeMax*Point;

	  SmaxMid0=Low[shift]+2*StepSizeMid*Point;
	  SminMid0=High[shift]-2*StepSizeMid*Point;

	  if(Close[shift]>SmaxMin1) TrendMin=1;
	  if(Close[shift]<SminMin1) TrendMin=-1;

	  if(Close[shift]>SmaxMax1) TrendMax=1;
	  if(Close[shift]<SminMax1) TrendMax=-1;

	  if(Close[shift]>SmaxMid1) TrendMid=1;
	  if(Close[shift]<SminMid1) TrendMid=-1;
	  }

	if (HighLow == 0)
	  {
	  SmaxMin0=Close[shift]+2*StepSizeMin*Point;
	  SminMin0=Close[shift]-2*StepSizeMin*Point;

	  SmaxMax0=Close[shift]+2*StepSizeMax*Point;
	  SminMax0=Close[shift]-2*StepSizeMax*Point;

	  SmaxMid0=Close[shift]+2*StepSizeMid*Point;
	  SminMid0=Close[shift]-2*StepSizeMid*Point;

	  if(Close[shift]>SmaxMin1) TrendMin=1;
	  if(Close[shift]<SminMin1) TrendMin=-1;

	  if(Close[shift]>SmaxMax1) TrendMax=1;
	  if(Close[shift]<SminMax1) TrendMax=-1;

	  if(Close[shift]>SmaxMid1) TrendMid=1;
	  if(Close[shift]<SminMid1) TrendMid=-1;
	  }

	  if(TrendMin>0 && SminMin0<SminMin1) SminMin0=SminMin1;
	  if(TrendMin<0 && SmaxMin0>SmaxMin1) SmaxMin0=SmaxMin1;

	  if(TrendMax>0 && SminMax0<SminMax1) SminMax0=SminMax1;
	  if(TrendMax<0 && SmaxMax0>SmaxMax1) SmaxMax0=SmaxMax1;

	  if(TrendMid>0 && SminMid0<SminMid1) SminMid0=SminMid1;
	  if(TrendMid<0 && SmaxMid0>SmaxMid1) SmaxMid0=SmaxMid1;


	  if (TrendMin>0) linemin=SminMin0+StepSizeMin*Point;
	  if (TrendMin<0) linemin=SmaxMin0-StepSizeMin*Point;

	  if (TrendMax>0) linemax=SminMax0+StepSizeMax*Point;
	  if (TrendMax<0) linemax=SmaxMax0-StepSizeMax*Point;

	  if (TrendMid>0) linemid=SminMid0+StepSizeMid*Point;
	  if (TrendMid<0) linemid=SmaxMid0-StepSizeMid*Point;

	  bsmin=linemax-StepSizeMax*Point;
	  bsmax=linemax+StepSizeMax*Point;
	  //raduga: ZERO-DEVIDE-ERROR
	  //=============================
	  theDelta = bsmax-bsmin;
	  if(theDelta != 0)
	  {
	     Stoch1=NormalizeDouble((linemin-bsmin)/theDelta,6);
	     Stoch2=NormalizeDouble((linemid-bsmin)/theDelta,6);
	  }
	  //==============================
	  prev_y = (Stoch1 - Stoch2);
	  if(prev_y<0.0){
	     LineMinBuffer[shift] = prev_y;
	     LineMidBuffer[shift] = 0;
	     }
	  else if(prev_y>0.0){
	     LineMidBuffer[shift] = prev_y;
	     LineMinBuffer[shift] = 0;
	     }

	  //prev_y = Stoch1;
	  //prev_b = Stoch2;


	  SminMin1=SminMin0;
	  SmaxMin1=SmaxMin0;

	  SminMax1=SminMax0;
	  SmaxMax1=SmaxMax0;

	  SminMid1=SminMid0;
	  SmaxMid1=SmaxMid0;
	 }
	return(0);
 }
Comments