Hist_StepMA_Stoch_KV1_Ex_03_001
Download script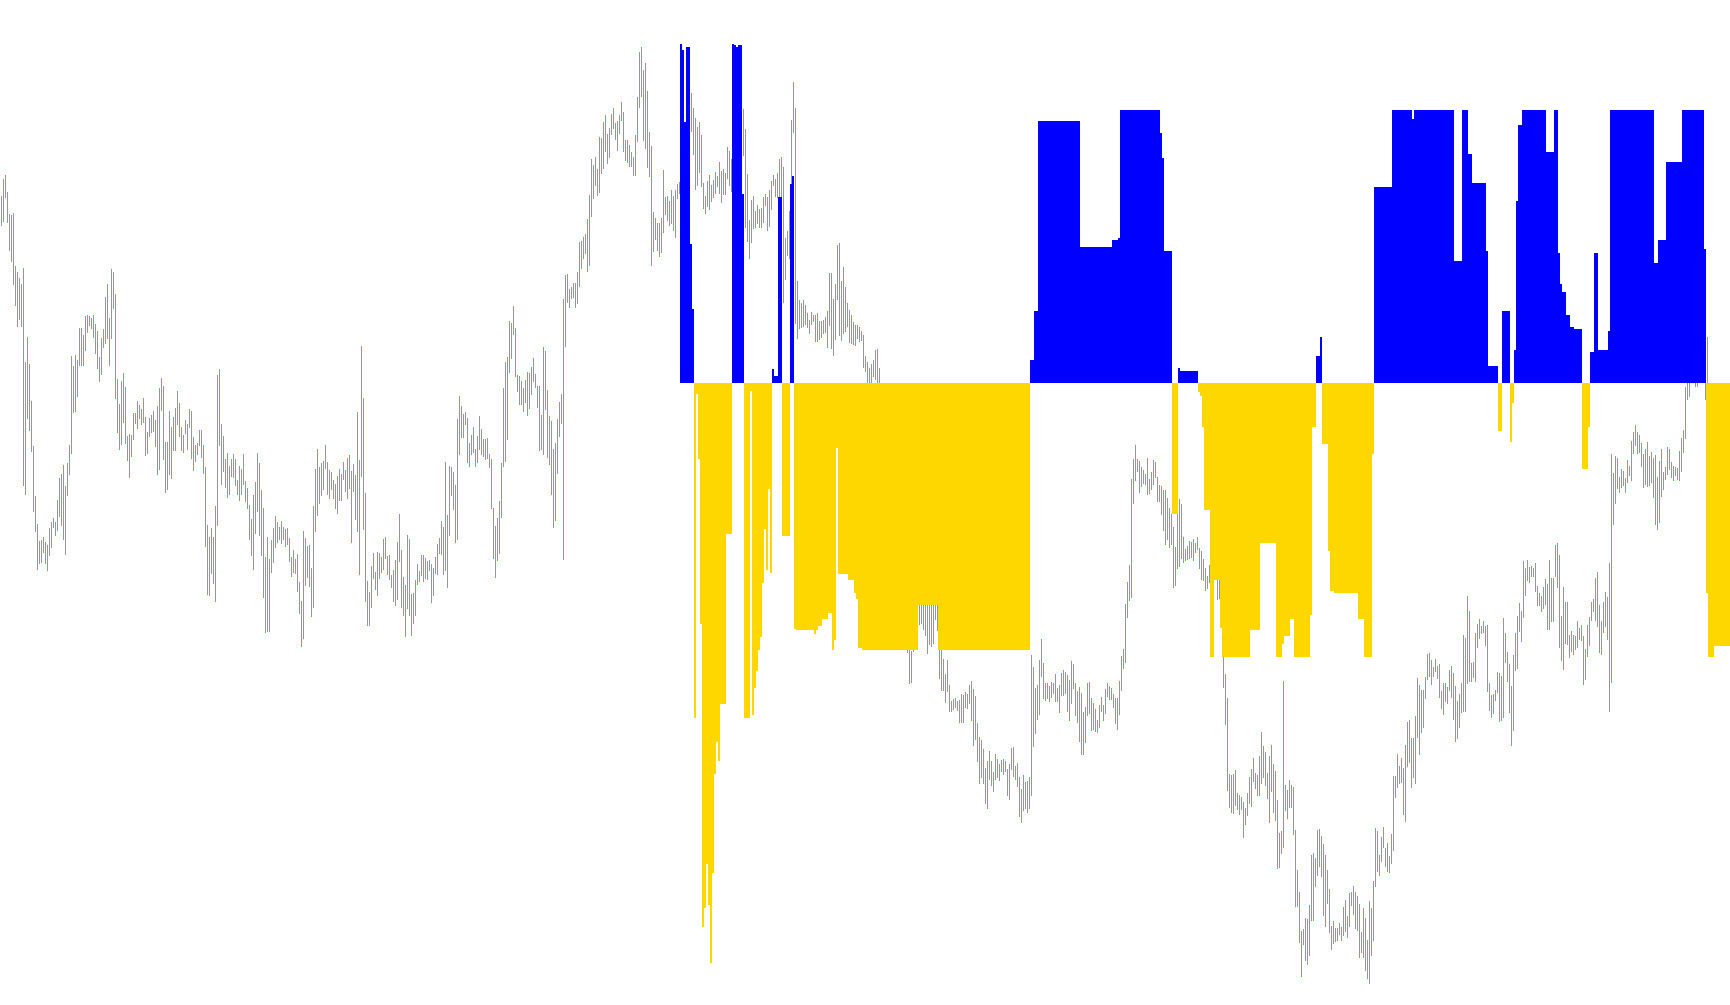
This script functions as a specialized technical analysis tool designed to visualize market trends and momentum. It calculates specific price boundaries based on recent market volatility and uses those boundaries to determine the strength and direction of price movement.
Core Logic Overview
The indicator operates by analyzing the range between high and low prices over a specific period. Instead of looking at simple averages, it focuses on "Steps"—essentially calculating dynamic zones that expand or contract depending on how much the market is moving.
How the Calculation Works
The logic follows a structured four-step process to generate its visual output:
1. Volatility Assessment The script first looks back at a user-defined number of price candles to calculate the current "range." It assigns a weighted value to these candles, giving more significance to recent price action. This creates a baseline for understanding how much the market is currently swinging.
2. Dynamic Boundary Creation Based on that volatility, the script establishes three different sets of "thresholds" (Minimum, Maximum, and Midpoint).
- If the user chooses to prioritize high/low prices, the script uses those extremes.
- If the user prefers a smoother approach, it can be set to focus on closing prices.
3. Trend Detection The tool continuously checks where the current price sits in relation to these thresholds:
- Trend Min: Identifies the most aggressive price movement.
- Trend Max: Identifies the widest possible price movement.
- Trend Mid: Identifies a balanced, middle-ground price movement.
If the price breaks above or below these specific "Step" levels, the script identifies the direction of the trend (positive or negative) and locks into those boundaries until the price reverses.
4. Momentum Visualization (Stochastic Conversion) Finally, the script converts these complex price steps into a normalized momentum value. It compares the "Minimum" trend line against the "Maximum" trend line to calculate a relative position. This result is then plotted as a histogram in a separate window:
- When the momentum leans toward one side, it highlights a specific color (Red or Green).
- This allows traders to see not just where the price is going, but how much "force" is behind the current trend relative to its historical limits.
Summary for the User
Essentially, this tool filters out market "noise" by creating dynamic corridors based on recent volatility. It then measures how far the current price is pushing against those corridors. The resulting visual output tells you whether the current trend has significant momentum or if it is losing steam relative to the market's recent behavior.
//+------------------------------------------------------------------+
//|                                             StepMA_Stoch_KV1.mq4 |
//|                           Copyright © 2005, TrendLaboratory Ltd. |
//|                                       E-mail: igorad2004@list.ru |
//|                           modified by Kalenzo -> simone@konto.pl |
//|                           modified by raduga  21.04.2006         |
//+------------------------------------------------------------------+
#property copyright "Copyright © 2005, TrendLaboratory Ltd."
#property link      "E-mail: igorad2004@list.ru"

#property indicator_separate_window
#property indicator_buffers 2
#property indicator_color1 Red
#property indicator_color2 Green

//#property indicator_minimum -1
//#property indicator_maximum 1

//---- input parameters
extern int PeriodWATR=10;
extern double Kwatr=1.0000;
extern int HighLow=0;
extern int NumberOfBarsToCalculate = 500;
//---- indicator buffers
double LineMinBuffer[];
double LineMidBuffer[];
//+------------------------------------------------------------------+
//| Custom indicator initialization function                         |
//+------------------------------------------------------------------+
  int init()
  {
 Comment("");
//---- indicator line
   SetIndexStyle(0,DRAW_HISTOGRAM,STYLE_SOLID,2);
   SetIndexStyle(1,DRAW_HISTOGRAM,STYLE_SOLID,2);
   SetIndexBuffer(0,LineMinBuffer);
   SetIndexBuffer(1,LineMidBuffer);
   IndicatorDigits(MarketInfo(Symbol(),MODE_DIGITS));
//---- name for DataWindow and indicator subwindow label
   //short_name="StepMA Stoch("+PeriodWATR+","+Kwatr+","+HighLow+")";

   SetIndexLabel(0,"StepMA Stoch 1");
   SetIndexLabel(1,"StepMA Stoch 2");
//----
   SetIndexDrawBegin(0,PeriodWATR);
   SetIndexDrawBegin(1,PeriodWATR);
   /**
   *raduga:
   *USELESS !!!! Throws "ArrayInitialization" Exception !!!!
   **/
   //======================================================
   //ArrayInitialize(LineMinBuffer,0);
   //ArrayInitialize(LineMidBuffer,0);
   SetIndexEmptyValue(0,0.0);
   SetIndexEmptyValue(1,0.0);
   //=====================================================
//----
   return(0);
  }

//+------------------------------------------------------------------+
//| StepMA_3D_v1                                                         |
//+------------------------------------------------------------------+
int start()
  {
      string short_name;
      short_name = "Max bars to count: |"+(Bars-1)+"| ";
      IndicatorShortName(short_name);

   int      i,shift,TrendMin,TrendMax,TrendMid;
   double   SminMin0,SmaxMin0,SminMin1,SmaxMin1,SumRange,dK,WATR0,WATRmax,WATRmin,WATRmid;
   double   SminMax0,SmaxMax0,SminMax1,SmaxMax1,SminMid0,SmaxMid0,SminMid1,SmaxMid1;
   double   linemin,linemax,linemid,Stoch1,Stoch2,bsmin,bsmax;
   //raduga : Variable theDelta - has a differense between two bsmin/max lines
   double theDelta;

   double prev_y = 0,prev_b = 0;

   for(shift=NumberOfBarsToCalculate-1;shift>=0;shift--)
   {
	SumRange=0;
	//raduga: initialization because of ZERO-DEVIDE ERROR
	//===============================
	Stoch1 = 0.0;
	Stoch2 = 0.0;
	//===============================
	for (i=PeriodWATR-1;i>=0;i--)
	    {
       dK = 1+1.0*(PeriodWATR-i)/PeriodWATR;
       //raduga: MathAbs has no sense ragarding High - Low... Probably Close - open !!!!
       //SumRange+= dK*MathAbs(High[i+shift]-Low[i+shift]);
       SumRange+= dK*(High[i+shift]-Low[i+shift]);
       }
	WATR0 = SumRange/PeriodWATR;

	WATRmax=MathMax(WATR0,WATRmax);
	if (shift==NumberOfBarsToCalculate-1-PeriodWATR) WATRmin=WATR0;
	WATRmin=MathMin(WATR0,WATRmin);

	int StepSizeMin=MathRound(Kwatr*WATRmin/Point);
	int StepSizeMax=MathRound(Kwatr*WATRmax/Point);
	int StepSizeMid=MathRound(Kwatr*0.5*(WATRmax+WATRmin)/Point);

	if (HighLow>0)
	  {
	  SmaxMin0=Low[shift]+2*StepSizeMin*Point;
	  SminMin0=High[shift]-2*StepSizeMin*Point;

	  SmaxMax0=Low[shift]+2*StepSizeMax*Point;
	  SminMax0=High[shift]-2*StepSizeMax*Point;

	  SmaxMid0=Low[shift]+2*StepSizeMid*Point;
	  SminMid0=High[shift]-2*StepSizeMid*Point;

	  if(Close[shift]>SmaxMin1) TrendMin=1;
	  if(Close[shift]<SminMin1) TrendMin=-1;

	  if(Close[shift]>SmaxMax1) TrendMax=1;
	  if(Close[shift]<SminMax1) TrendMax=-1;

	  if(Close[shift]>SmaxMid1) TrendMid=1;
	  if(Close[shift]<SminMid1) TrendMid=-1;
	  }

	if (HighLow == 0)
	  {
	  SmaxMin0=Close[shift]+2*StepSizeMin*Point;
	  SminMin0=Close[shift]-2*StepSizeMin*Point;

	  SmaxMax0=Close[shift]+2*StepSizeMax*Point;
	  SminMax0=Close[shift]-2*StepSizeMax*Point;

	  SmaxMid0=Close[shift]+2*StepSizeMid*Point;
	  SminMid0=Close[shift]-2*StepSizeMid*Point;

	  if(Close[shift]>SmaxMin1) TrendMin=1;
	  if(Close[shift]<SminMin1) TrendMin=-1;

	  if(Close[shift]>SmaxMax1) TrendMax=1;
	  if(Close[shift]<SminMax1) TrendMax=-1;

	  if(Close[shift]>SmaxMid1) TrendMid=1;
	  if(Close[shift]<SminMid1) TrendMid=-1;
	  }

	  if(TrendMin>0 && SminMin0<SminMin1) SminMin0=SminMin1;
	  if(TrendMin<0 && SmaxMin0>SmaxMin1) SmaxMin0=SmaxMin1;

	  if(TrendMax>0 && SminMax0<SminMax1) SminMax0=SminMax1;
	  if(TrendMax<0 && SmaxMax0>SmaxMax1) SmaxMax0=SmaxMax1;

	  if(TrendMid>0 && SminMid0<SminMid1) SminMid0=SminMid1;
	  if(TrendMid<0 && SmaxMid0>SmaxMid1) SmaxMid0=SmaxMid1;


	  if (TrendMin>0) linemin=SminMin0+StepSizeMin*Point;
	  if (TrendMin<0) linemin=SmaxMin0-StepSizeMin*Point;

	  if (TrendMax>0) linemax=SminMax0+StepSizeMax*Point;
	  if (TrendMax<0) linemax=SmaxMax0-StepSizeMax*Point;

	  if (TrendMid>0) linemid=SminMid0+StepSizeMid*Point;
	  if (TrendMid<0) linemid=SmaxMid0-StepSizeMid*Point;

	  bsmin=linemax-StepSizeMax*Point;
	  bsmax=linemax+StepSizeMax*Point;
	  //raduga: ZERO-DEVIDE-ERROR
	  //=============================
	  theDelta = bsmax-bsmin;
	  if(theDelta != 0)
	  {
	     Stoch1=NormalizeDouble((linemin-bsmin)/theDelta,6);
	     Stoch2=NormalizeDouble((linemid-bsmin)/theDelta,6);
	  }
	  //==============================
	  prev_y = (Stoch1 - Stoch2);
	  if(prev_y<0.0){
	     LineMinBuffer[shift] = prev_y;
	     LineMidBuffer[shift] = 0;
	     }
	  else if(prev_y>0.0){
	     LineMidBuffer[shift] = prev_y;
	     LineMinBuffer[shift] = 0;
	     }

	  //prev_y = Stoch1;
	  //prev_b = Stoch2;


	  SminMin1=SminMin0;
	  SmaxMin1=SmaxMin0;

	  SminMax1=SminMax0;
	  SmaxMax1=SmaxMax0;

	  SminMid1=SminMid0;
	  SmaxMid1=SmaxMid0;
	 }
	return(0);
 }
Comments