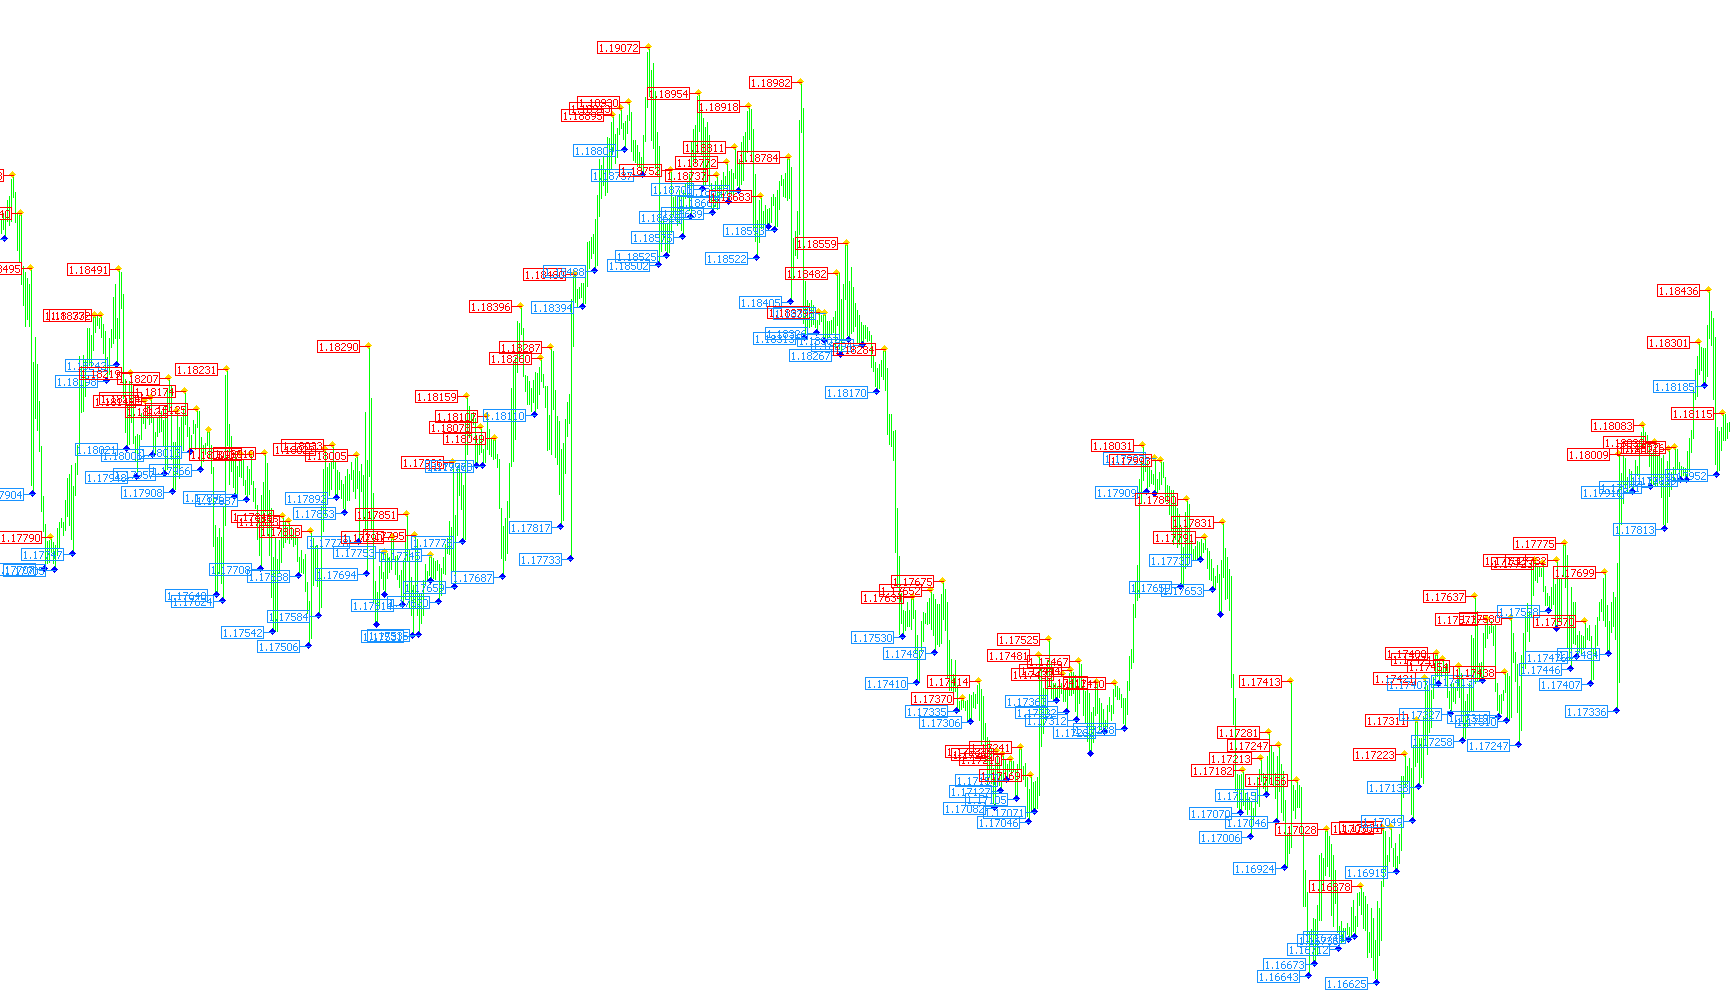
FoxPivot
Indicator

FoxPivot

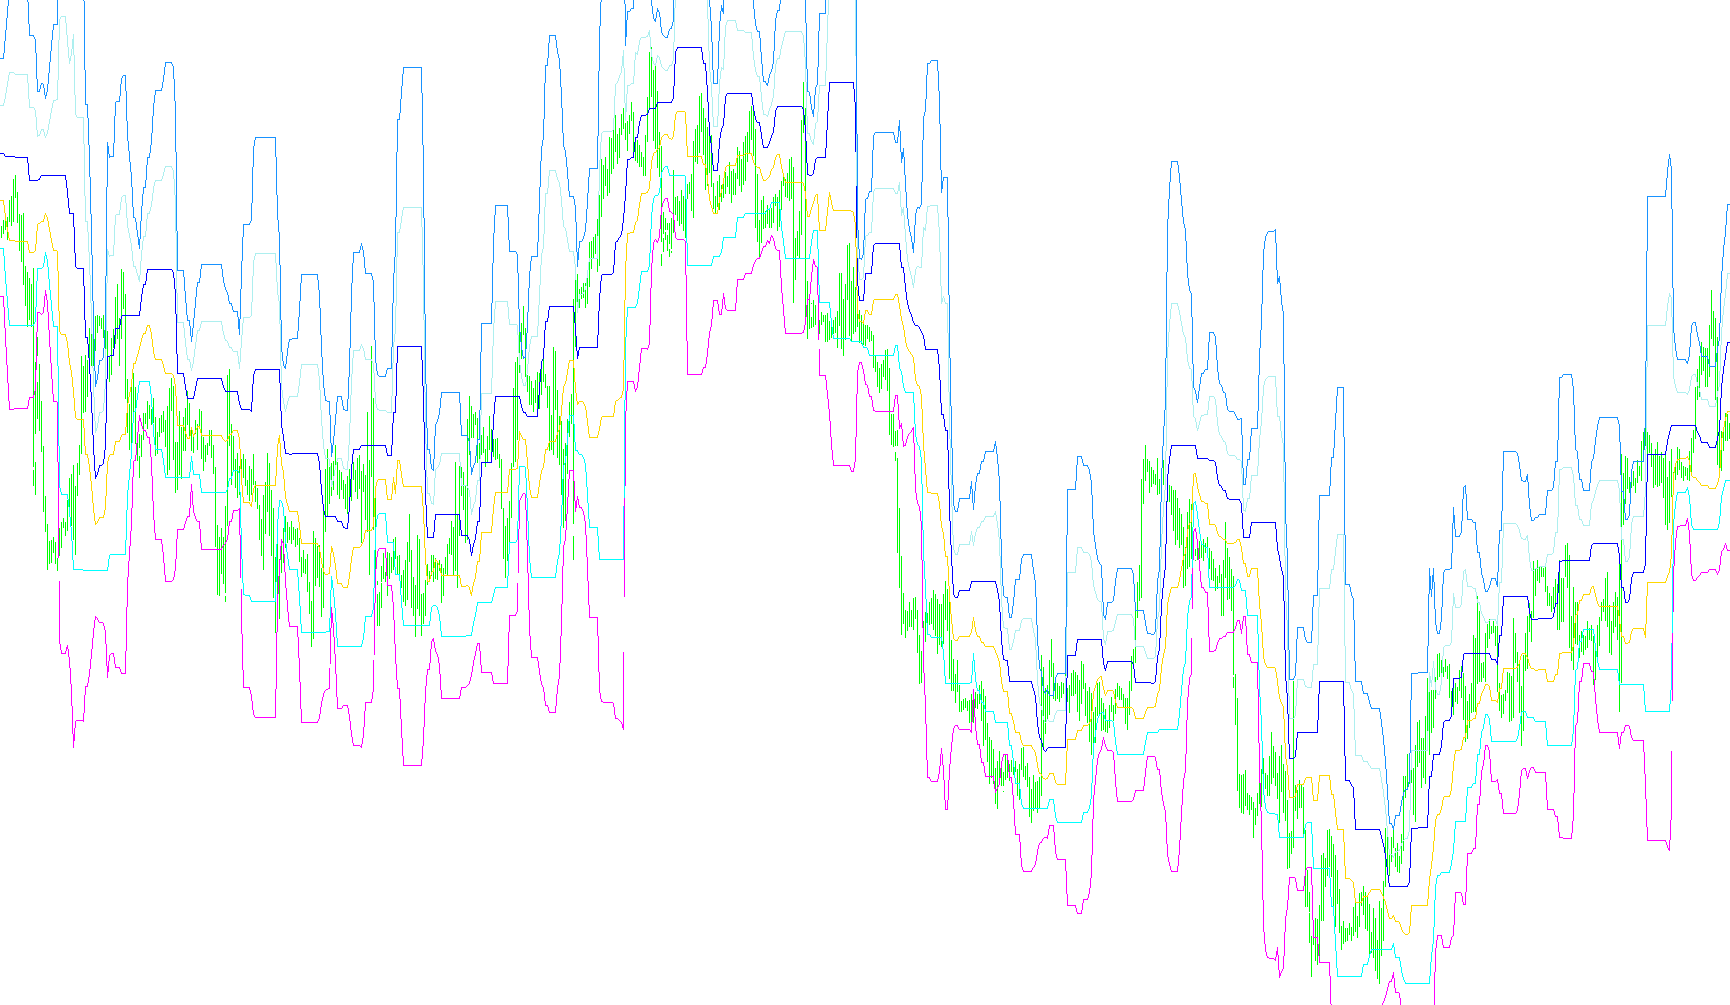
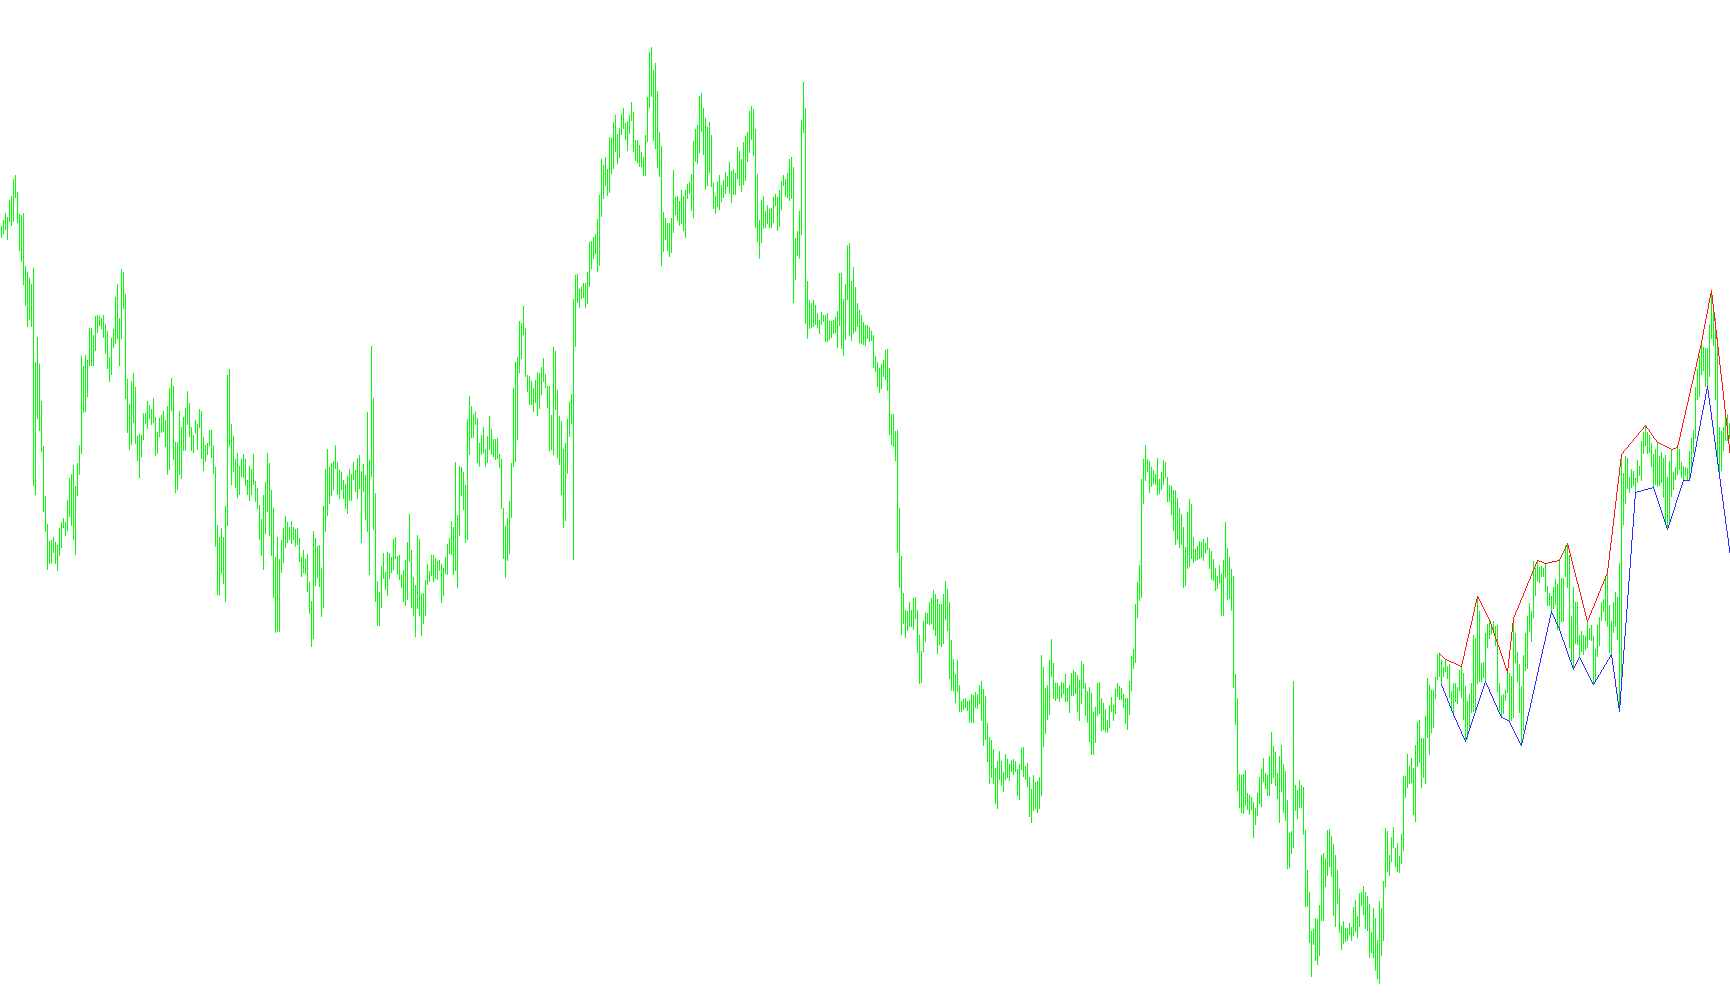
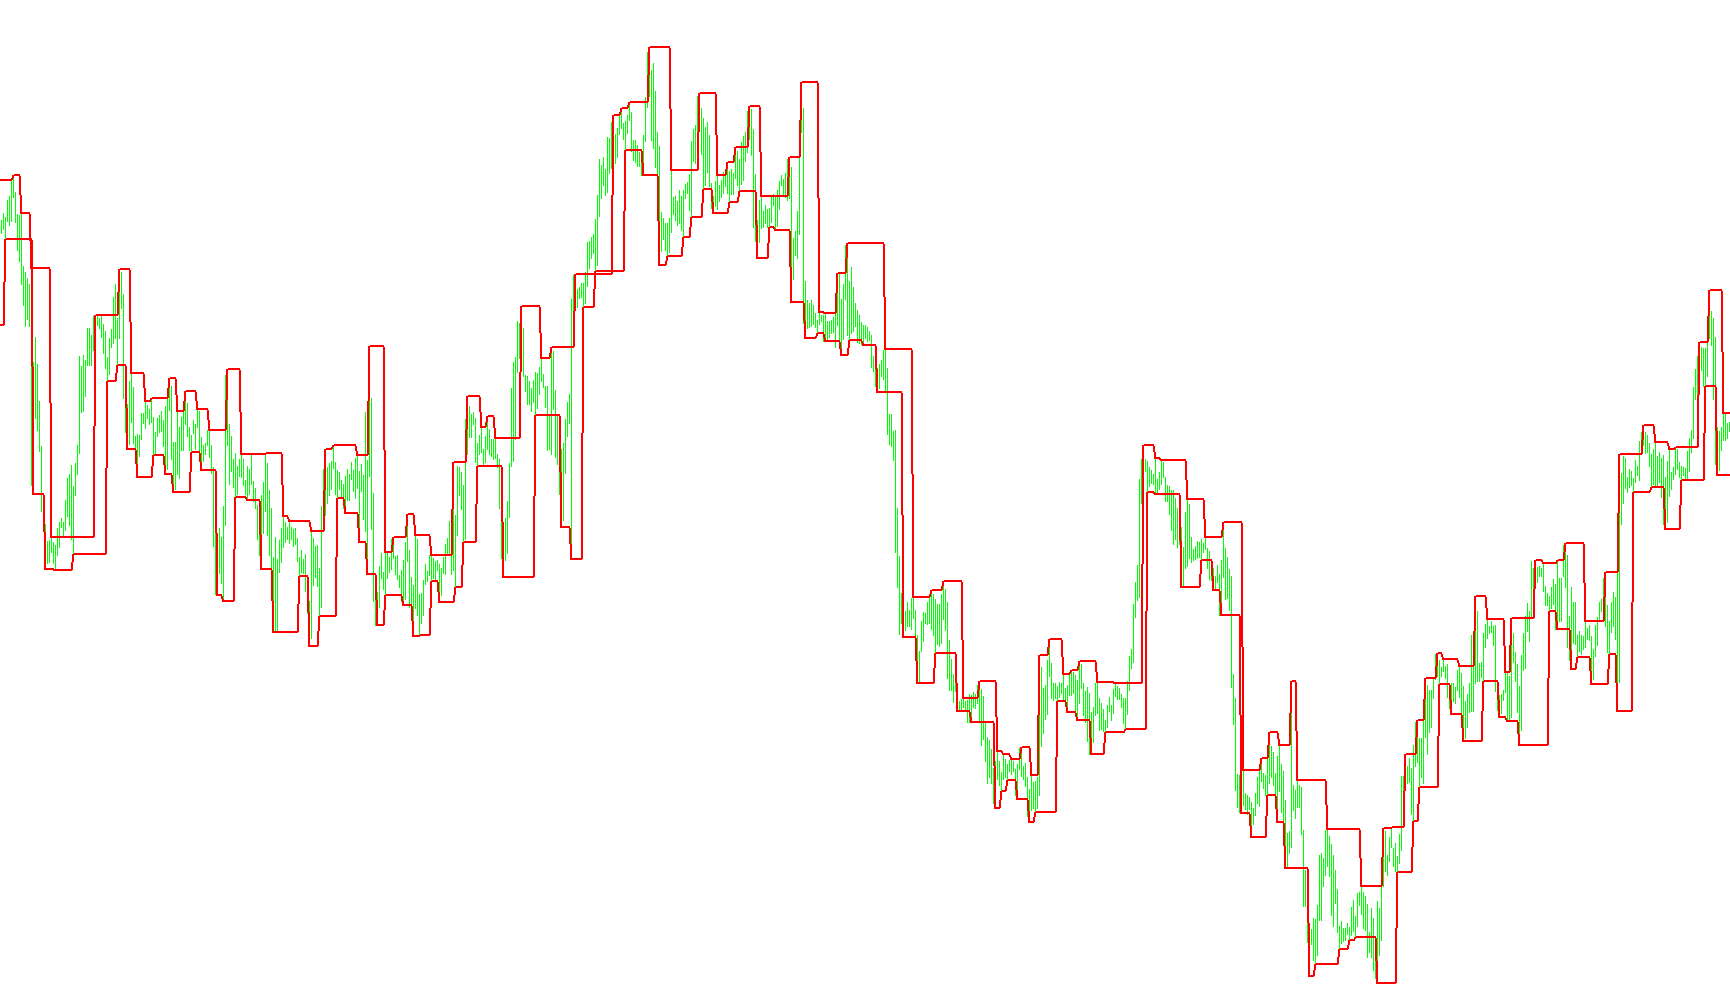
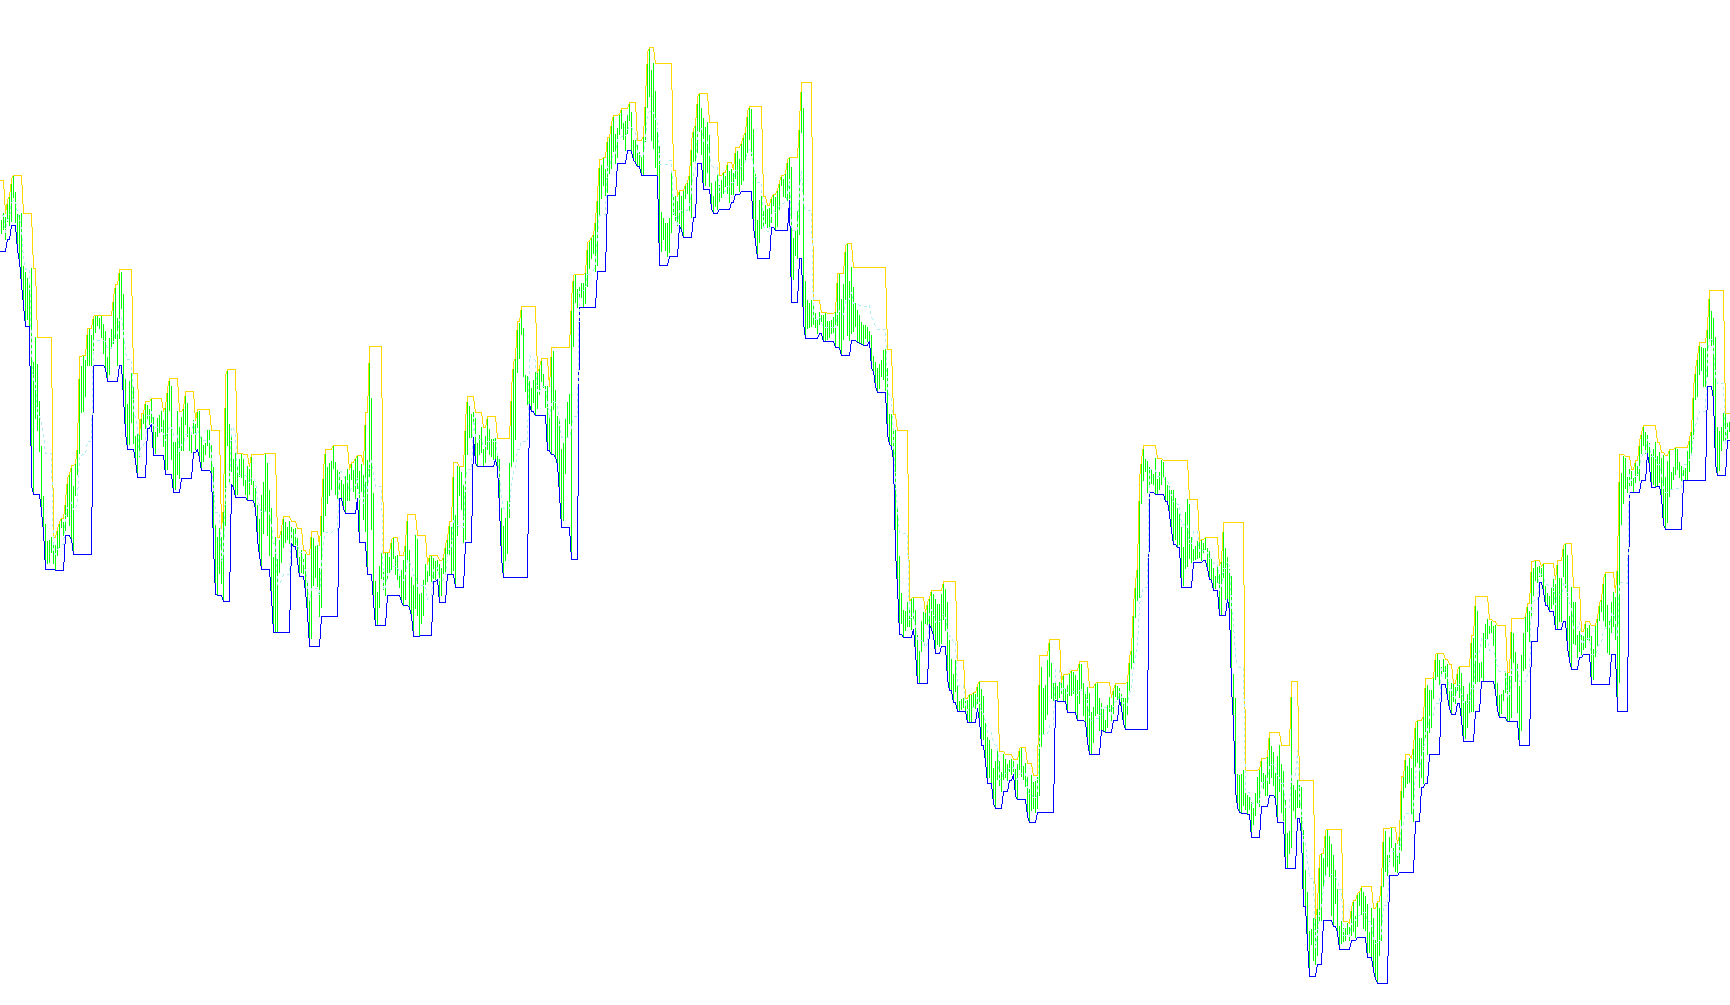
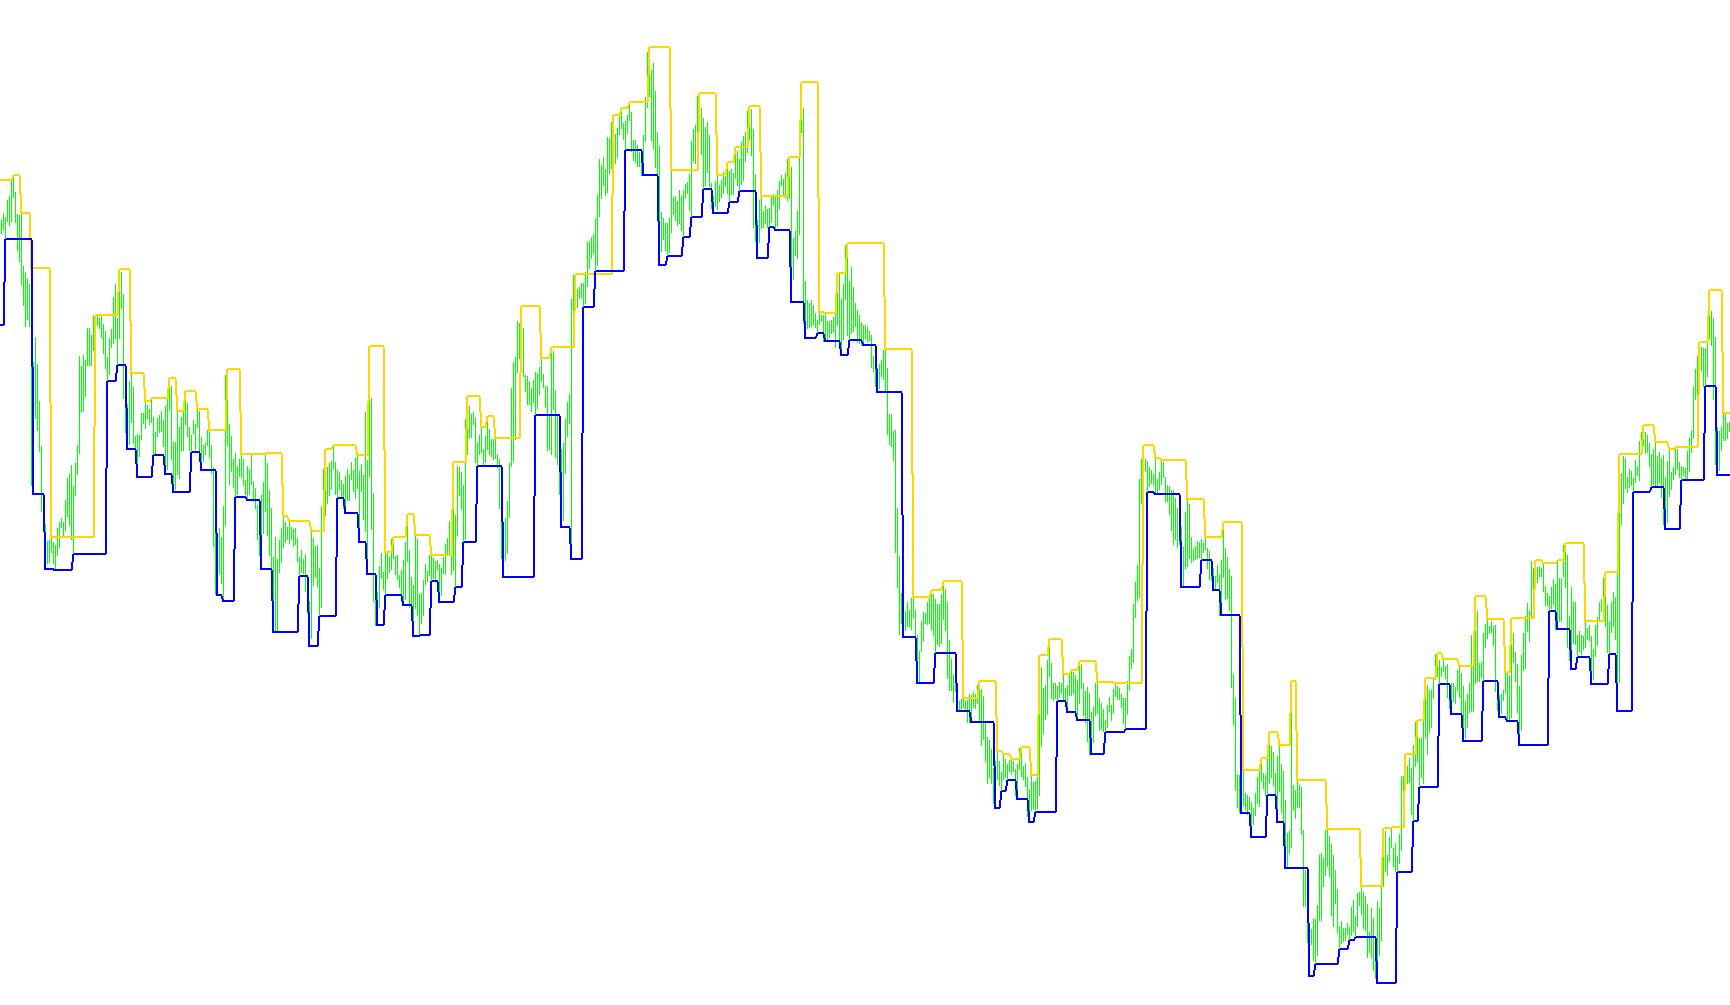
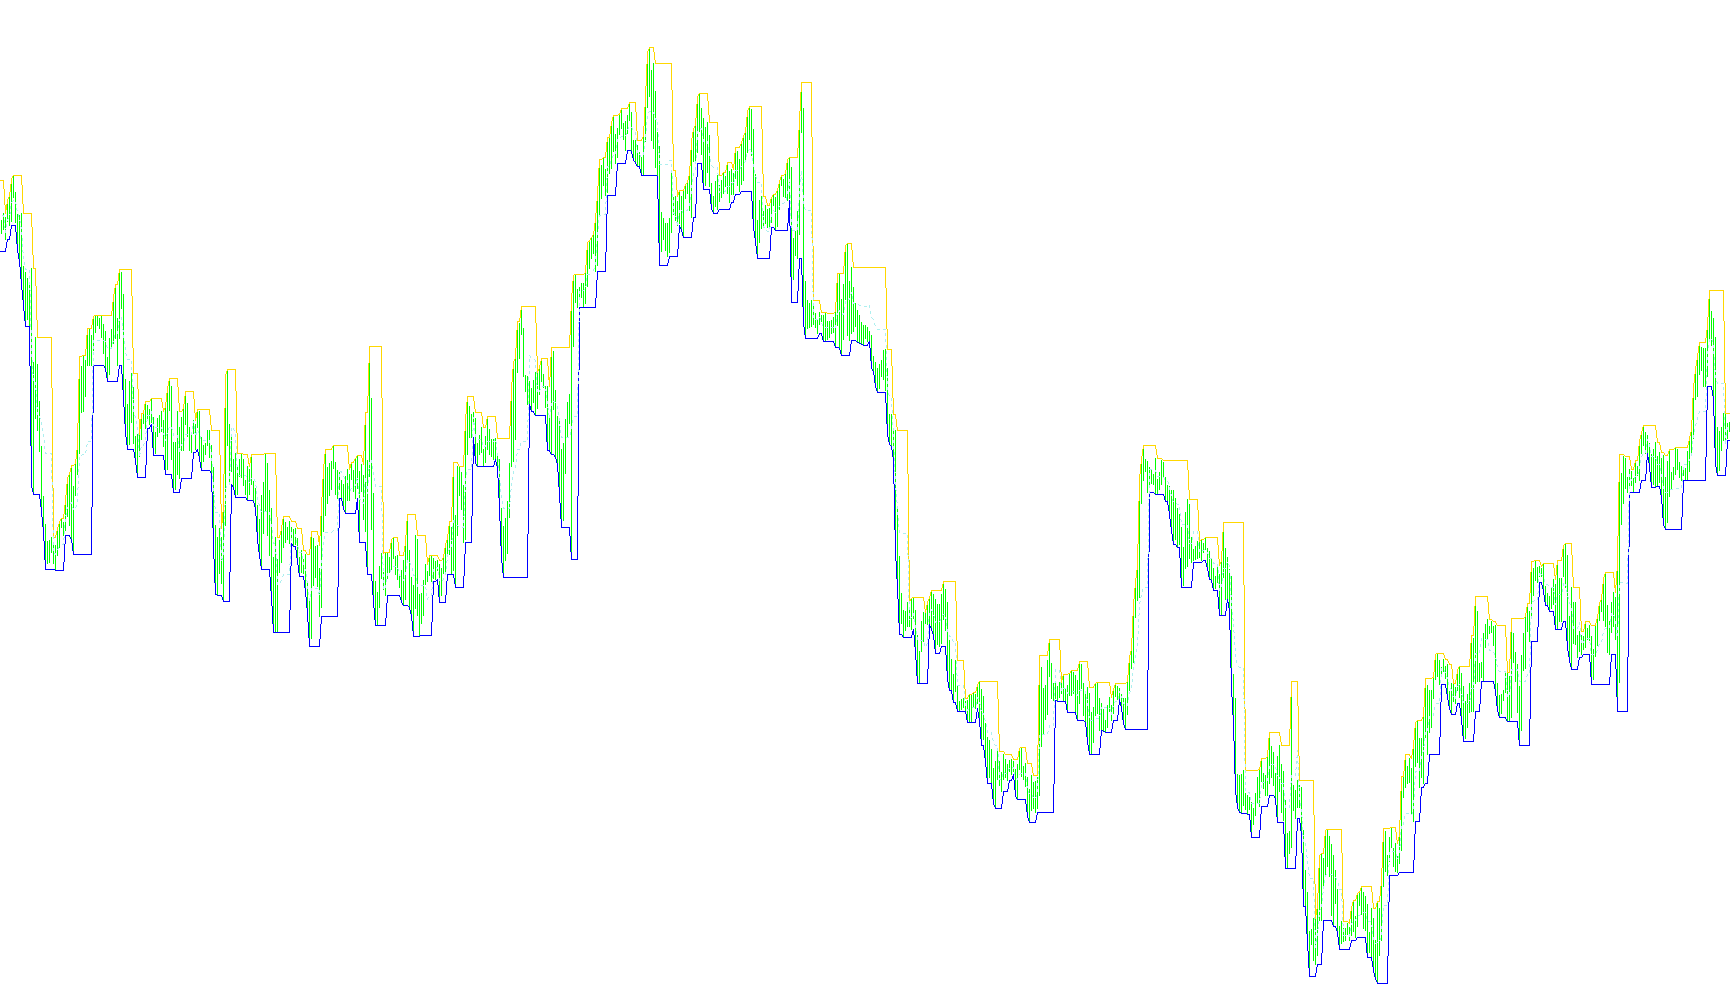
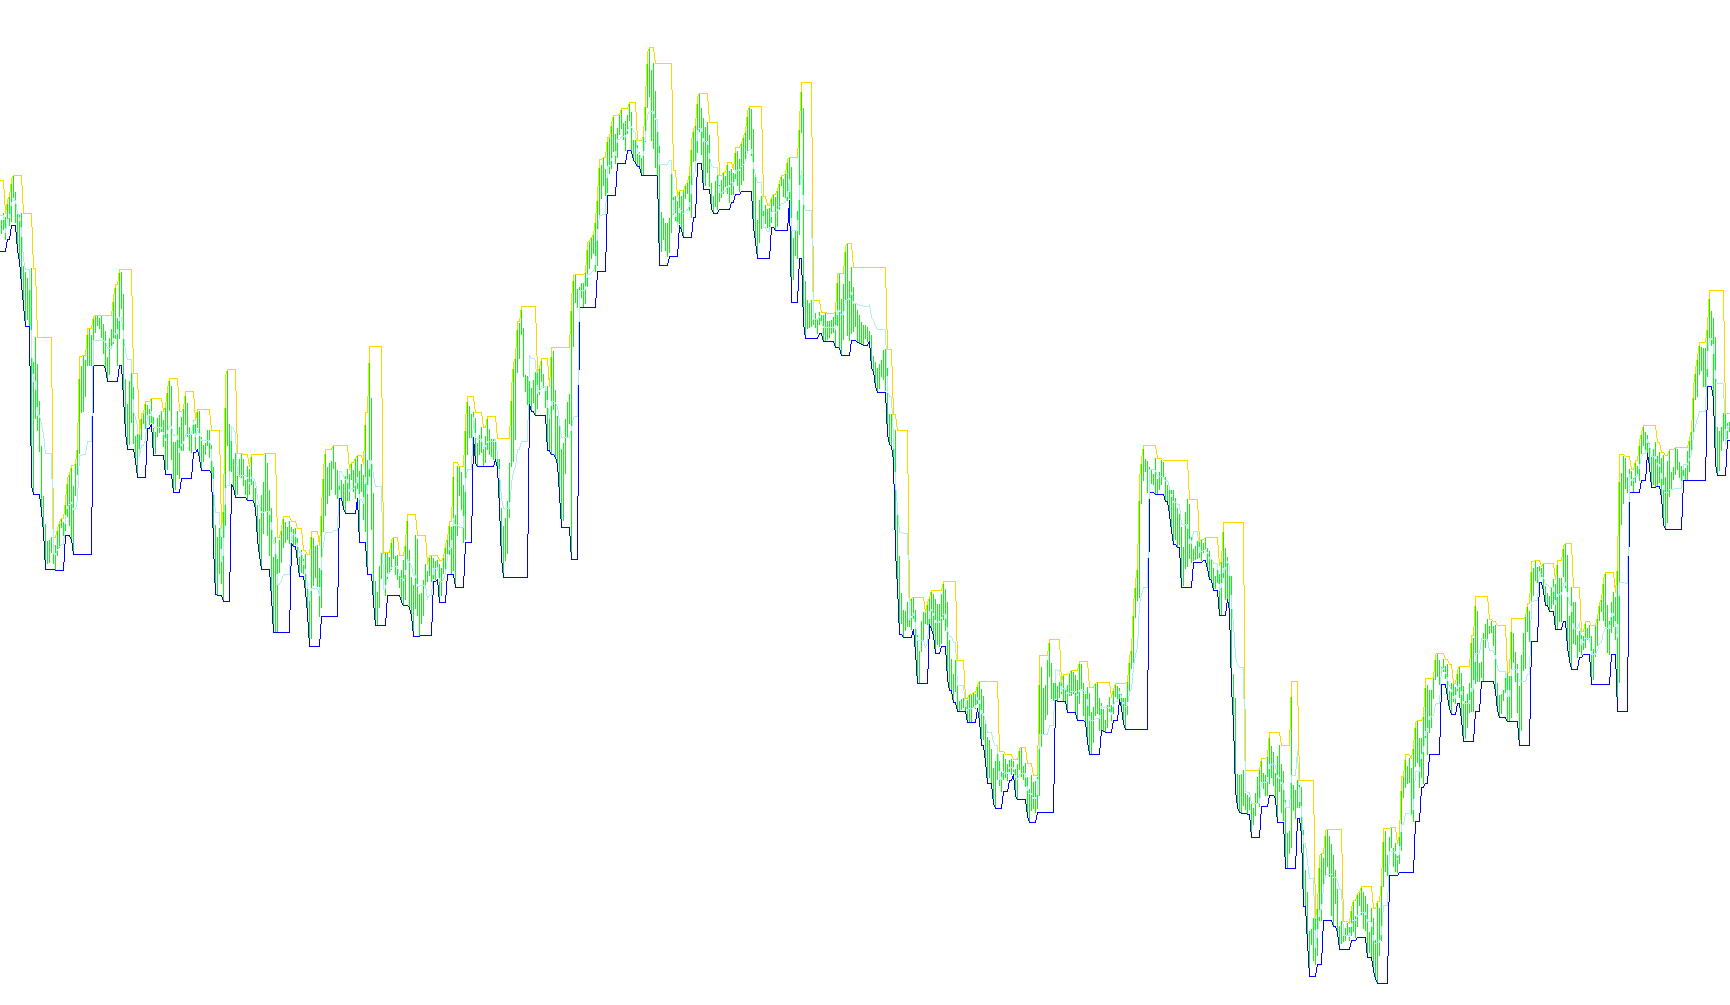
The indicator calculates a central pivot point based on the highest high and lowest low over a specific period, then projects seven distinct expansion boundaries to map potential price volatility zones.

FP
Indicator

FP

The algorithm synthesizes peak price extremes with a rolling three-bar mean to establish a central pivot and calculate symmetrical expansion boundaries.

Indicator

FPI indicator

FPI
Indicator

FPI

This indicator calculates a fractional product inefficiency by comparing the product of two currency pairs with a third related cross-currency pair to highlight potential discrepancies.

FPI_v1
Indicator

FPI_v1

This indicator calculates the relative price correlation between three specific currency pairs by multiplying two base symbols and dividing by a third to identify synthetic equilibrium.

Fractal AMA
Indicator

Fractal AMA

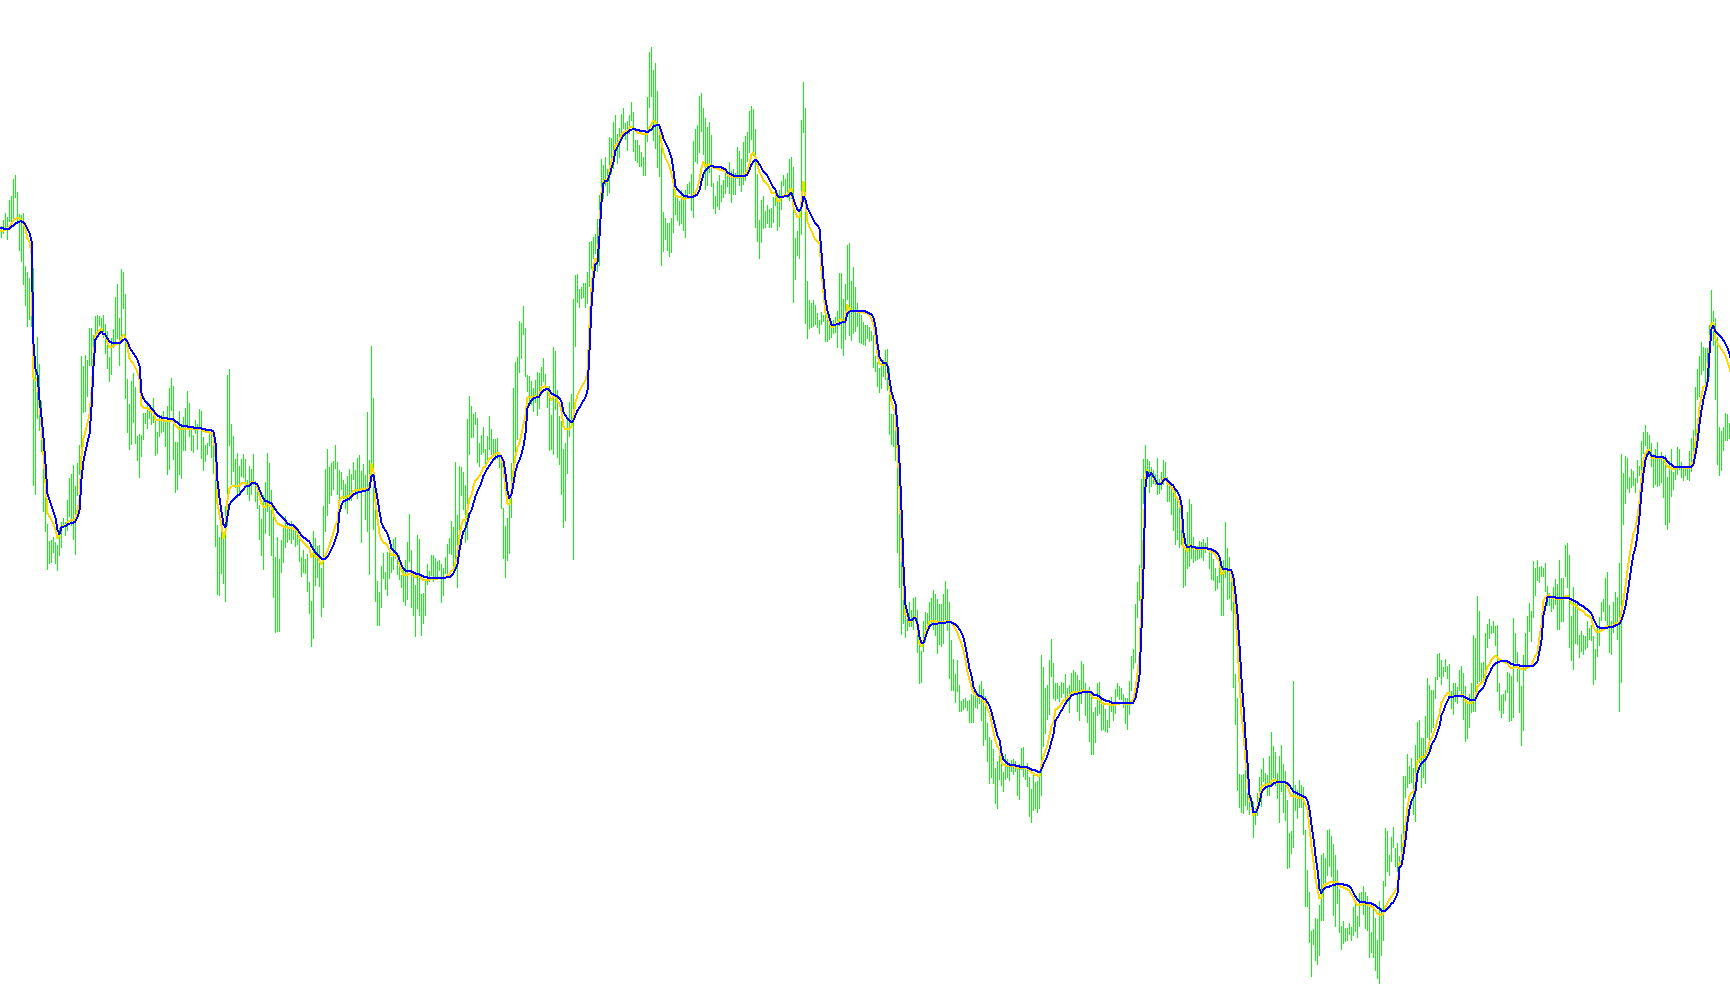
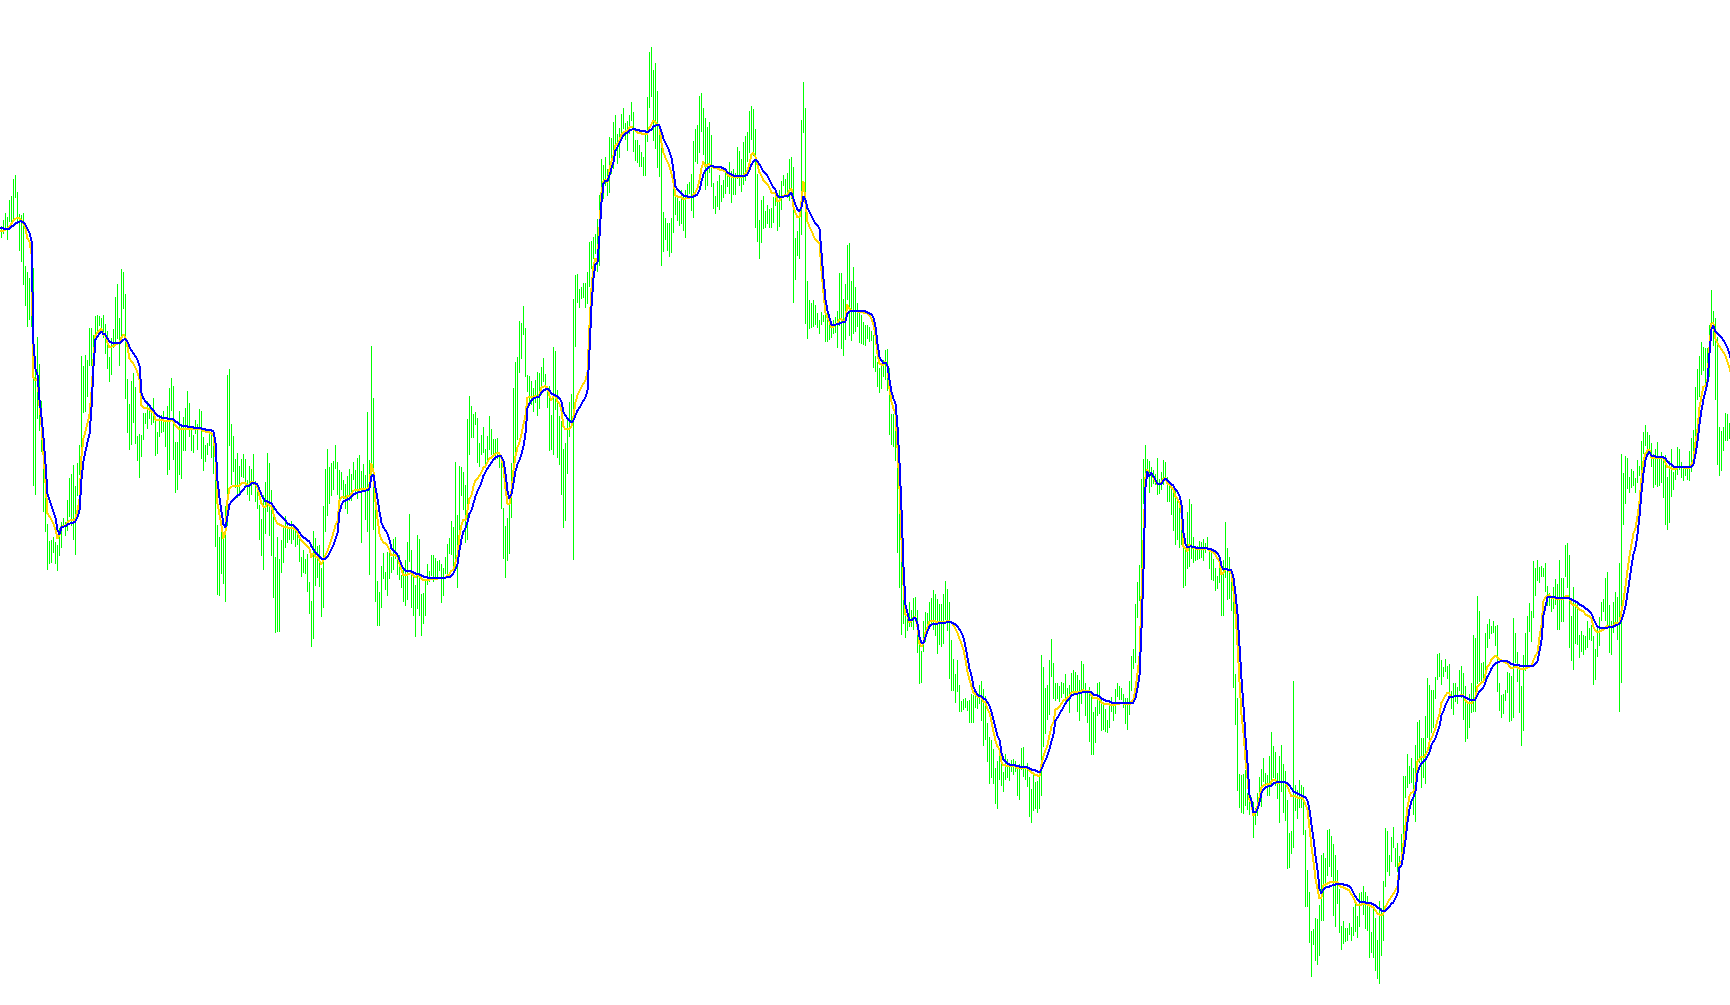
This indicator dynamically adjusts its smoothing coefficient by calculating the fractal dimension of price action to filter noise while remaining responsive to structural trends.

Fractal Support and Resistance
Indicator

Fractal Support and Resistance

iFractals
Fractal ZigZag
Indicator

Fractal ZigZag

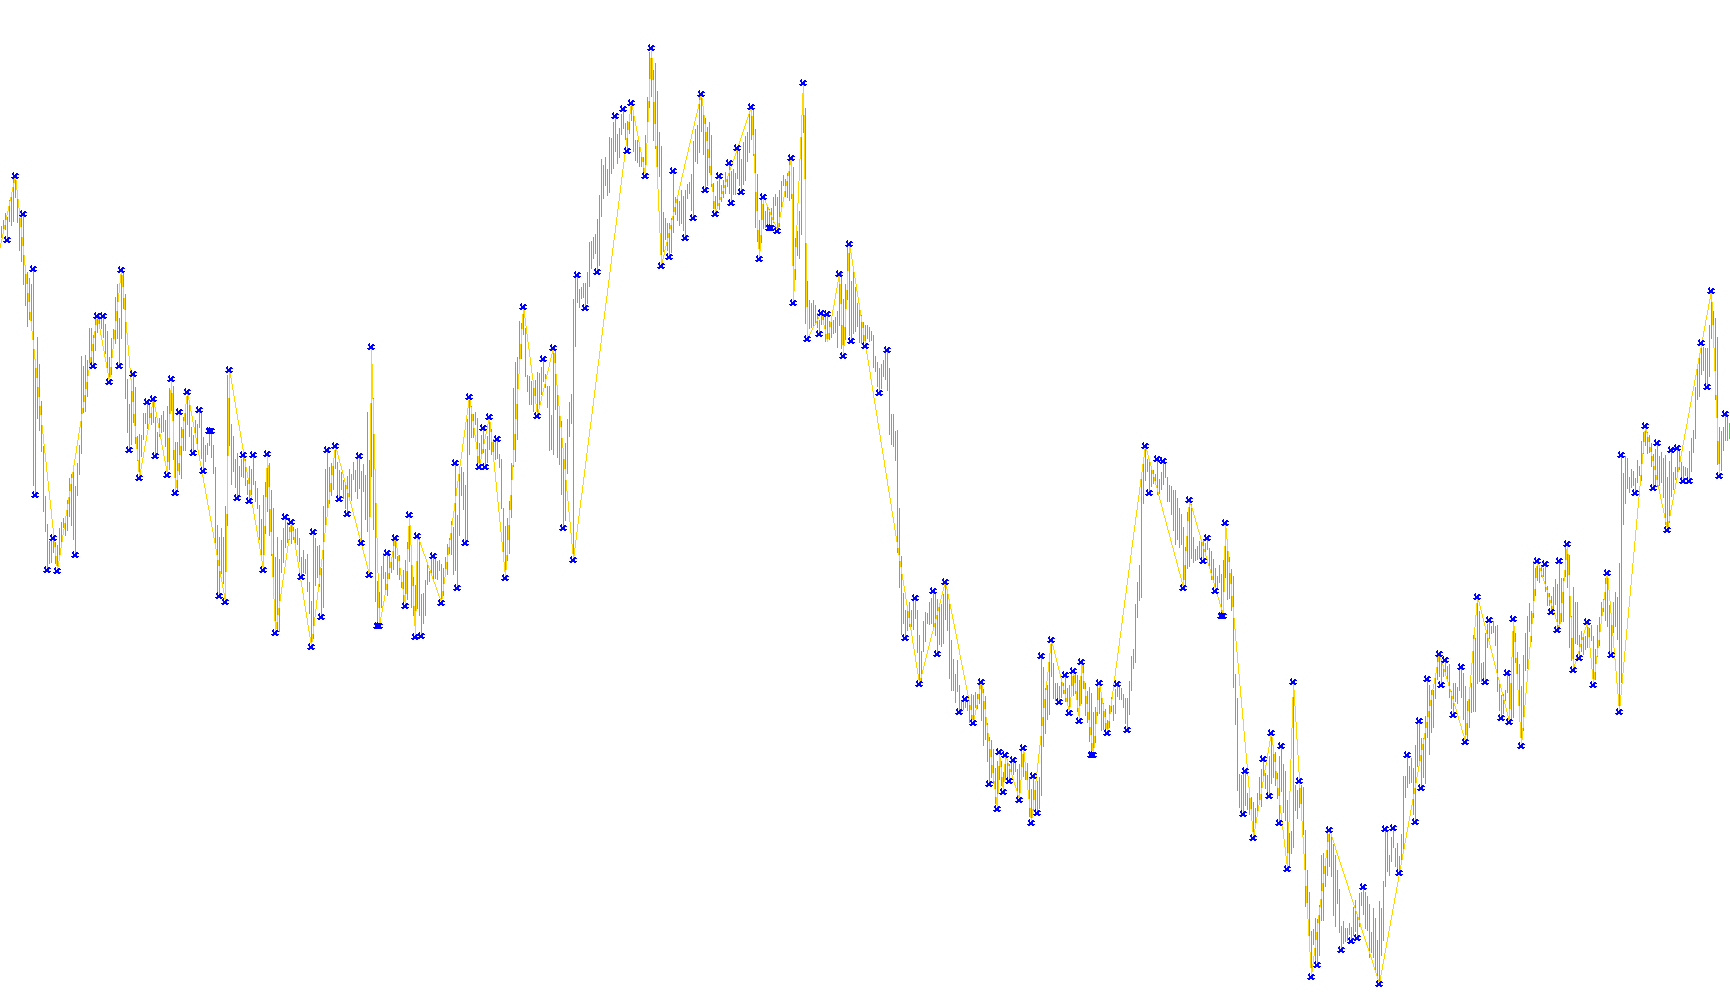
This indicator identifies significant price reversals by mapping structural pivots based on local extreme highs and lows relative to a user-defined fractal depth.

Fractal ZigZag_v1
Indicator

Fractal ZigZag_v1

This indicator identifies significant structural swing points by filtering local extremes against a multi-bar fractal window to trace underlying market trend cycles.

Fractal ZigZag_v2
Indicator

Fractal ZigZag_v2

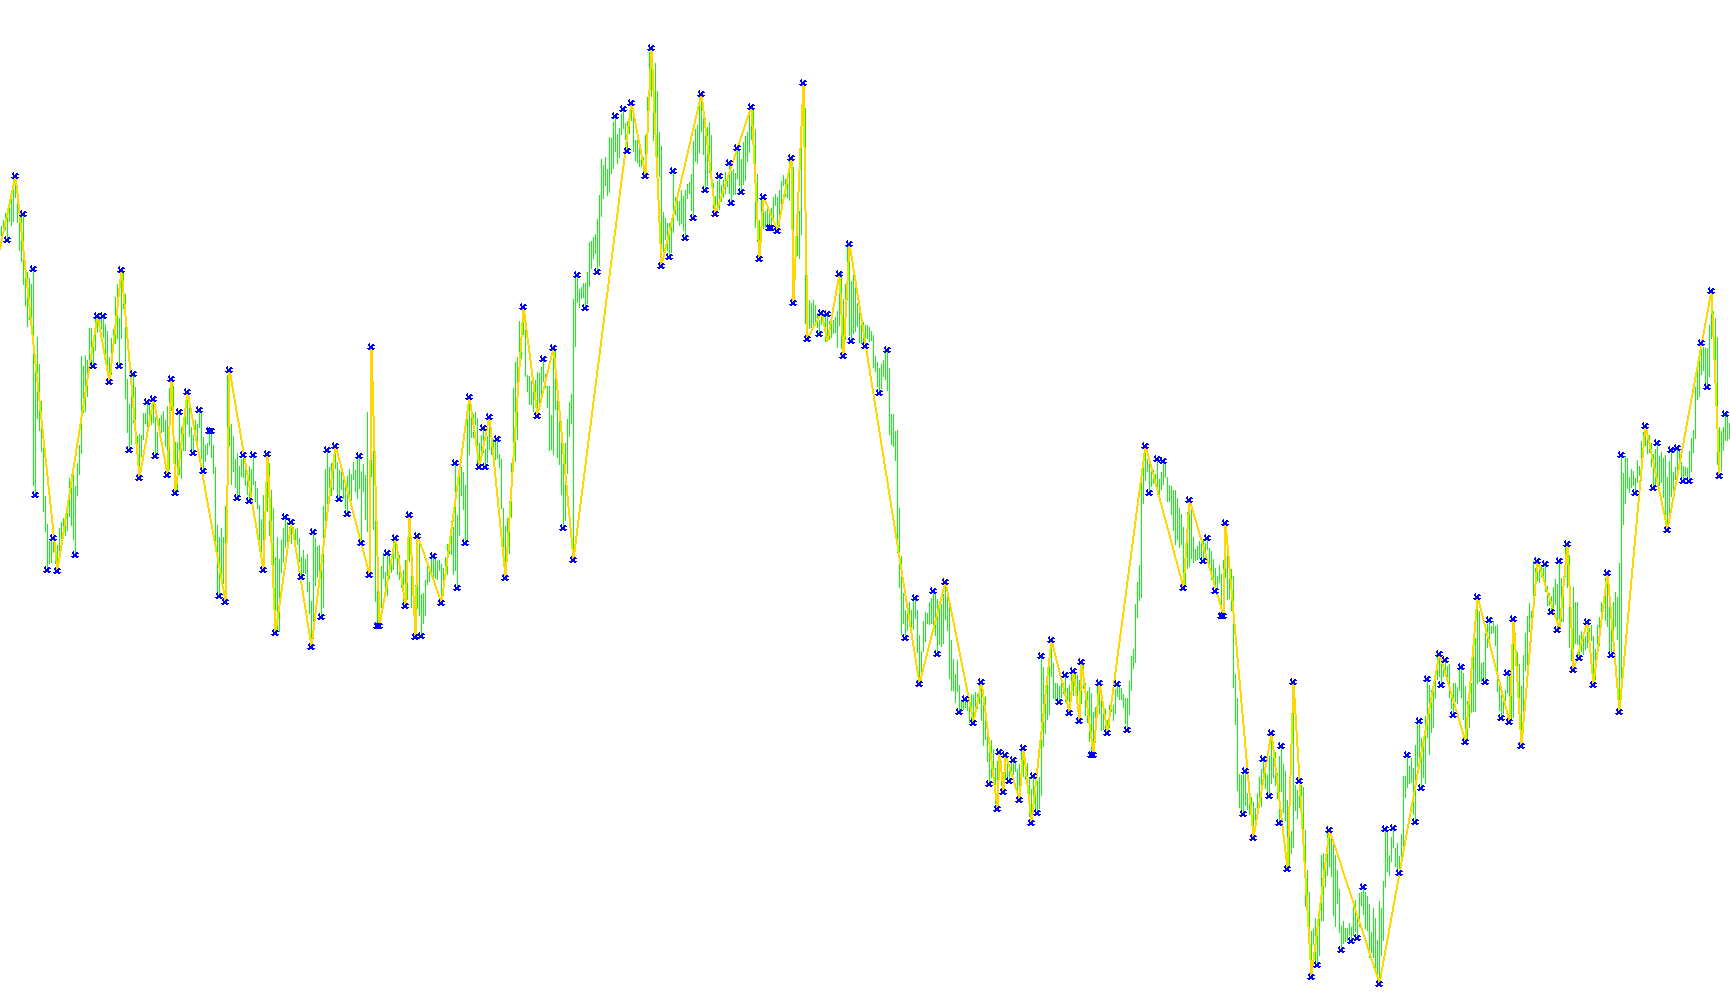
This indicator identifies structural market extremes by mapping multi-bar fractal peaks and troughs into a continuous zigzag trend line.

fractal+text
Indicator

fractal+text

This indicator identifies local price extremities by detecting peaks and troughs where a central candle's high or low exceeds the extremes of its immediate neighboring candles.

Fractal-Channel
Indicator

Fractal-Channel

iFractals
fractal
Indicator

fractal

This indicator detects local price extrema by comparing current highs and lows against various 5 to 9-bar neighborhood sequences to identify structural reversal points.

FractalAMA_MBK
Indicator

FractalAMA_MBK

This indicator dynamically adjusts its smoothing factor by calculating the fractal dimension of price action to distinguish between trending and noise-heavy market environments.

FractalAMA_MBK_v1
Indicator

FractalAMA_MBK_v1

This indicator dynamically adjusts its smoothing factor by calculating the fractal dimension of price action to distinguish between trending and noisy market environments.

FractalBest
Indicator

FractalBest

Identifies structural reversals by detecting five-bar price extremes where the central high or low point exceeds its immediate neighbors.

FractalBestAll
Indicator

FractalBestAll

Identifies local price extrema by detecting five-bar structural pivots where the center high or low exceeds the adjacent price boundaries.

FractalChannel(2)
Indicator

FractalChannel(2)

iFractals
FractalChannel
Indicator

FractalChannel

iFractals
FractalChannelh
Indicator

FractalChannelh

iFractals
FractalChannel_v1
Indicator

FractalChannel_v1

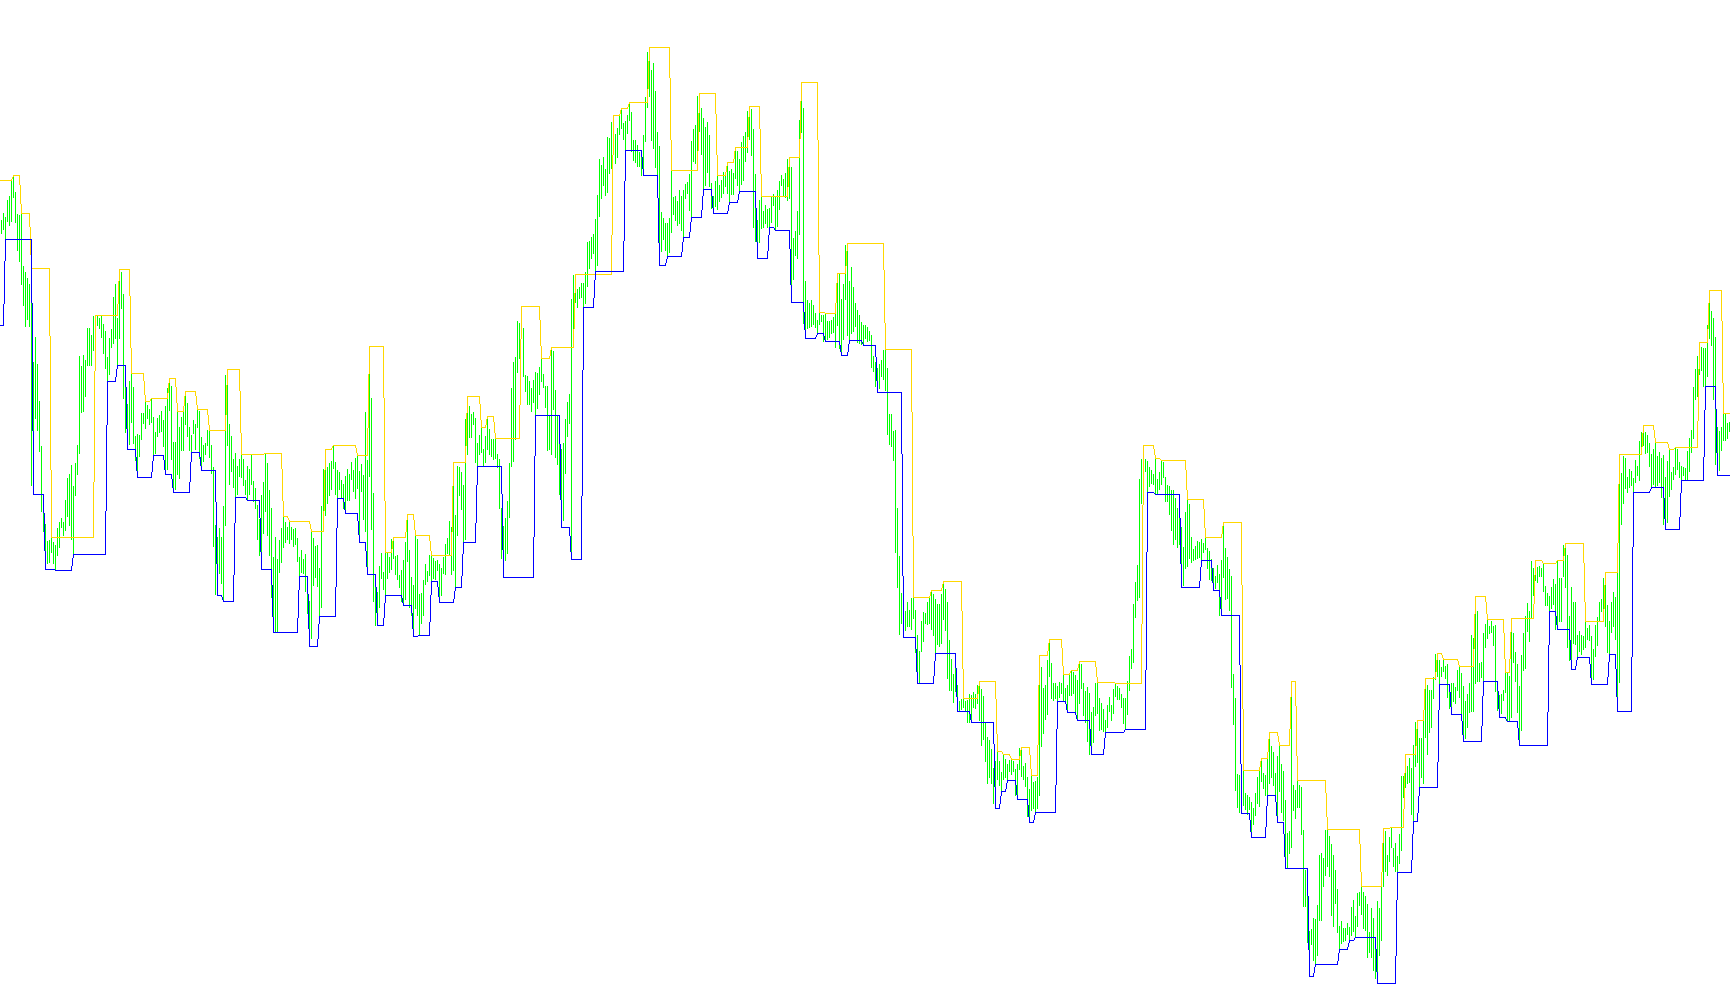
The indicator identifies local price extrema based on varying fractal neighborhood depths to dynamically construct upper, lower, and median volatility channels.

FractalChannel_v1_v1
Indicator

FractalChannel_v1_v1

Identifies structural price corridors by detecting local extrema across multiple multi-bar fractal configurations to calculate dynamic upper, lower, and median boundaries.

FractalChannel_v1_v2
Indicator

FractalChannel_v1_v2

This indicator identifies structural pivot points based on multi-bar fractal geometry to project symmetric upper and lower boundary channels with a dynamic median midline.

FractalChannel_v2
Indicator

FractalChannel_v2

iFractals
FractalChannel_v3
Indicator

FractalChannel_v3

This indicator identifies multi-bar price extrema to construct a dynamic price corridor and equilibrium zone based on local fractal peaks.

FractalChannel_v4
Indicator

FractalChannel_v4

This indicator identifies structural price extremes using fractal geometric patterns to project a variable-margin channel consisting of upper, lower, and median equilibrium lines.

FractalChannel_v4_v1
Indicator

FractalChannel_v4_v1

This indicator dynamically projects structural support and resistance zones by identifying consecutive fractal extremes and calculating offset margins.

FractalChannel_v5
Indicator

FractalChannel_v5

This indicator generates a three-band channel by dynamically projecting boundaries based on multi-bar fractal extremes and configurable narrowing ratios.

FractalIchimoku_v1
Indicator

FractalIchimoku_v1

This indicator reconstructs the Kinko Hyo cloud components by replacing standard moving averages with price extremes derived from a fractal channel analysis.

FractalLevels
Indicator

FractalLevels

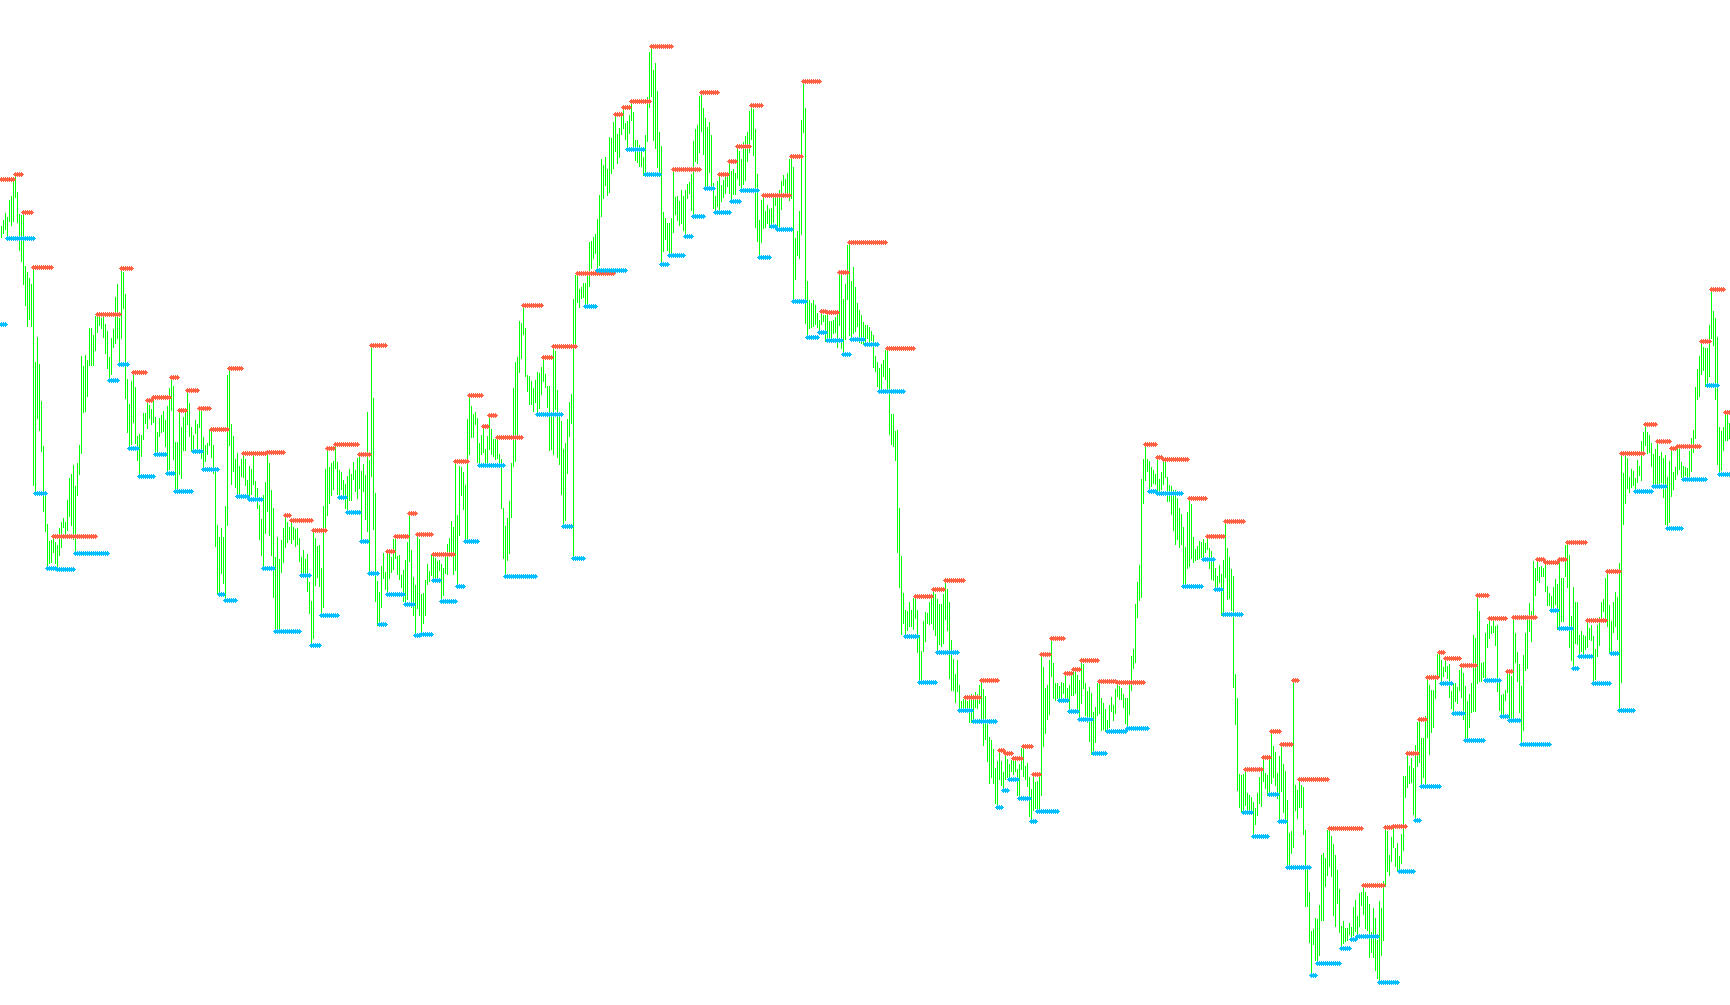
Identifies local price extrema to project dynamic horizontal supply and demand zones while signaling immediate structural trend reversals and breakout events.

FractalLevels_v1
Indicator

FractalLevels_v1

This indicator identifies local price extremes by detecting high and low peaks within a specified bar range to project structural resistance and support levels.

Indicator

Fractals Ind 1 - mod 1hr fib

Indicator

Fractals Ind 1 - mod 1hr

Fractals+3
Indicator

Fractals+3

Identifies local price extremes by detecting recursive peak and trough patterns across varying bar sequences from 5 to 9 candles.

Fractals+Signal+diapazon
Indicator

Fractals+Signal+diapazon

This indicator identifies structural price reversals by detecting fractal patterns across multiple bar spans ranging from 5 to 9 periods.

Fractals
Indicator

Fractals

Identifies local price extremes by scanning for high and low peaks across variable bar ranges of 5 to 9 units.

Fractals5+Signal+diapazon
Indicator

Fractals5+Signal+diapazon

Identifies local structural extrema by comparing five-bar high/low relationships and maps the price range between fractal pivots.

Fractals5+Signal+diapazon_Maloma
Indicator

Fractals5+Signal+diapazon_Maloma

This indicator identifies structural pivot points by scanning multi-bar price extremes (5 to 9 bars) to detect significant local supply and demand zones.

Fractals5+Signal
Indicator

Fractals5+Signal

This indicator identifies local price extrema by detecting five-bar structural peaks and troughs to generate directional reversal signals.

Fractals5+Signal_v1
Indicator

Fractals5+Signal_v1

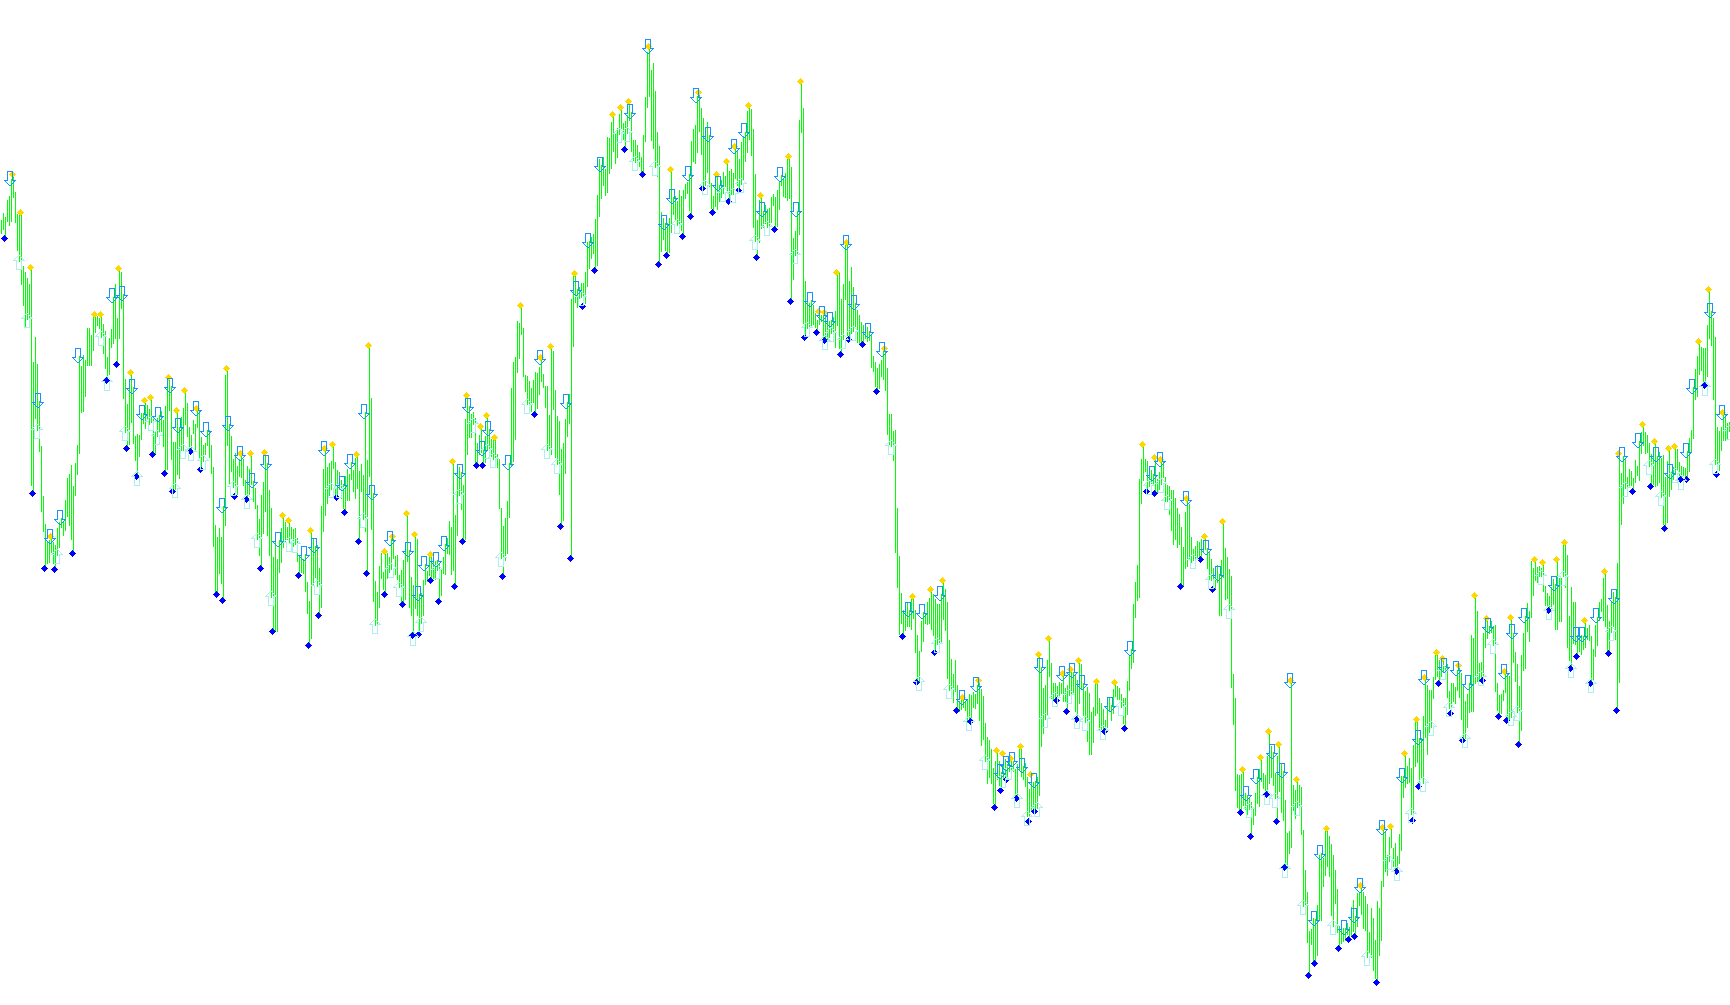
Identifies local price extrema by detecting five-bar price oscillations to project directional reversal signals on the chart.
Fractals5+Signal_v2
Indicator

Fractals5+Signal_v2

Identifies structural price extremes by detecting local peaks and troughs where the center bar surpasses its immediate neighbors' boundaries.
Fractals5-diapazon
Indicator

Fractals5-diapazon

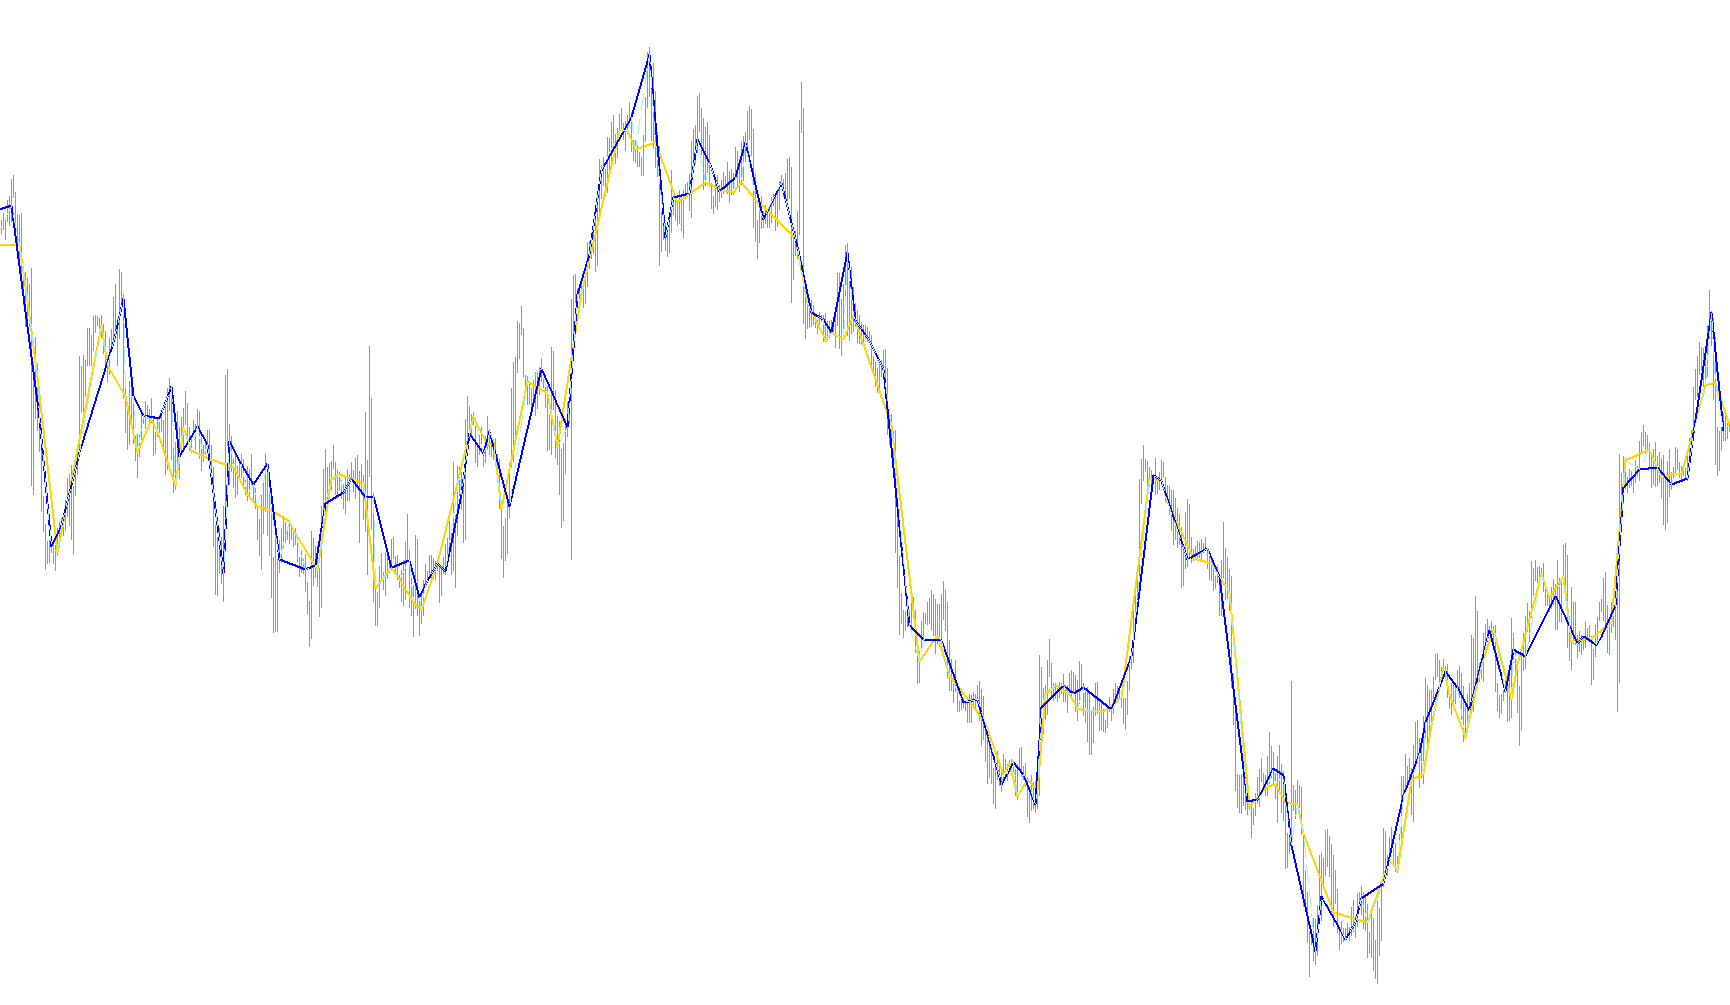
Identifies structural pivot points by detecting local extrema over a five-bar window to delineate supply and demand boundaries.

Fractals9
Indicator

Fractals9

Identifies local price peaks and troughs by detecting specific multi-bar high and low relational patterns.

FractalsJPYDNv2
Indicator

FractalsJPYDNv2

iFractalsiATR
FractalsJPYUPv2
Indicator

FractalsJPYUPv2

iFractalsiATR
FractalsPaint
Indicator

FractalsPaint

This indicator identifies local price extrema by comparing a central candle's high and low against a five-bar window to project directional histogram peaks.

Fractals[1]
Indicator

Fractals[1]

This indicator identifies structural pivot points by validating price extremes across variable bar spans ranging from three to nine periods.

Fractals_Adjustable_Lookback
Indicator

Fractals_Adjustable_Lookback

iFractals
Fractals_expfx_alerts
Indicator

Fractals_expfx_alerts

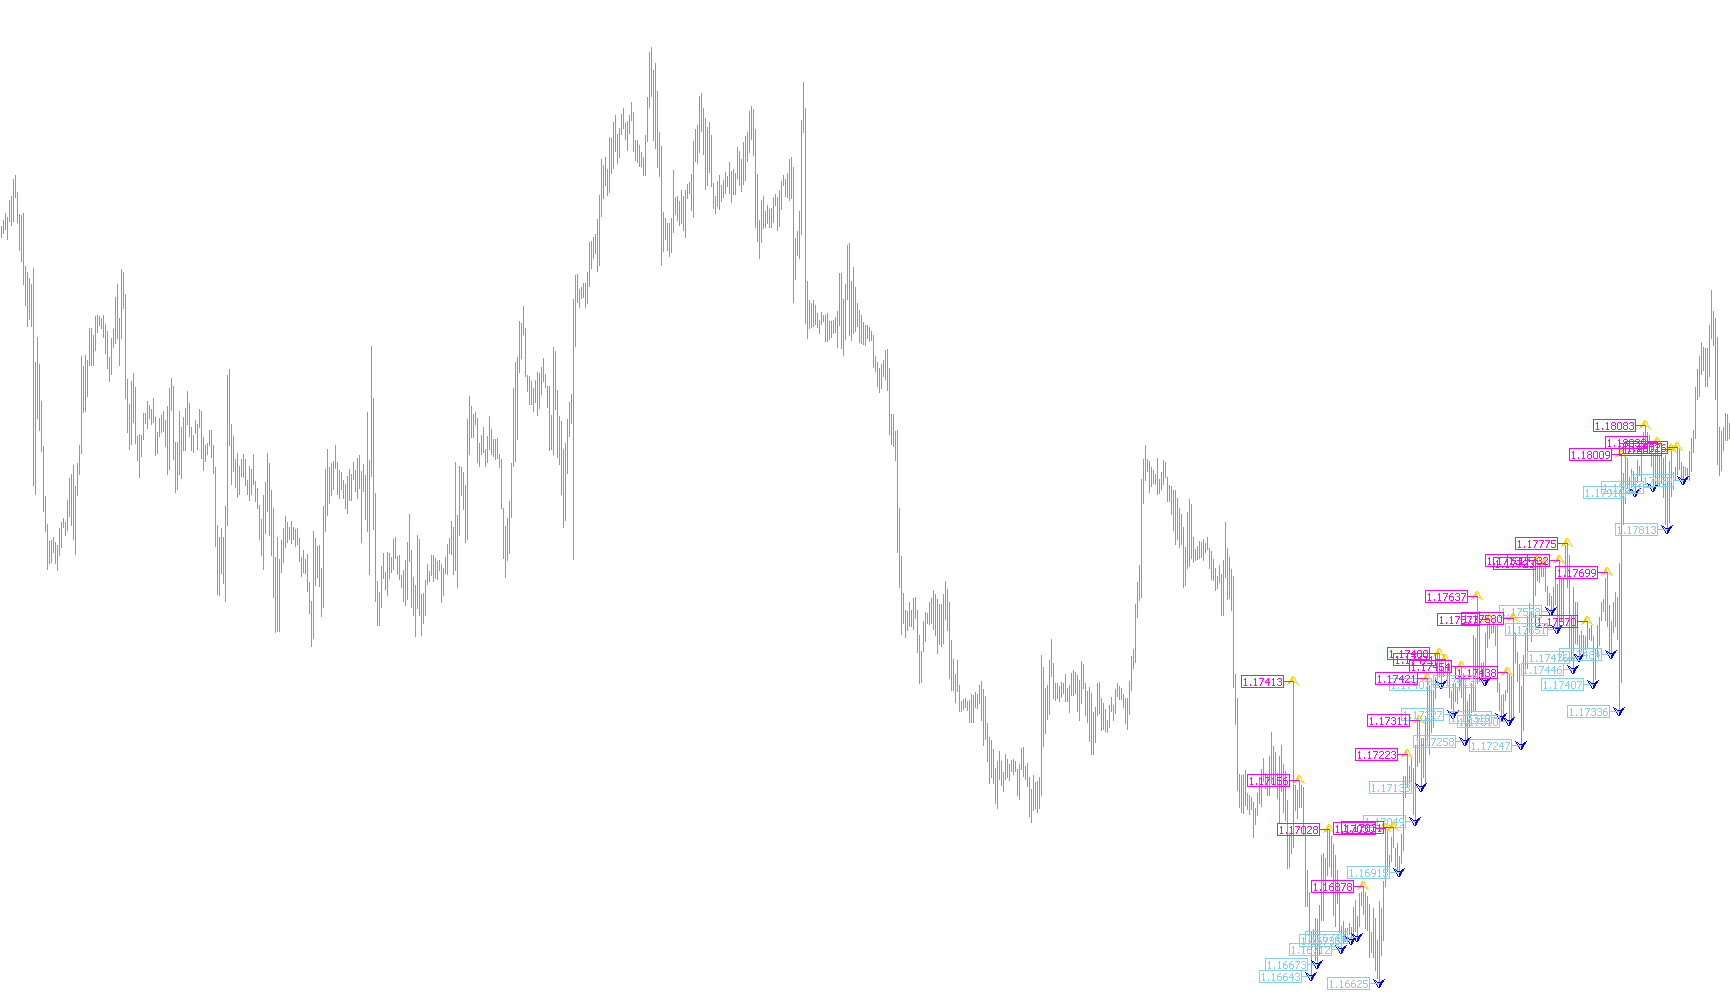
This indicator identifies significant structural highs and lows by scanning for multi-bar peak formations across varying neighbor configurations to pinpoint local price reversals.

Fractals_Price
Indicator

Fractals_Price

Identifies structural turning points by validating price extremes across variable window sizes ranging from 3 to 9 consecutive bars.