FractalChannel_v2
Download script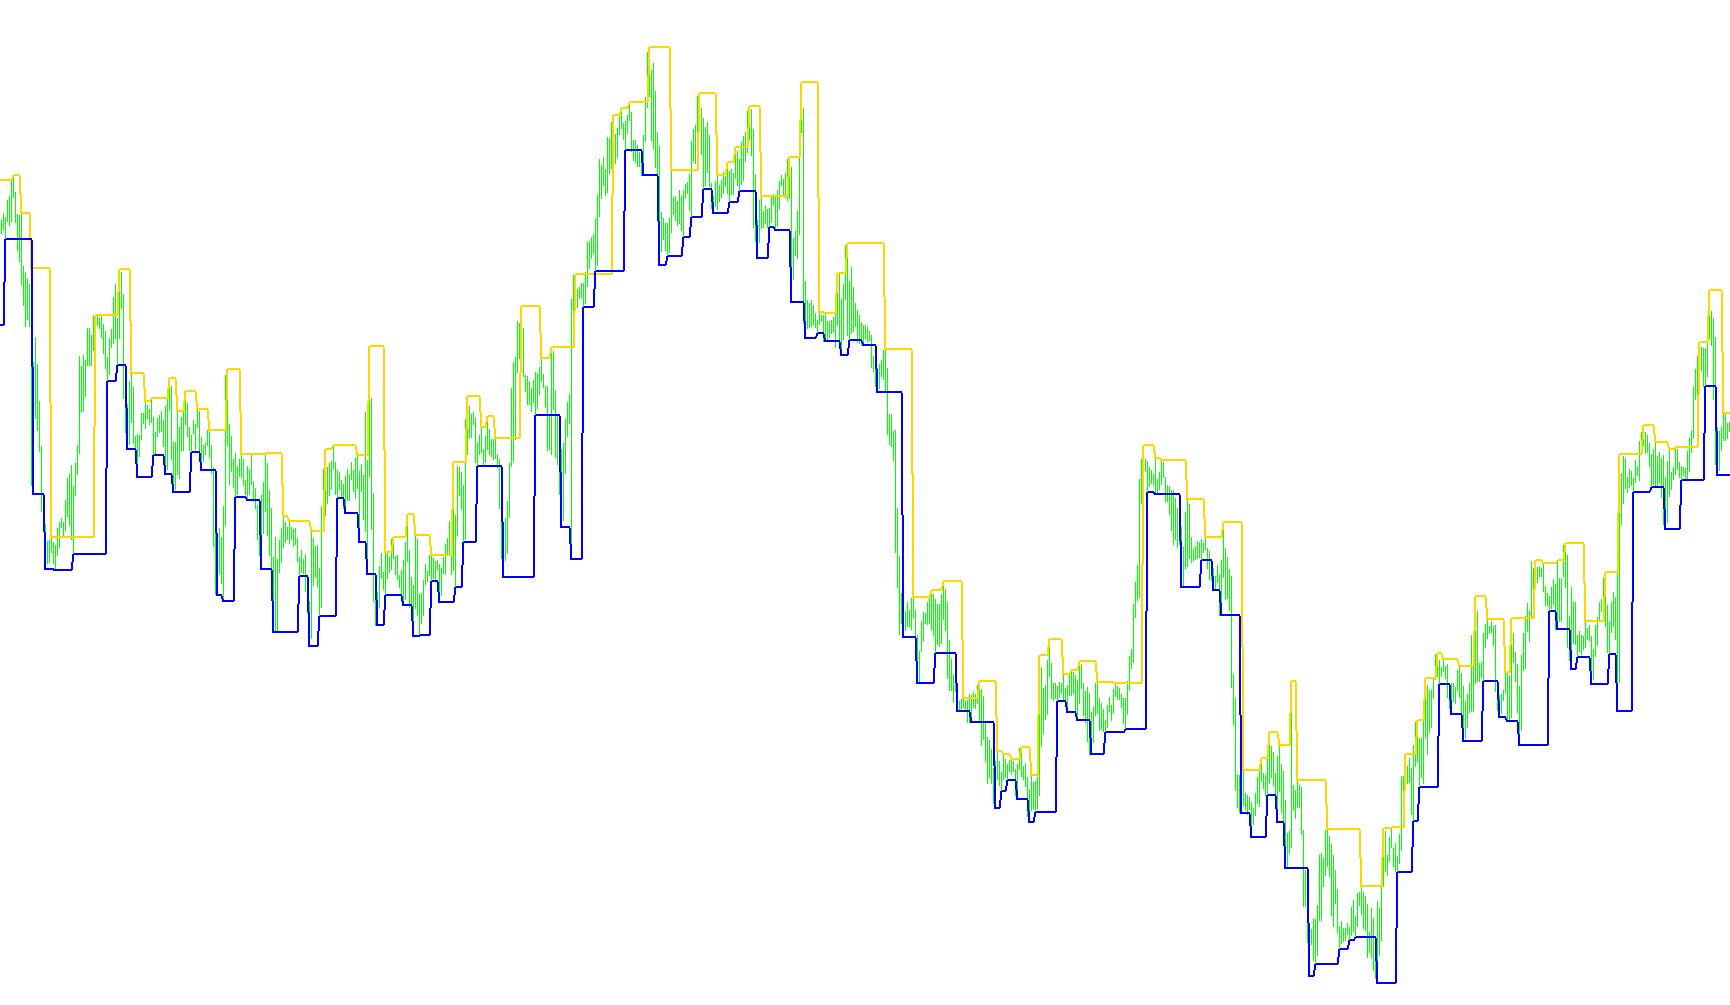
This tool is designed to help traders visualize key price levels on a chart by identifying historical "peaks" and "valleys" in market movement. It automatically tracks and connects these significant points to form clear boundaries of Resistance (the ceiling) and Support (the floor).
How the Logic Works
The script operates by scanning through the price history of a specific financial instrument to find specific price formations known as "Fractals." Here is the step-by-step logic:
1. Identifying Market Extremes The system looks for two types of price points:
- Upper Fractals: These represent local highs where the price reached a peak before reversing downward. These act as potential Resistance levels.
- Lower Fractals: These represent local lows where the price bottomed out before moving upward. These act as potential Support levels.
2. Tracking and "Holding" Price Levels A key feature of this script is its persistence. Instead of only showing a dot at a specific peak or valley, the logic ensures that once a new Fractal point is identified, that price level remains visible until a new one is formed.
- If the script detects a new high (Upper Fractal), it updates the Resistance line to that new price.
- If no new high is detected at a specific moment in time, the script "remembers" and carries over the previous Resistance price from the past.
This creates a continuous, stepped visual effect on your chart.
3. Visual Representation The script translates these calculations into two distinct lines:
- Resistance Line (Red): This shows you the most recent significant high point. It helps you see where the market has struggled to break through in the past.
- Support Line (Blue): This shows you the most recent significant low point, helping you identify where buyers have historically stepped in to prevent further price drops.
Summary for the Trader
Essentially, this script clears away the "noise" of minor price fluctuations and highlights the structural boundaries of the market. By drawing these lines, it helps you visualize the "channel" in which the price is currently moving, allowing you to better identify where a trend might stall or where a breakout might occur.
//+------------------------------------------------------------------+
//|                                             Fractal Channel.mq4  |
//|                                 Copyright © 2005  Chris Battles  |
//|                                             cbattles@neo.rr.com  |
//+------------------------------------------------------------------+
#property copyright "Chris Battles"
#property link      "mailto:cbattles@neo.rr.com"

#property indicator_chart_window
#property indicator_buffers 2
#property indicator_color1 Red
#property indicator_color2 Blue
//---- buffers
double v1[];
double v2[];
//----
double val1;
double val2;
int i;
//+------------------------------------------------------------------+
//|                                                                  |
//+------------------------------------------------------------------+
int init()
  {
//---- drawing settings
   SetIndexArrow(0, 119);
   SetIndexArrow(1, 119);
//----
   SetIndexStyle(0, DRAW_LINE, STYLE_SOLID, 2);
   SetIndexDrawBegin(0, i-1);
   SetIndexBuffer(0, v1);
   SetIndexLabel(0, "Resistance");
//----
   SetIndexStyle(1, DRAW_LINE, STYLE_SOLID, 2);
   SetIndexDrawBegin(1, i-1);
   SetIndexBuffer(1, v2);
   SetIndexLabel(1, "Support");
//----
   return(0);
  }
//+------------------------------------------------------------------+
//|                                                                  |
//+------------------------------------------------------------------+
int start()
  {
   i = Bars;
   while(i >= 0)
     {
       val1 = iFractals(NULL, 0, MODE_UPPER, i);
       //----
       if(val1 > 0)
           v1[i] = High[i];
       else
           v1[i] = v1[i+1];
       val2 = iFractals(NULL, 0, MODE_LOWER, i);
       //----
       if(val2 > 0)
           v2[i] = Low[i];
       else
           v2[i] = v2[i+1];
       i--;
     }
   return(0);
}

//+------------------------------------------------------------------+
Comments