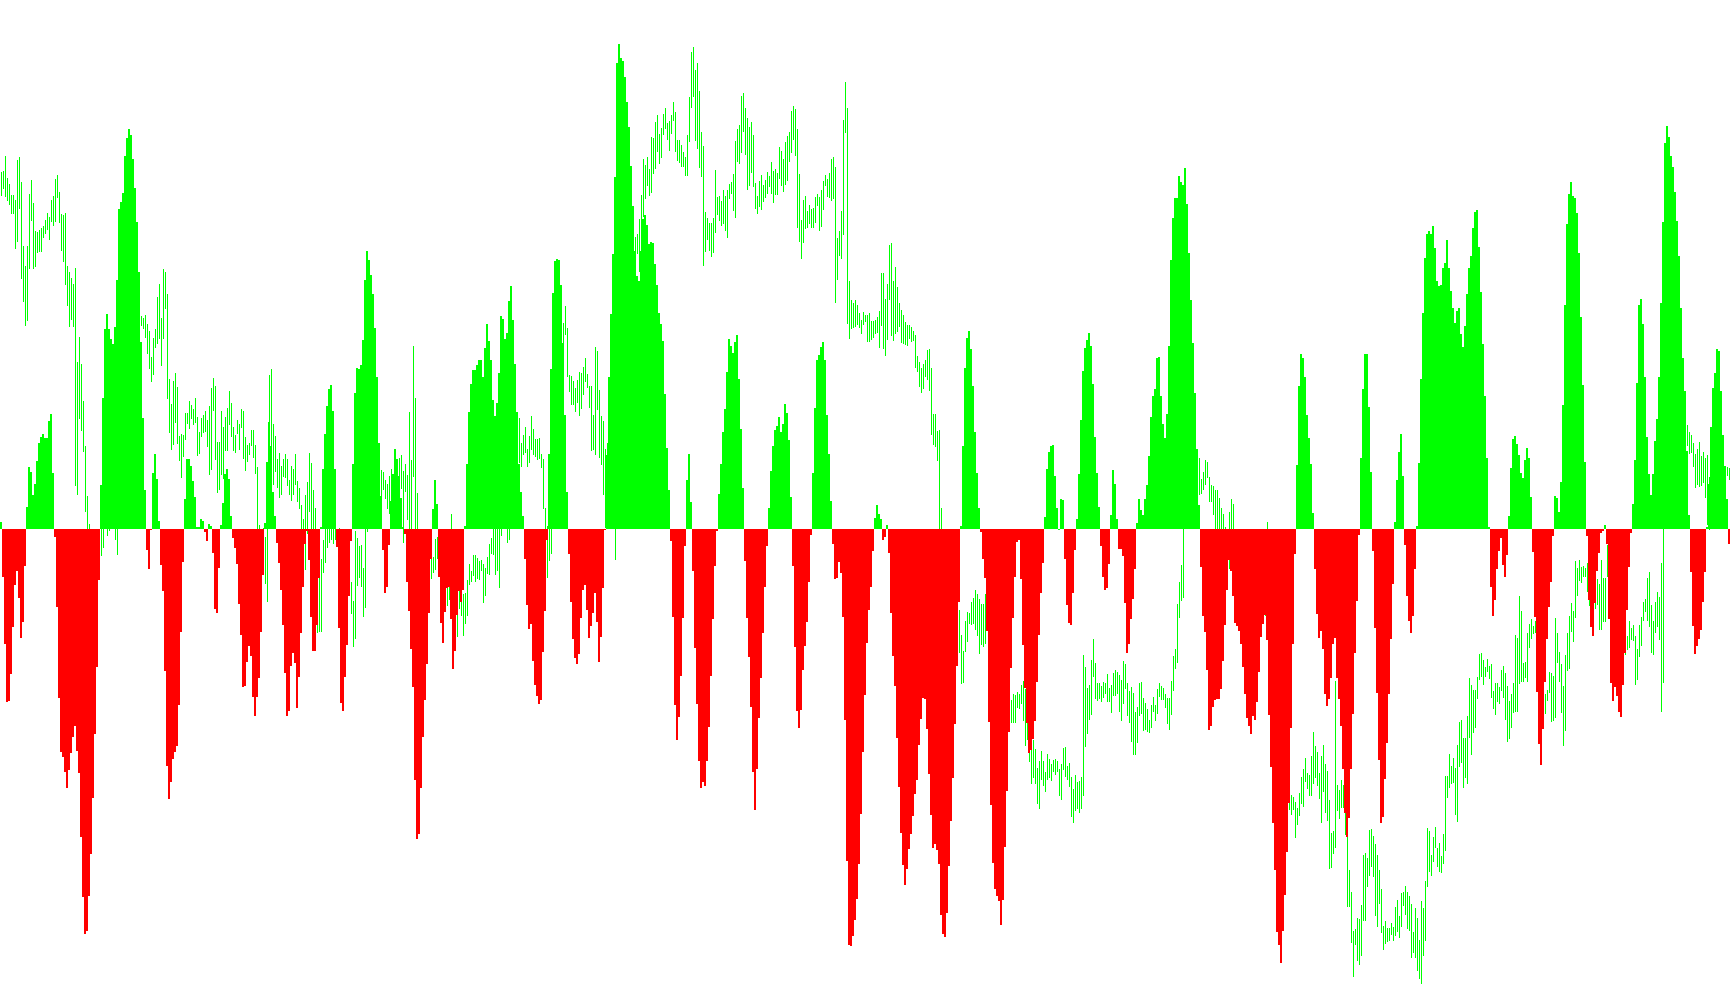
FXA0 - RSI Crossing 50 plus ATR ver1.2
Indicator

FXA0 - RSI Crossing 50 plus ATR ver1.2

iATRiRSI

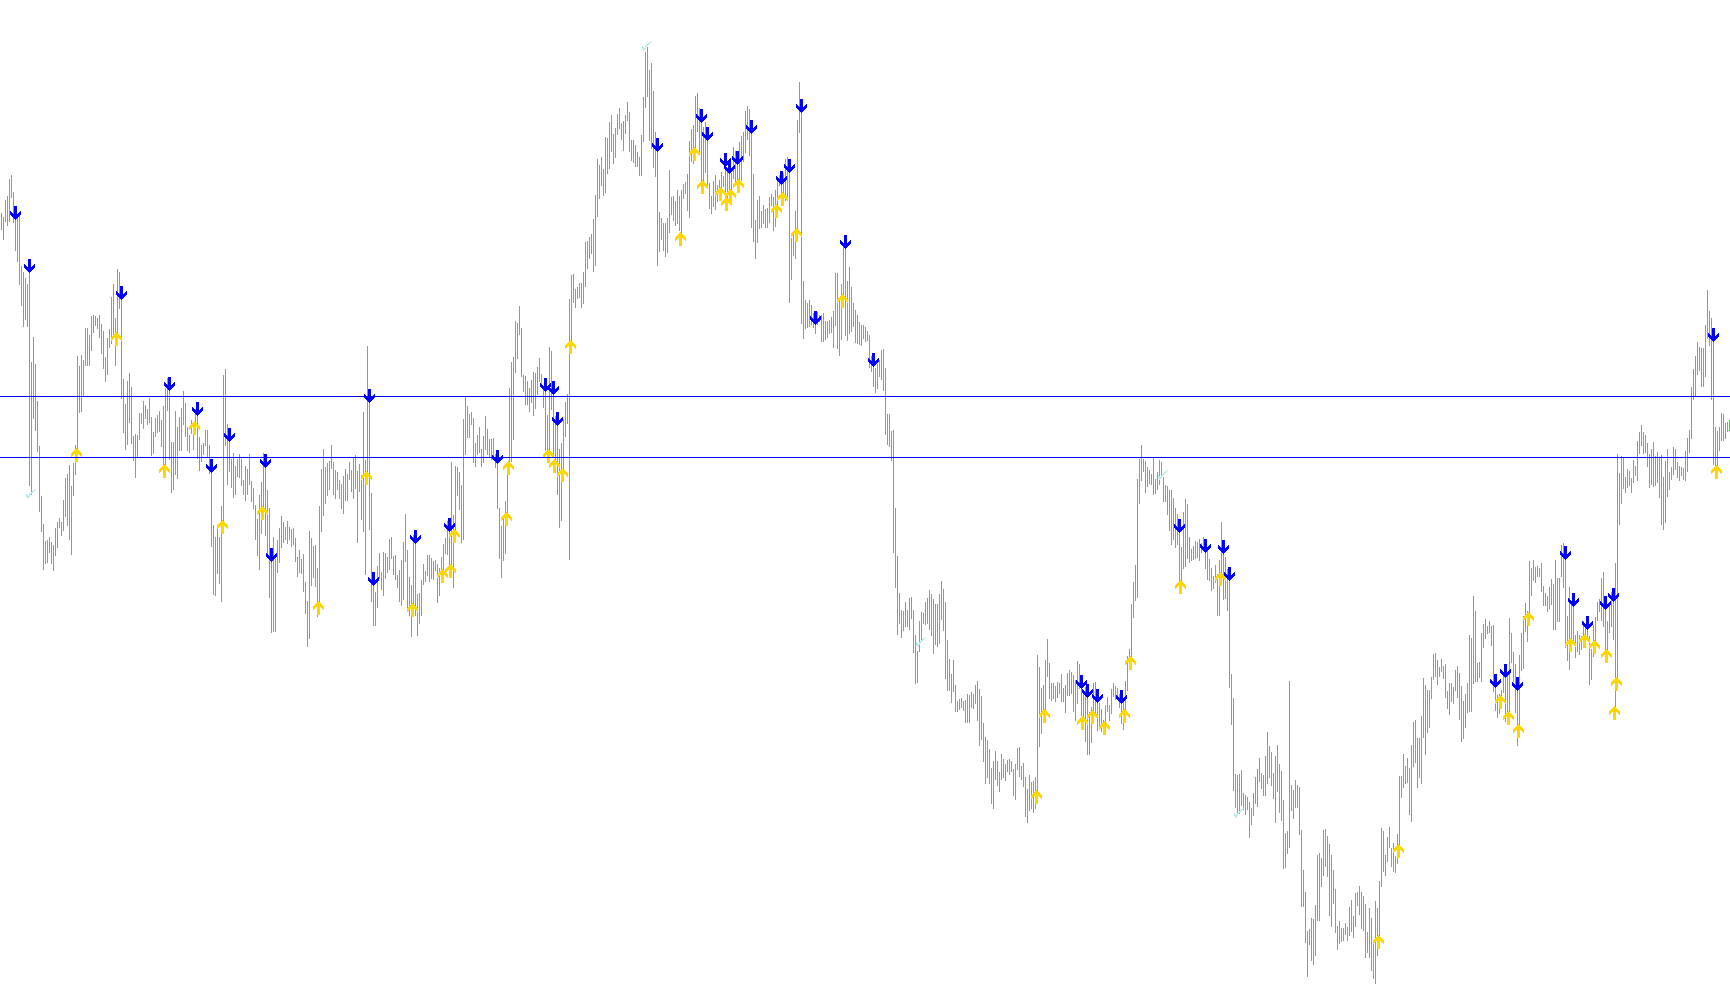
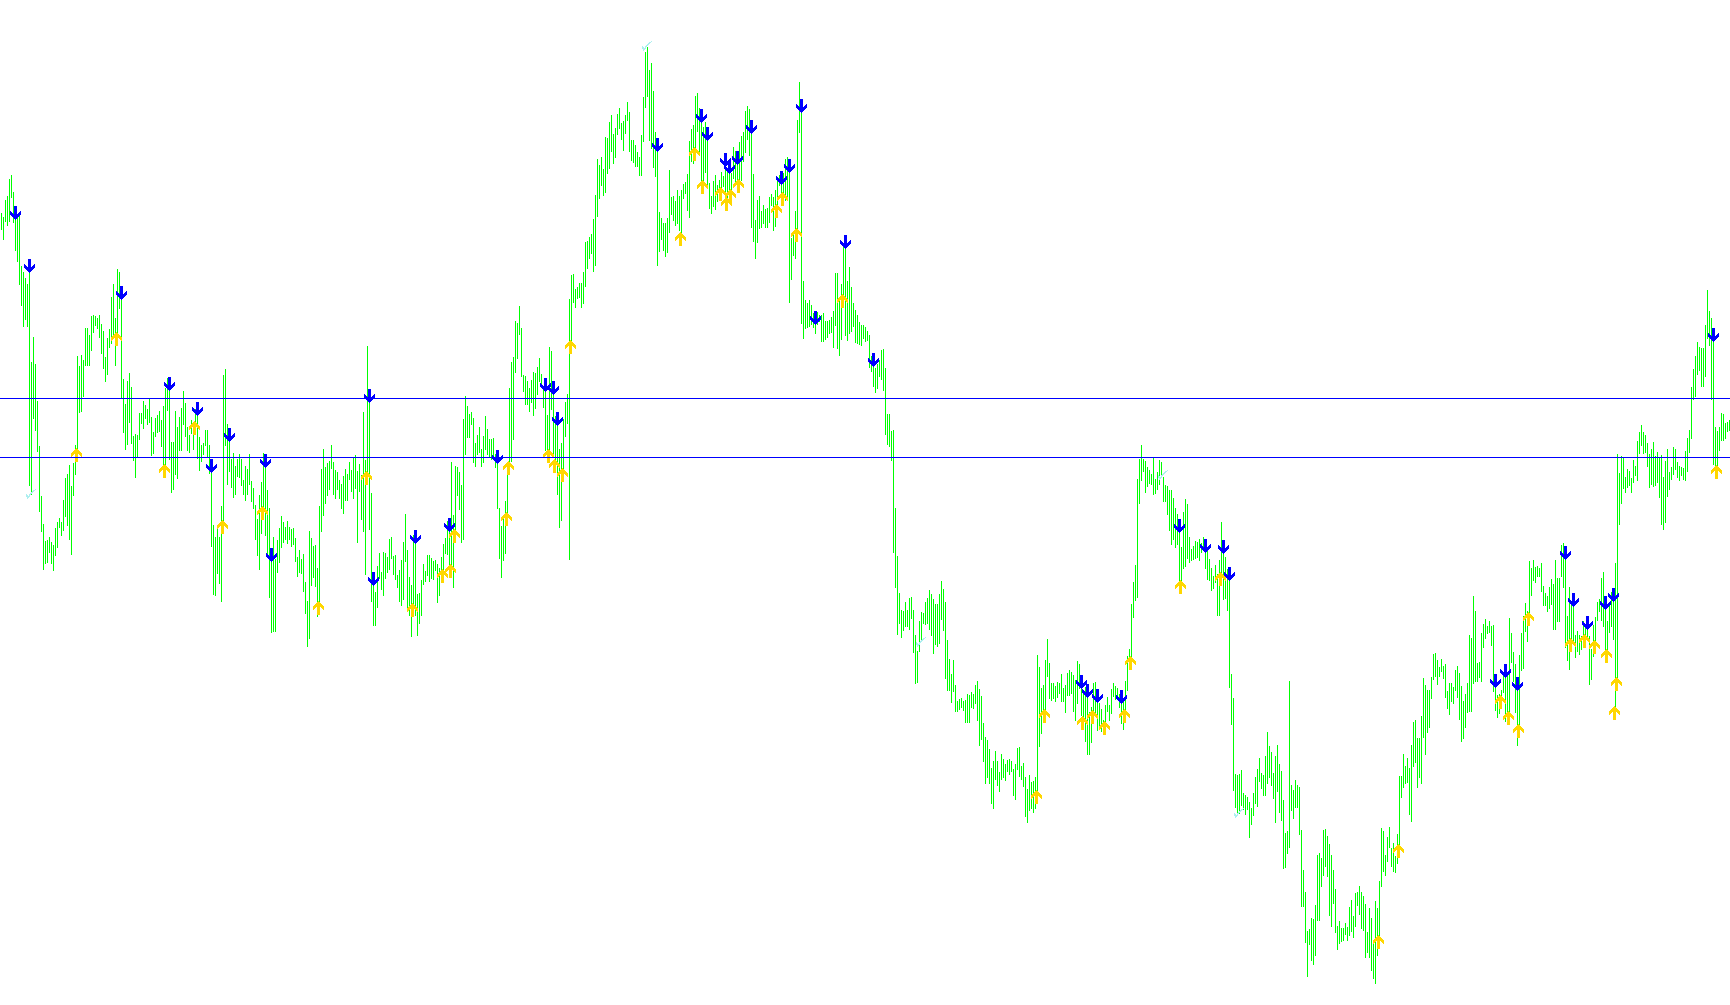
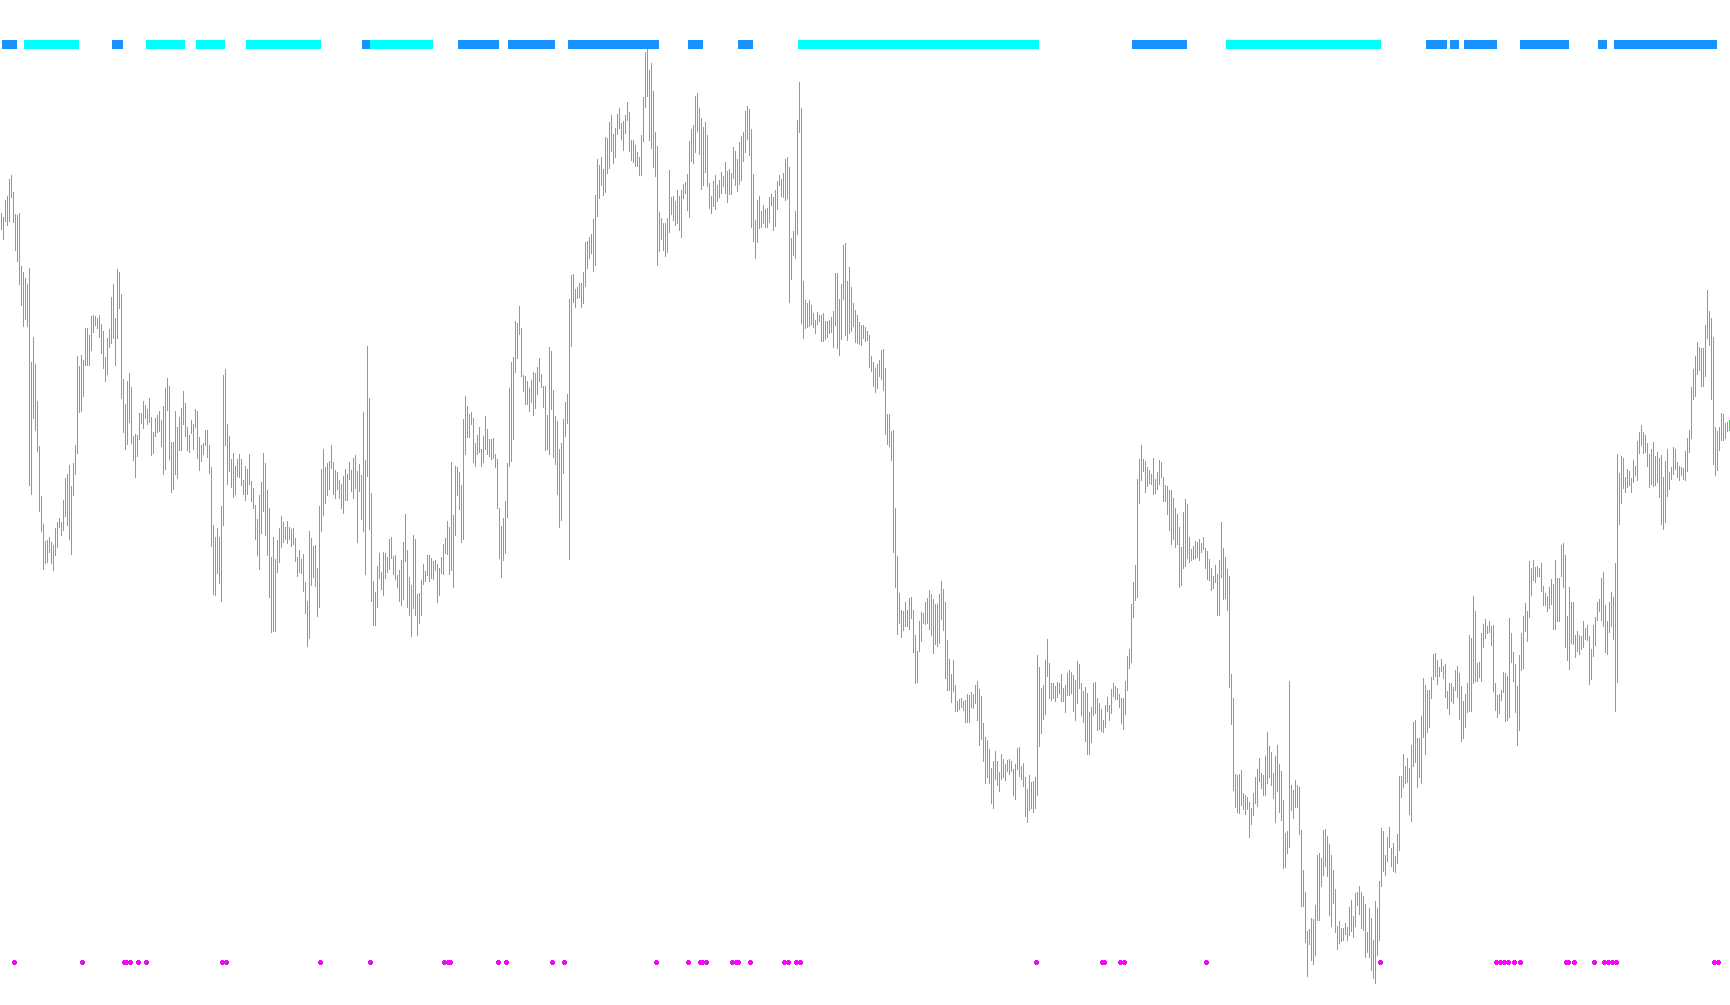
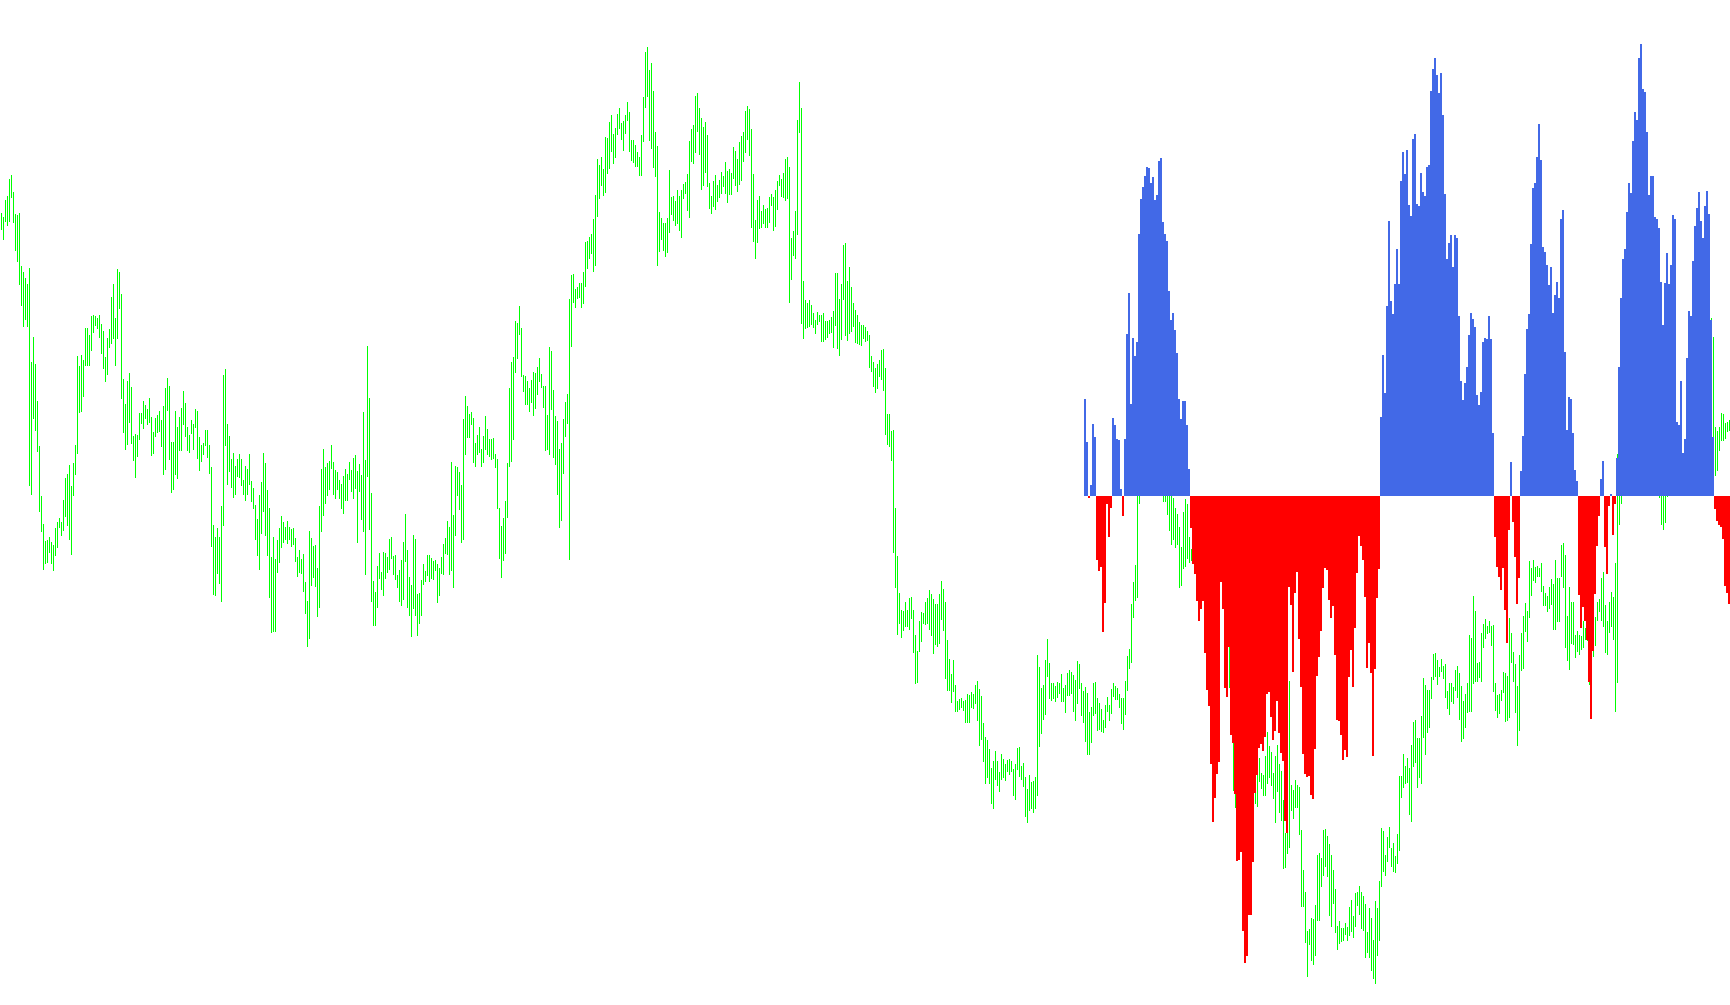
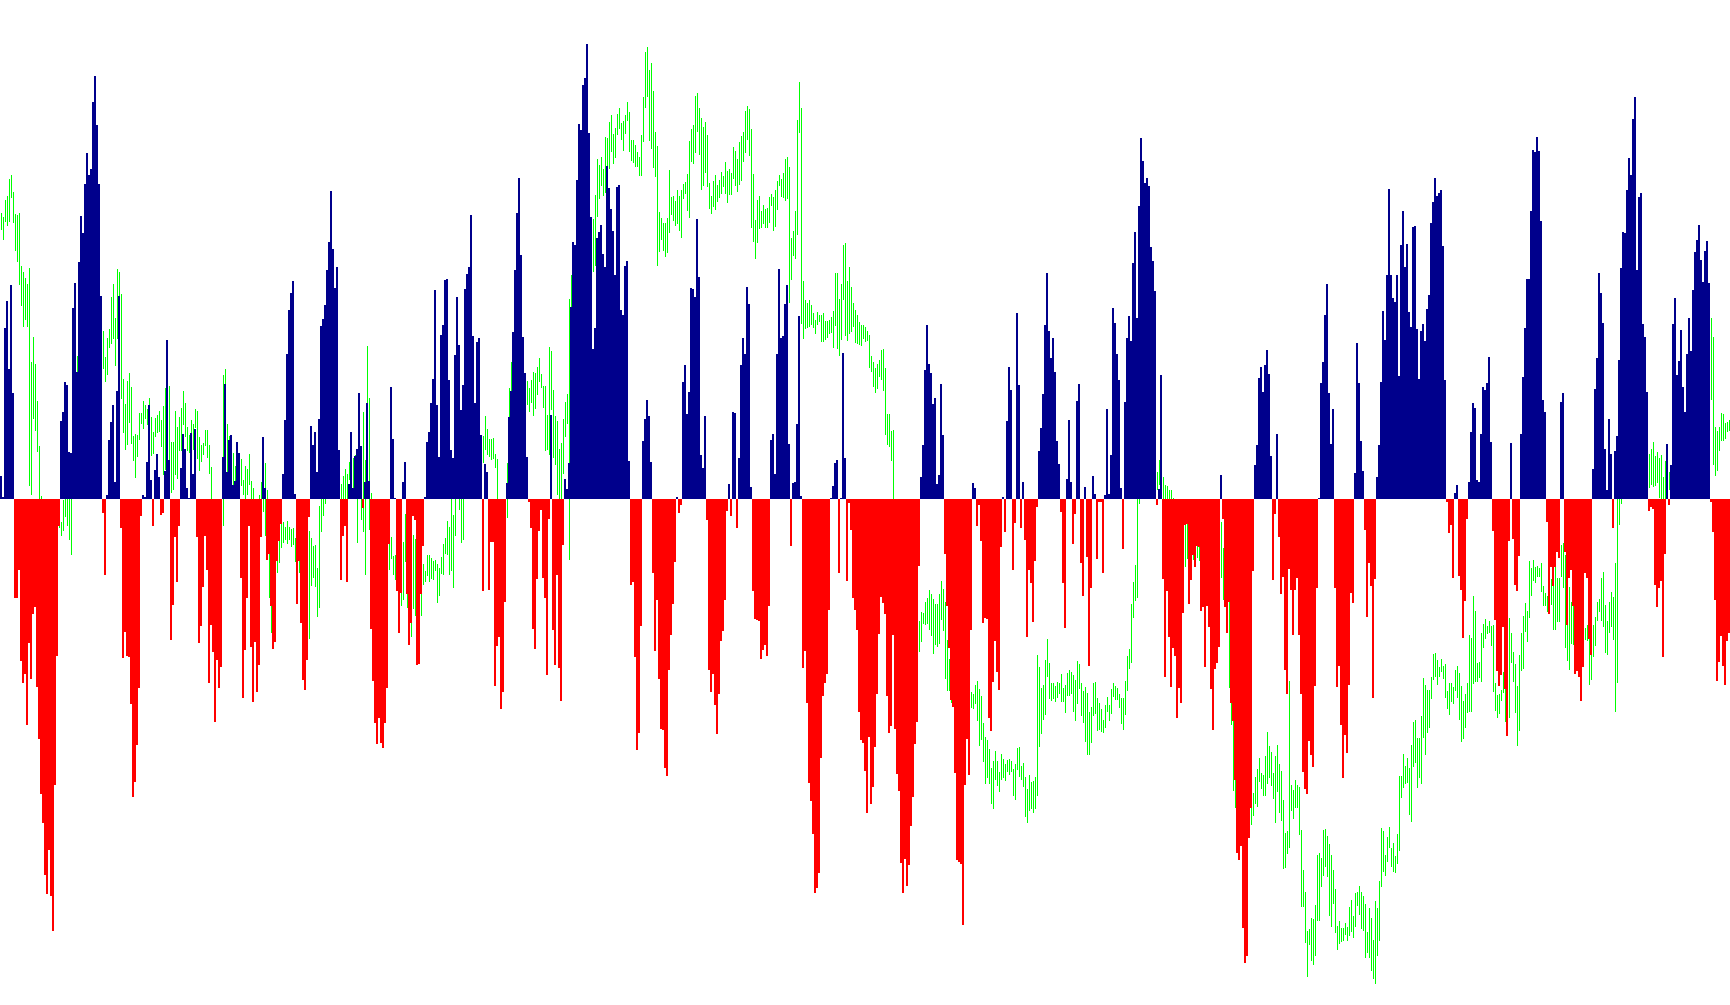
This indicator identifies bullish and bearish reversals by monitoring RSI crossovers at the 50-level midpoint while dynamically projecting entry targets and stop-losses based on ATR volatility scaling.

FXA0 - RSI Crossing 50 plus ATR ver1
Indicator

FXA0 - RSI Crossing 50 plus ATR ver1

iATRiRSI

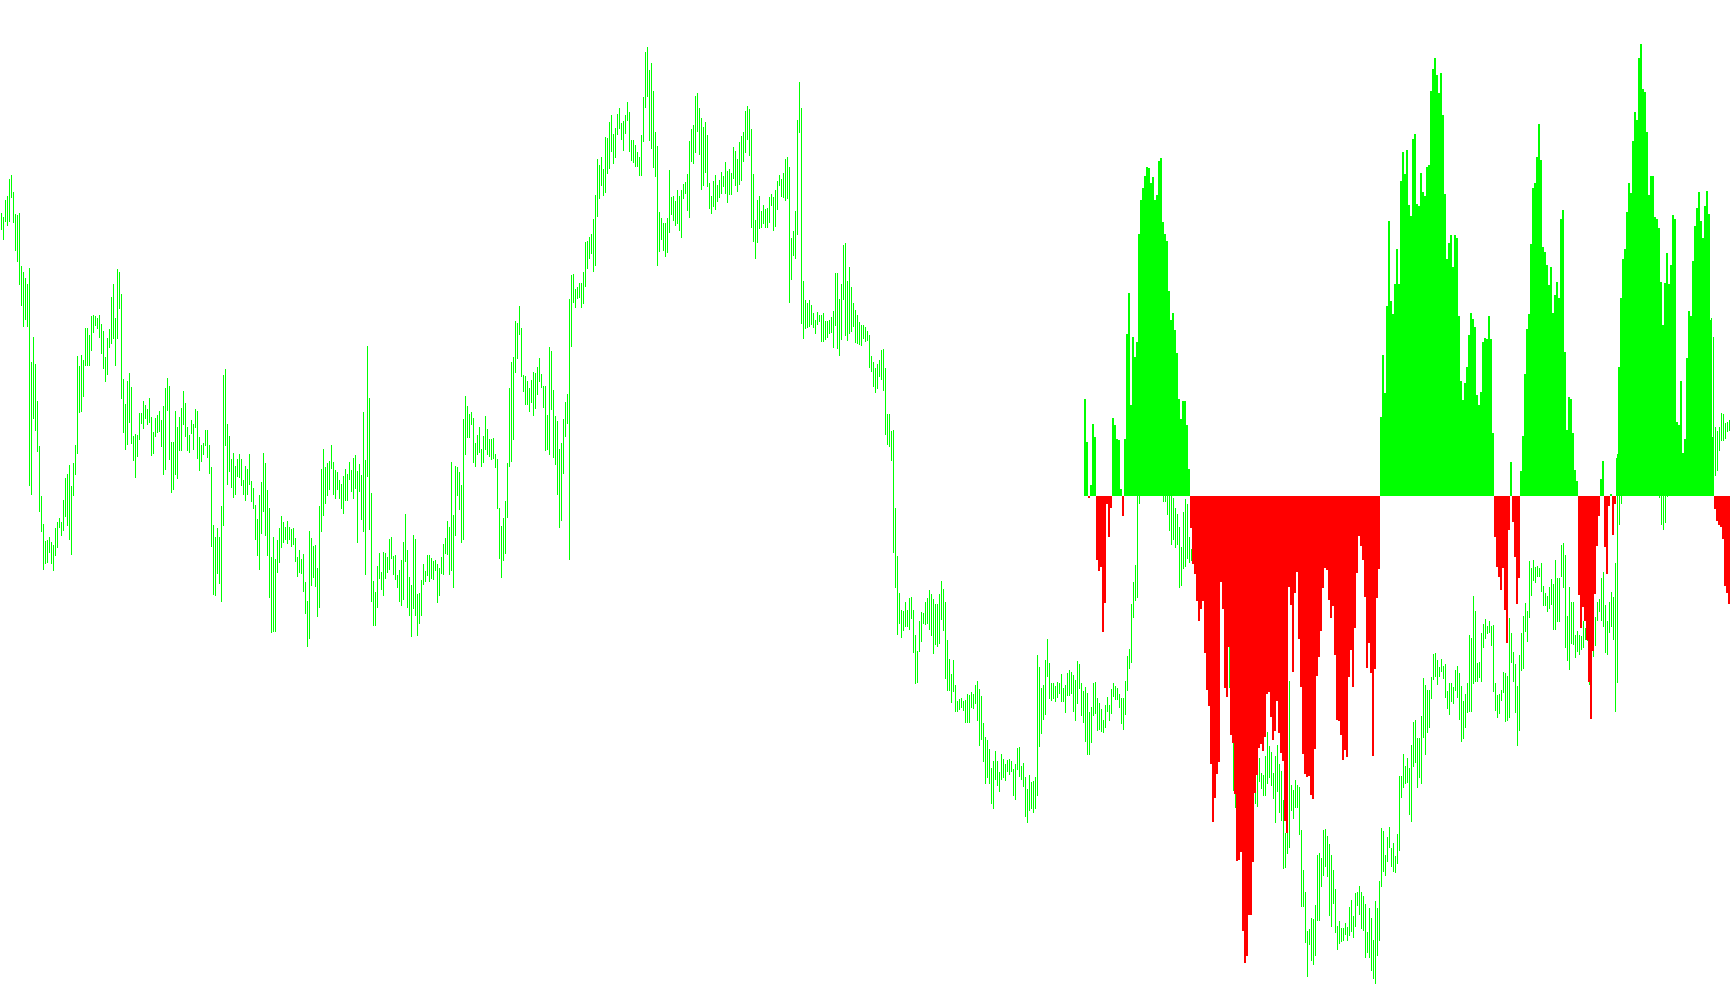
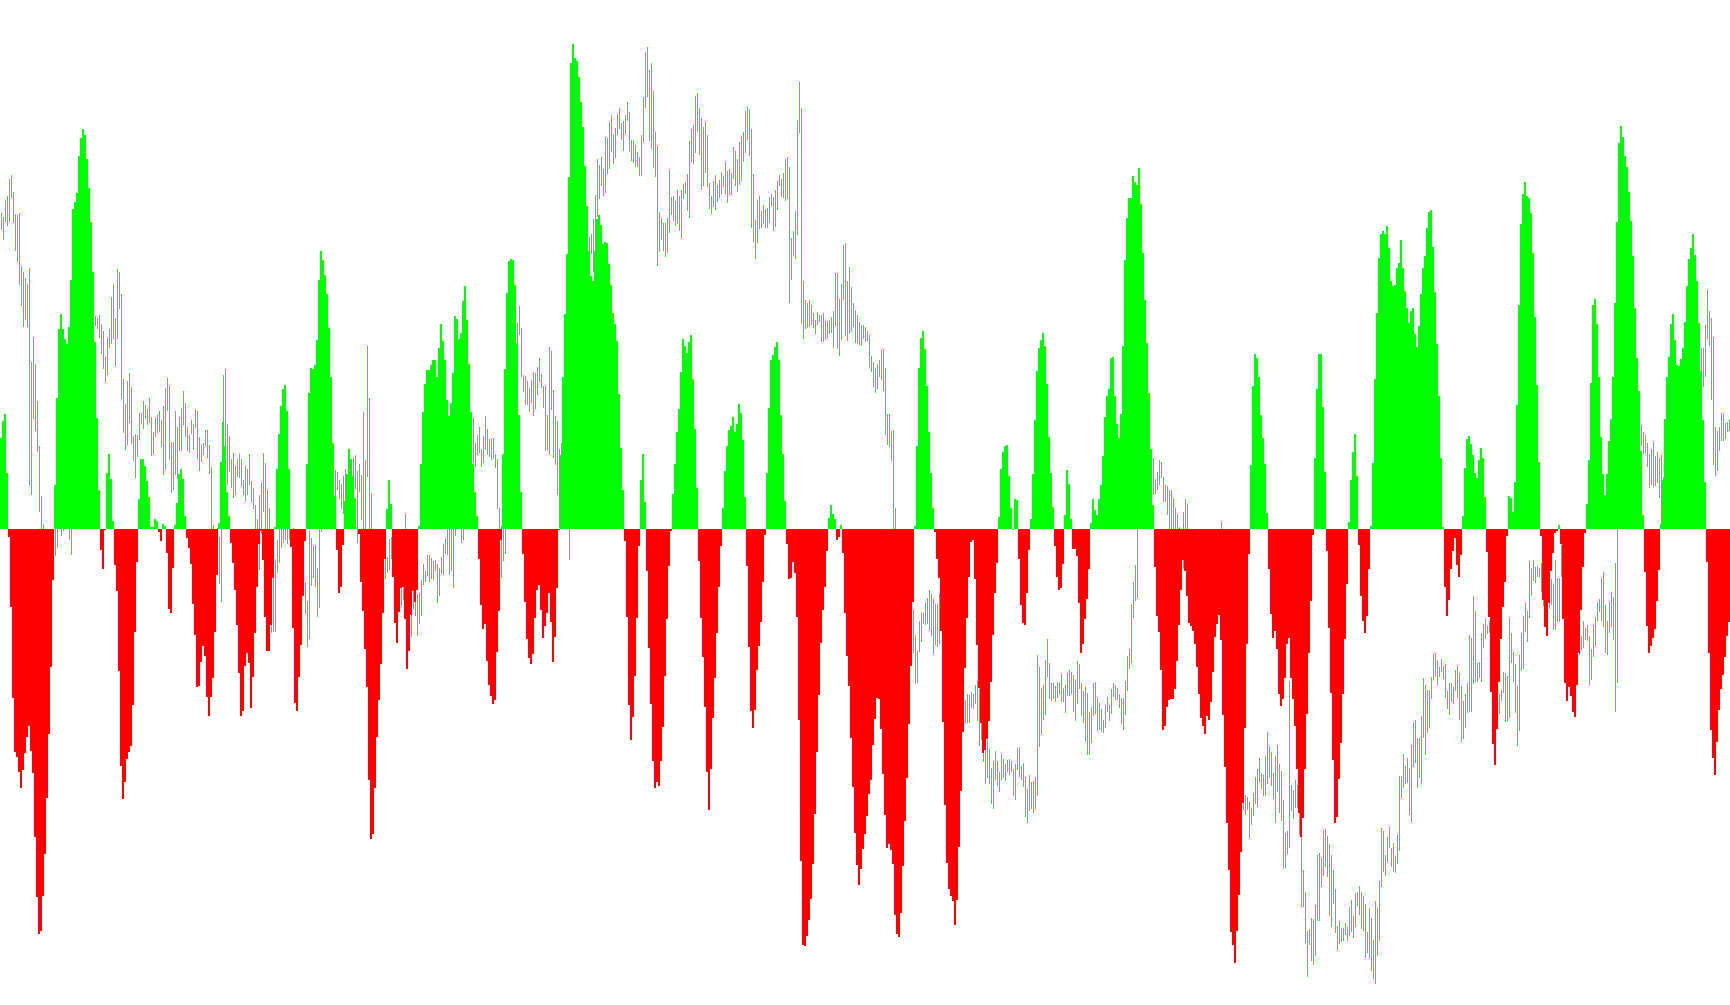
This indicator identifies trend reversals and expansionary momentum by detecting Relative Strength Index crossings at the 50 equilibrium, while projecting ATR-based volatility targets and profit-taking levels.

FXFreedomBars_v2
Indicator

FXFreedomBars_v2

iCCIiMA

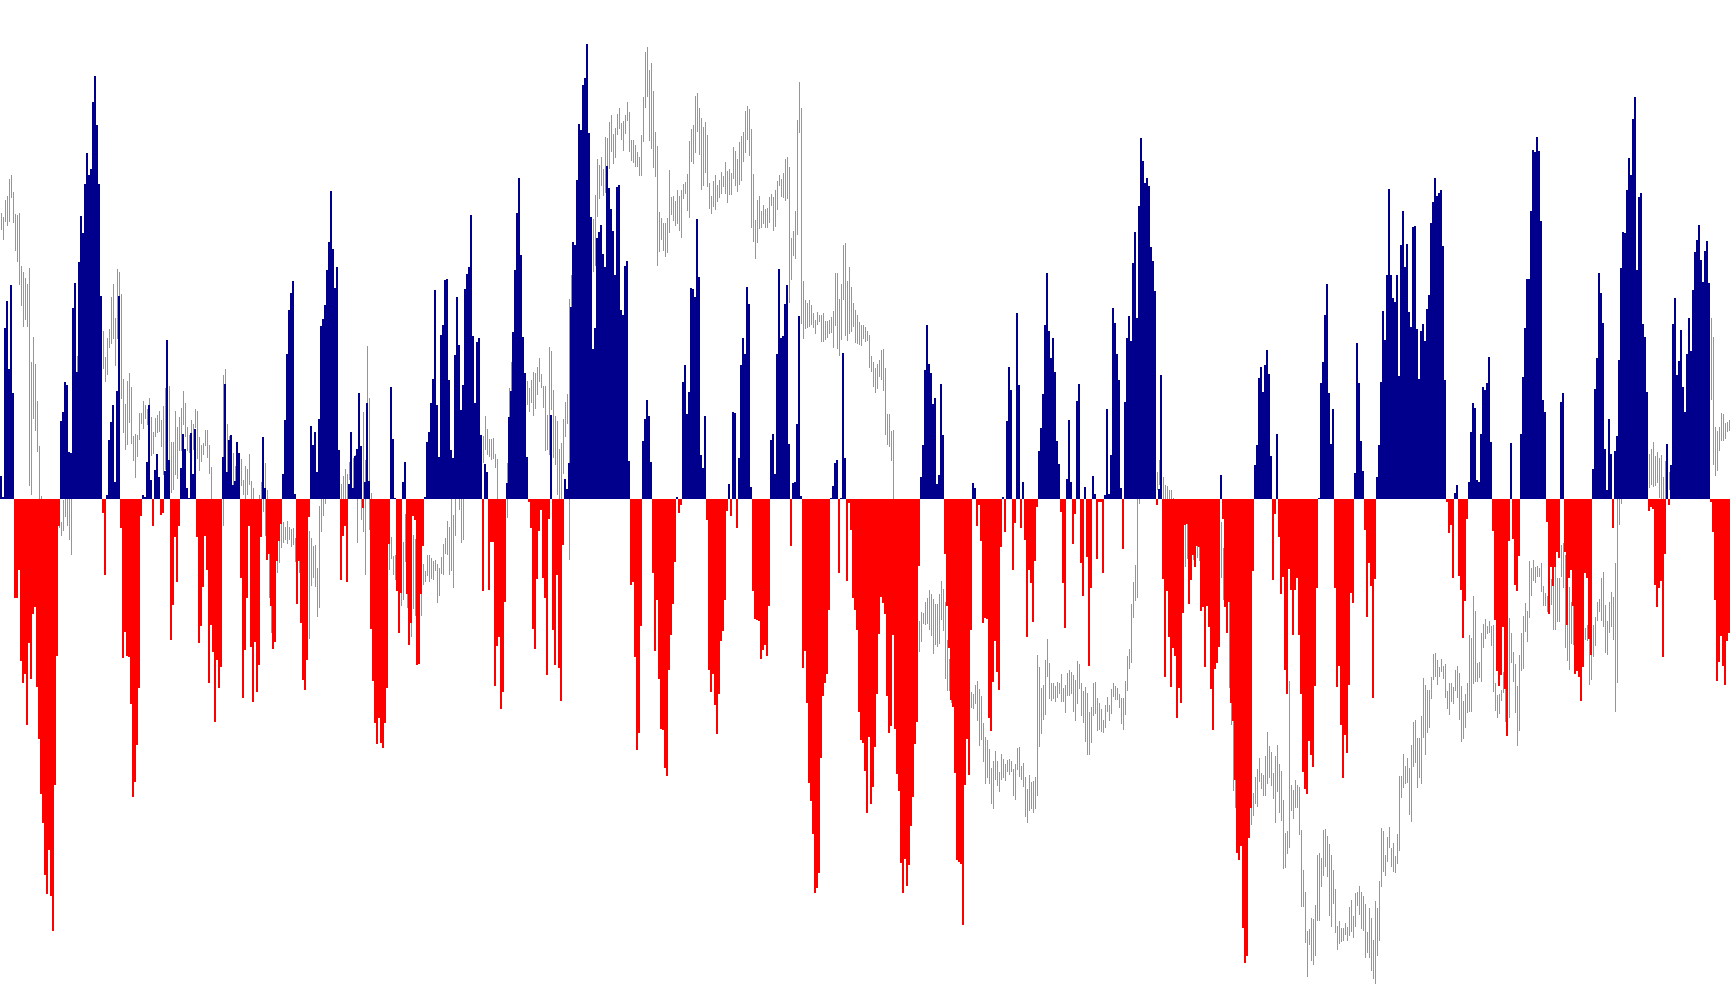
This indicator identifies directional bias by comparing real-time price action against smoothed moving averages across multiple synchronized timeframes.

FXFreedomBars_v3
Indicator

FXFreedomBars_v3

iCCIiMA

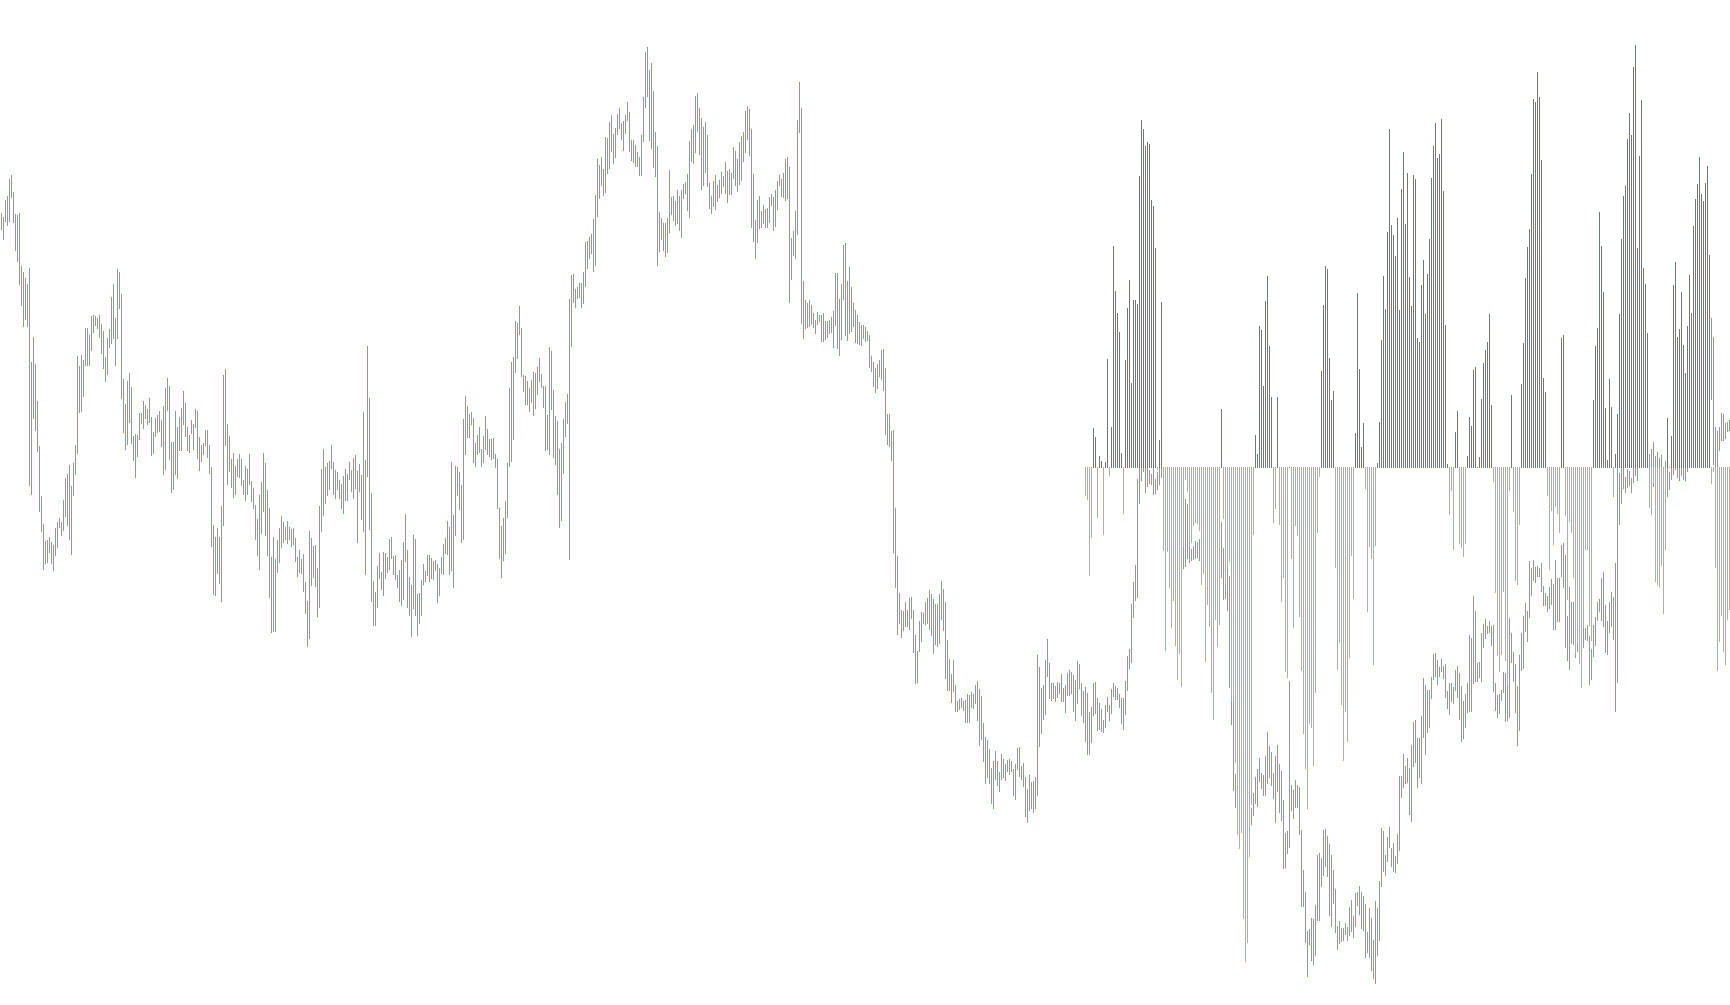
This indicator synchronizes Price Action with Moving Average trends across four distinct timeframes simultaneously to identify multi-layered trend alignment.

FXGaugeMAs_lite
Indicator

FXGaugeMAs_lite

iMA

This indicator renders a synchronized ensemble of seven Simple Moving Averages mapped to classic Fibonacci intervals to visualize structural momentum and trend curvature.

FXGauge_lite
Indicator

FXGauge_lite

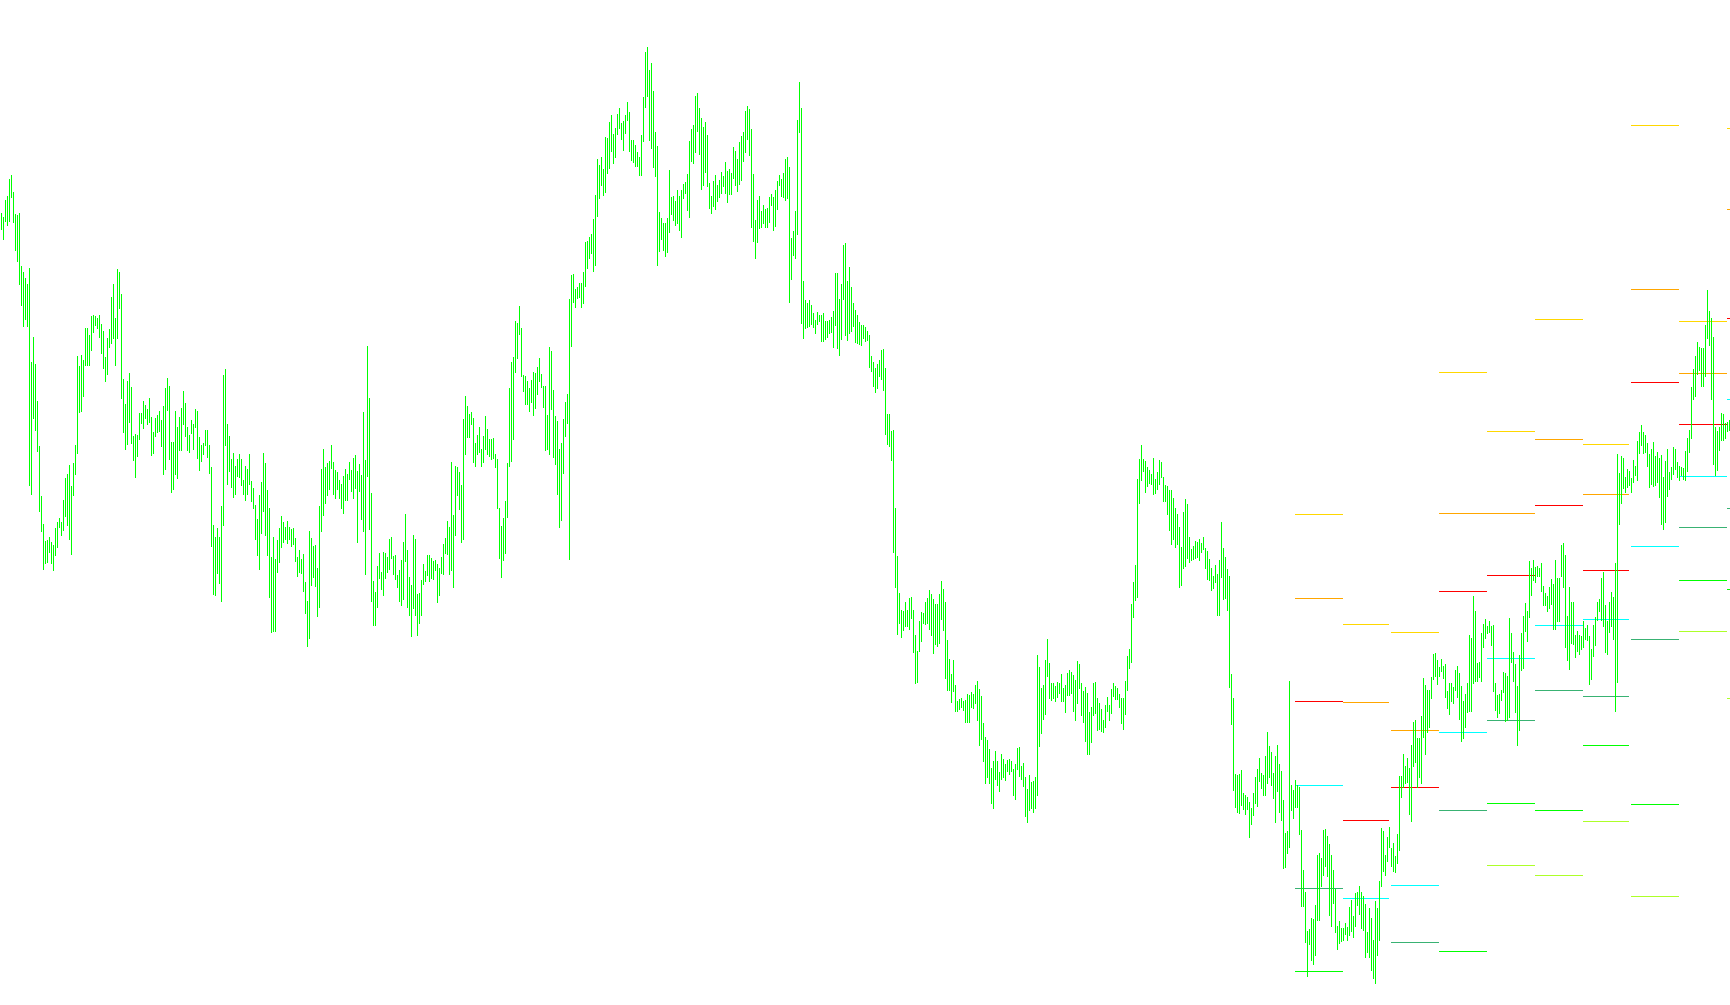
This indicator synthesizes multi-timeframe moving average data into a visual heat map of price zones, identifying high-confluence support/resistance clusters through dynamic overlap analysis.

FXI_All_Pivots
Indicator

FXI_All_Pivots

This indicator dynamically maps daily price action into a comprehensive visual framework by plotting standard pivots, median distribution levels, and Camarilla breakdown zones based on historical range volatility.

Indicator

FXi_Alpha_Expert-Advisor

Indicator

FXi_Alpha_FiboPivots-v2

FXI_Point&Figure-Adv
Indicator

FXI_Point&Figure-Adv

This indicator translates price action into a Point and Figure structure to automatically identify and alert on technical formations like Triple Tops, Ascending Triangles, and Bullish/Bearish Catapults.

FXI_Point&Figure-Adv_001
Indicator

FXI_Point&Figure-Adv_001

This indicator converts price action into a Point and Figure chart structure to autonomously identify and alert on specific geometric formations such as Triple Tops, Ascending Triangles, and Bullish Catapults.

FXmFish[1]-2
Indicator

FXmFish[1]-2

The indicator calculates a smoothed momentum value based on the relative position of price within its high-low range, applying a logarithmic transformation to identify overextended trends and reversal points.

fxnewsbolttun
Indicator

fxnewsbolttun

This indicator identifies significant supply and demand zones by scanning for local fractal highs and lows that surpass previous price structural thresholds.

fxnewsbolttun_v1
Indicator

fxnewsbolttun_v1

This indicator identifies significant local price extremes by detecting structural fracture points where current highs and lows surpass immediate historical boundaries.

Indicator

FXOE-Asctrend

Indicator

FXOE-Combo

Indicator

FXOE-ITrend

iBearsPoweriBandsiBullsPower
Indicator

FXOE-ITrendHisto

Indicator

FXOE-Juice

Indicator

FXOE-LRSI

Indicator

FXOE-SHIChannel

Indicator

FXOE-SHIChannel_v1

Indicator

FXOE-SHISlope

Indicator

FxOverEasy

iSAR
Indicator

FxOverEasy_v1

iSAR
Indicator

FxOverEasy_v2

iSAR
FXprime_V2 Final
Indicator

FXprime_V2 Final

iCCIiADXiMAiRSI

This indicator identifies high-probability trade entries by synchronizing EMA slope intensity with CCI momentum thresholds, RSI strength, and ADX trend directionality.

fxprime_v231
Indicator

fxprime_v231

iCCIiADXiMAiRSI

This indicator identifies high-probability trend entries by synchronizing EMA angular velocity, RSI momentum, and CCI multi-period crossovers with ADX directional strength.

FXRaiderTable_enM
Indicator

FXRaiderTable_enM

iMACDiMA

This indicator synthesizes moving averages, MACD oscillators, and Parabolic SAR across weekly, daily, and hourly intervals to provide a visual matrix of directional momentum alignment for multiple currency pairs simultaneously.

FXSErgoCCITrig[L]
Indicator

FXSErgoCCITrig[L]

iMAOnArray

This indicator identifies trend shifts by calculating the ratio of smoothed momentum variables against their absolute magnitude averages to generate proactive long and short signals.

FXSniperMA_SW
Indicator

FXSniperMA_SW

iMA

This indicator identifies directional momentum shifts by detecting the precise change in slope of various moving average types and projecting visual markers on trend reversals.

FXSnipersErgodic_CCITrigger
Indicator

FXSnipersErgodic_CCITrigger

iMAOnArray

This indicator calculates momentum dynamics by applying nested exponential moving averages to price changes and their absolute values to generate a crossover signal between an Ergodic CCI and a smoothed trigger line.

FXSnipers_ErgodicCCI_SW_Arrow
Indicator

FXSnipers_ErgodicCCI_SW_Arrow

This indicator utilizes an ergodic multi-stage smoothing process to calculate a proprietary CCI derivative, generating alerts when the smoothed momentum value crosses its dynamic trigger line.

Indicator

FXTticksCollector

Indicator

FXTticksCollector_v1

FX_FISH Mod
Indicator

FX_FISH Mod

This indicator calculates a normalized price position within a rolling high-low range, applying a logarithmic transformation to identify extreme momentum shifts and directional exhaustion.

FX_FISH Mod2_v2.1
Indicator

FX_FISH Mod2_v2.1

This indicator calculates a smoothed momentum value based on price positioning relative to local extremes, applying a logarithmic transformation to identify trend reversals and exhaustion zones.

FX_FISH Mod2_v2
Indicator

FX_FISH Mod2_v2

This indicator utilizes a recursive logarithmic transformation of normalized price position relative to recent high-low extremes to identify overextended momentum shifts.

FX_FISH Mod_v1
Indicator

FX_FISH Mod_v1

This indicator utilizes a smoothed logarithmic transformation of normalized price action relative to local highs and lows to identify directional shifts and extreme momentum reversals.

FX_FISH-mod
Indicator

FX_FISH-mod

This indicator utilizes a recursive log-based calculation to transform normalized price range movements into an oscillator that identifies momentum shifts and trend reversals.

FX_FISH-mod_v1
Indicator

FX_FISH-mod_v1

This indicator calculates a smoothed, logarithmic momentum value based on the relative position of price within its local high-low range to identify overextended trend exhaustion points.

FX_FISH-mod_v2
Indicator

FX_FISH-mod_v2

The indicator calculates a smoothed relative position of price within a high-low range, then applies a logarithmic transformation to determine momentum direction and volatility extremes.

FX_FISH
Indicator

FX_FISH

This indicator calculates a smoothed logarithmic transformation of price normalized against its recent high-low range to identify overextended momentum reversals.

FX_Fisher_Yurik
Indicator

FX_Fisher_Yurik

The indicator calculates a smoothed momentum value based on price range extremes and applies a logarithmic transformation to identify trend reversals.

FX_FISH_2MA
Indicator

FX_FISH_2MA

iMAOnArray

This indicator calculates a smoothed momentum value by applying a logarithmic transformation to a price-relative position within a dynamic range, identifying trend reversals and exhaustion points through dual moving average overlays.

FX_FISH_2MA_v1
Indicator

FX_FISH_2MA_v1

iMAOnArray

This indicator utilizes a recursive smoothed value based on price position relative to local extremes, transformed through a logarithmic function to identify directional momentum shifts and trend exhaustion.

FX_FISH_2MA_v2
Indicator

FX_FISH_2MA_v2

iMAOnArray

This indicator calculates a smoothed logarithmic momentum value based on price relative to local extremes, utilizing recursive smoothing and multi-period moving averages to identify trend reversals.

FX_FISH_v1
Indicator

FX_FISH_v1

This indicator utilizes a recursive smoothing algorithm and logarithmic scaling to identify high-velocity price reversals relative to dynamic historical volatility ranges.

FX_FISH_v2
Indicator

FX_FISH_v2

This indicator utilizes a normalized price range calculation combined with logarithmic smoothing to identify extreme momentum shifts and potential trend exhaustion points.

FX_Sniper's_Ergodic_CCI
Indicator

FX_Sniper's_Ergodic_CCI

iCCIiMAOnArray

This indicator synthesizes smoothed price velocity and absolute momentum fluctuations to calculate a proprietary volatility-adjusted CCI derivative.