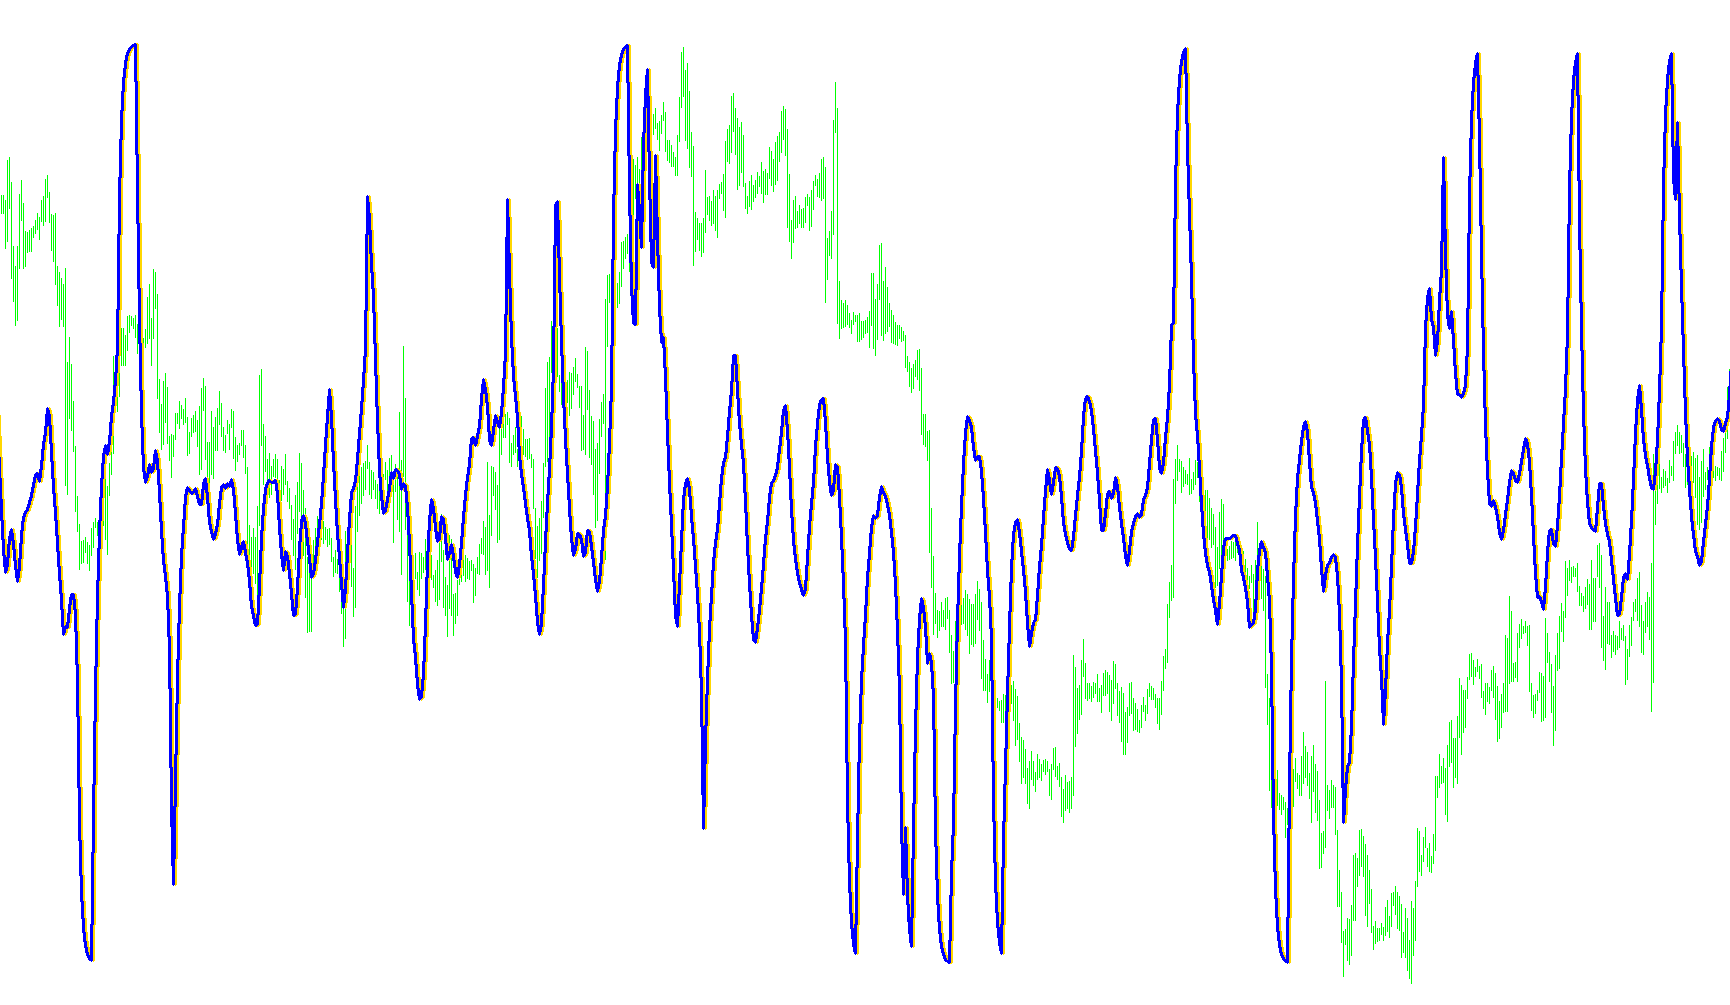
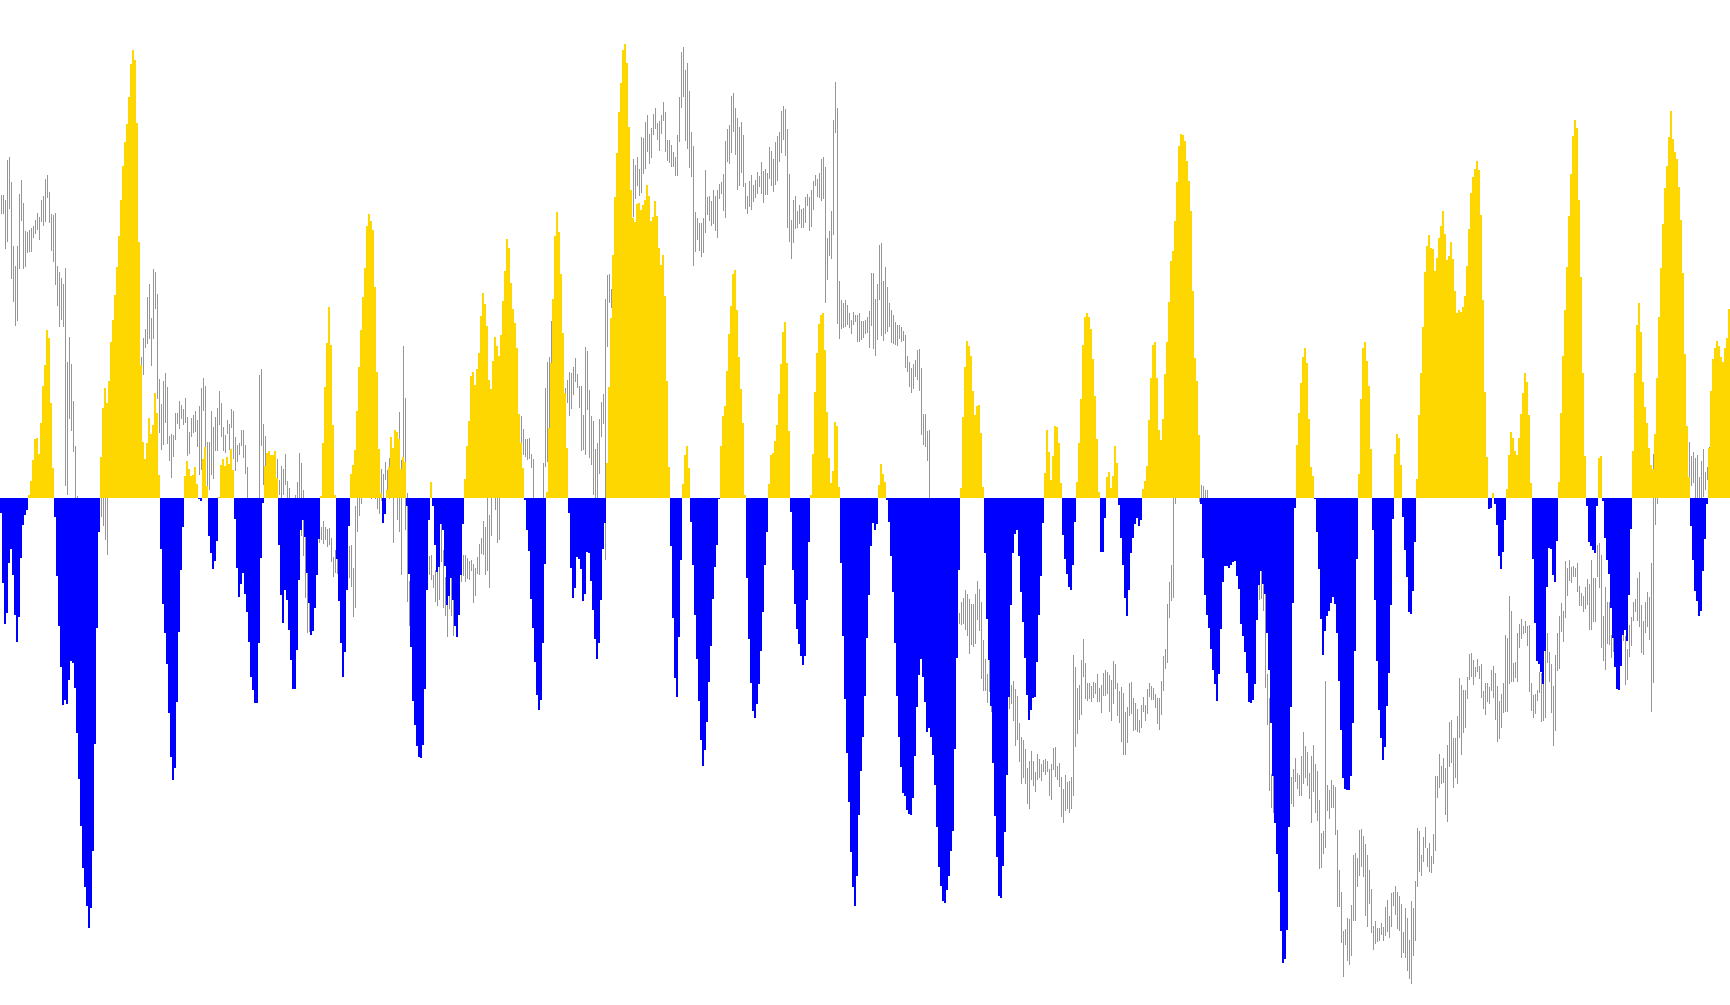
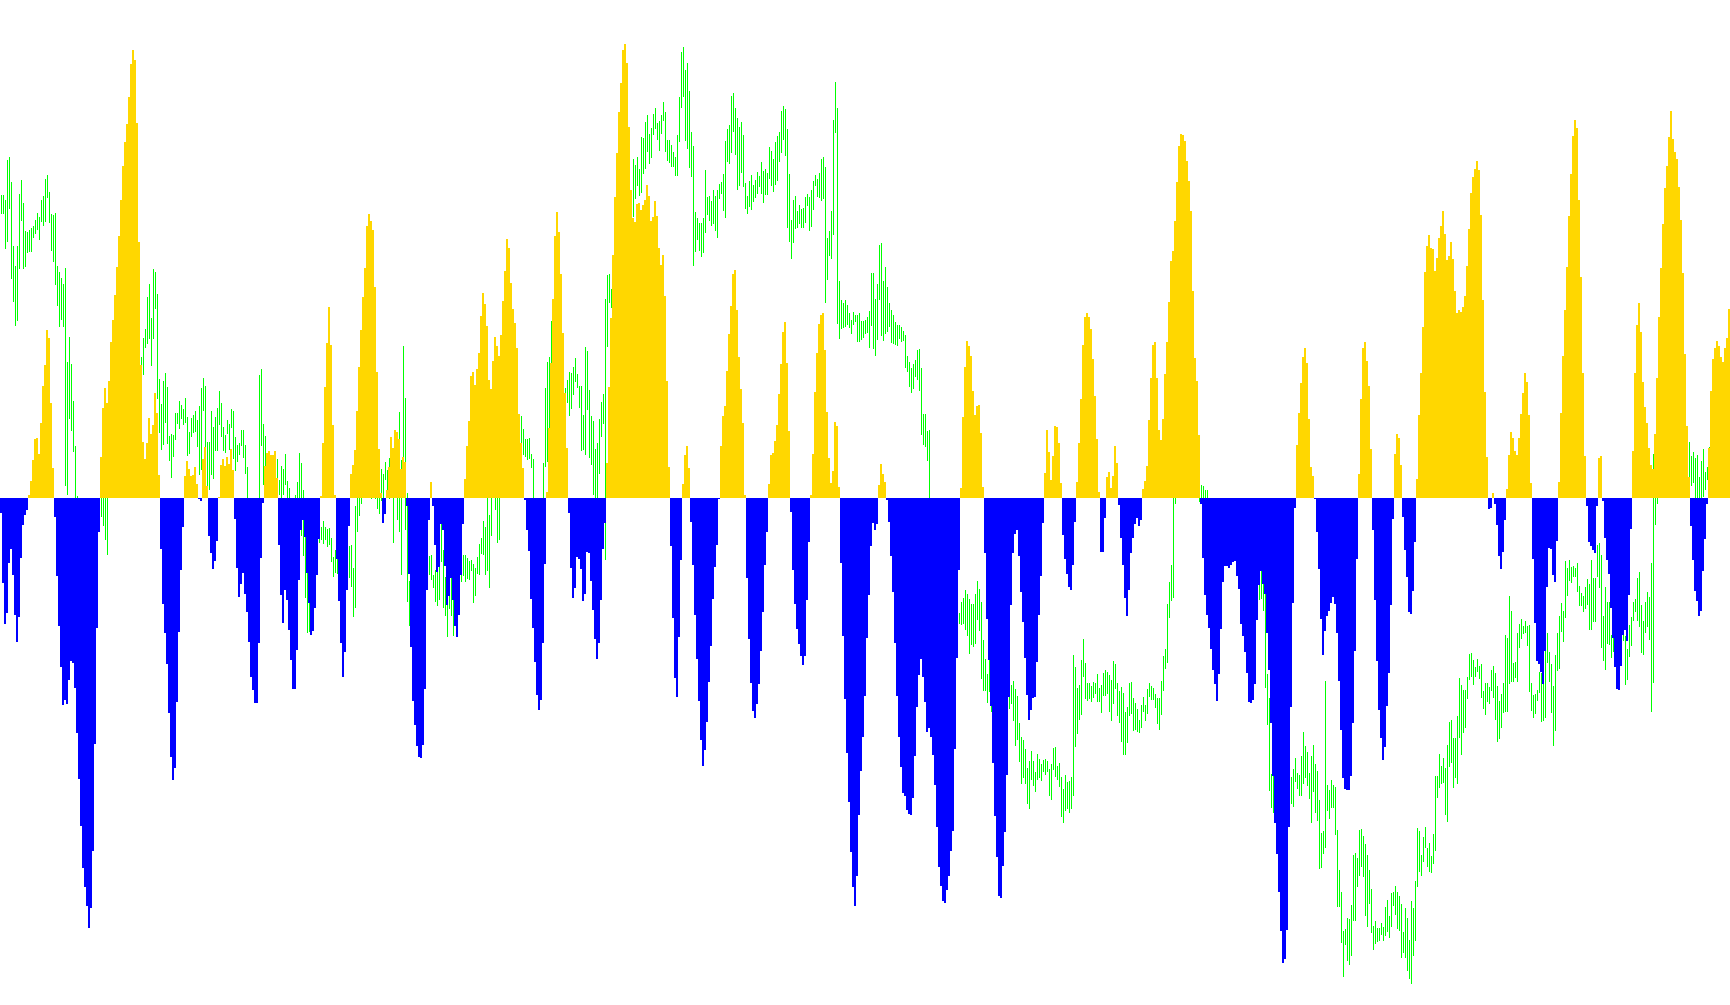
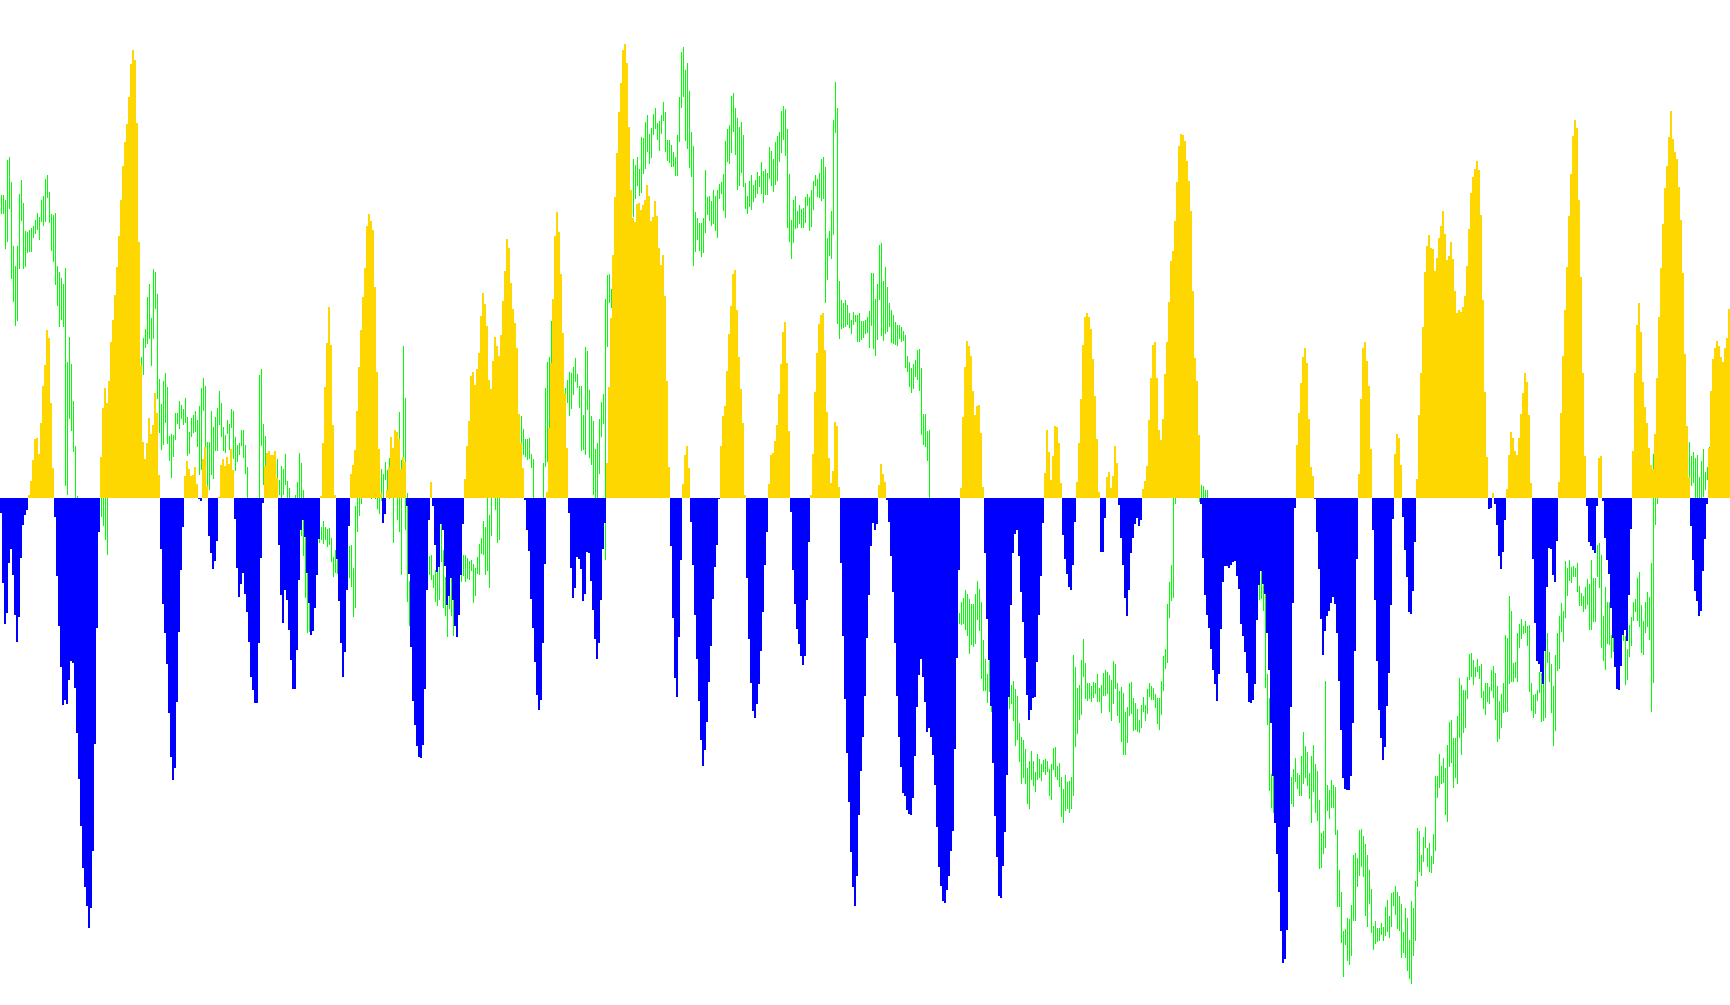
Fisher_org_v12_v2
Indicator

Fisher_org_v12_v2

iMA

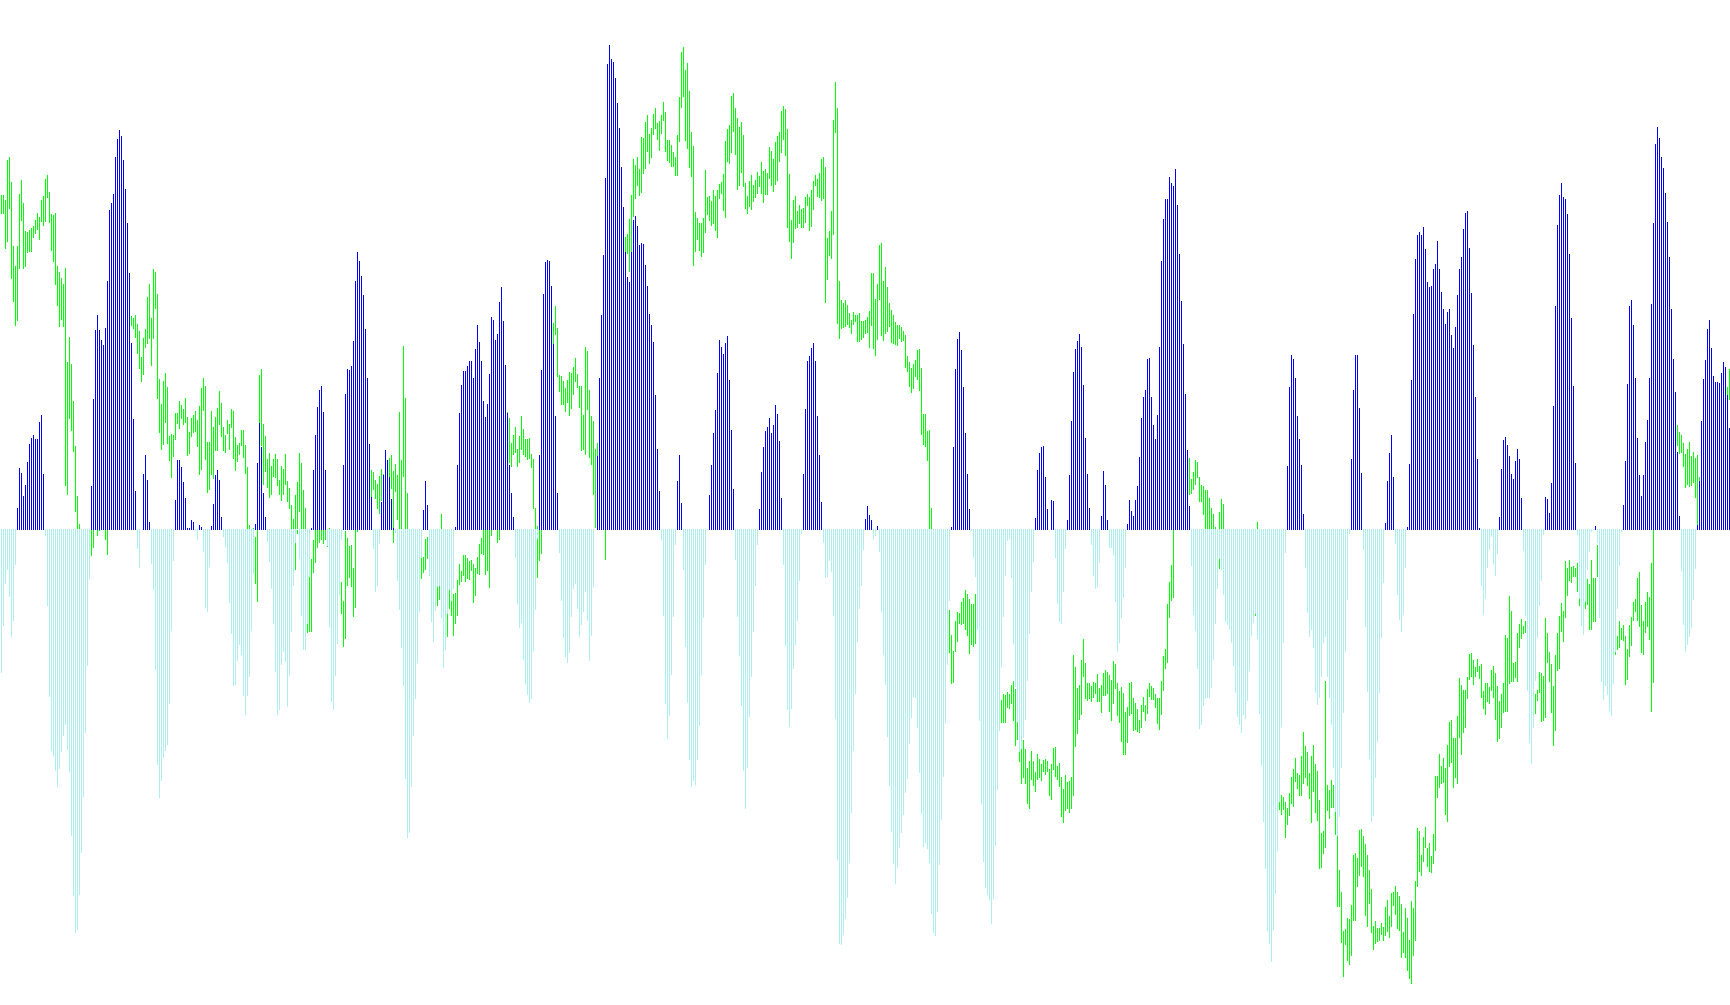
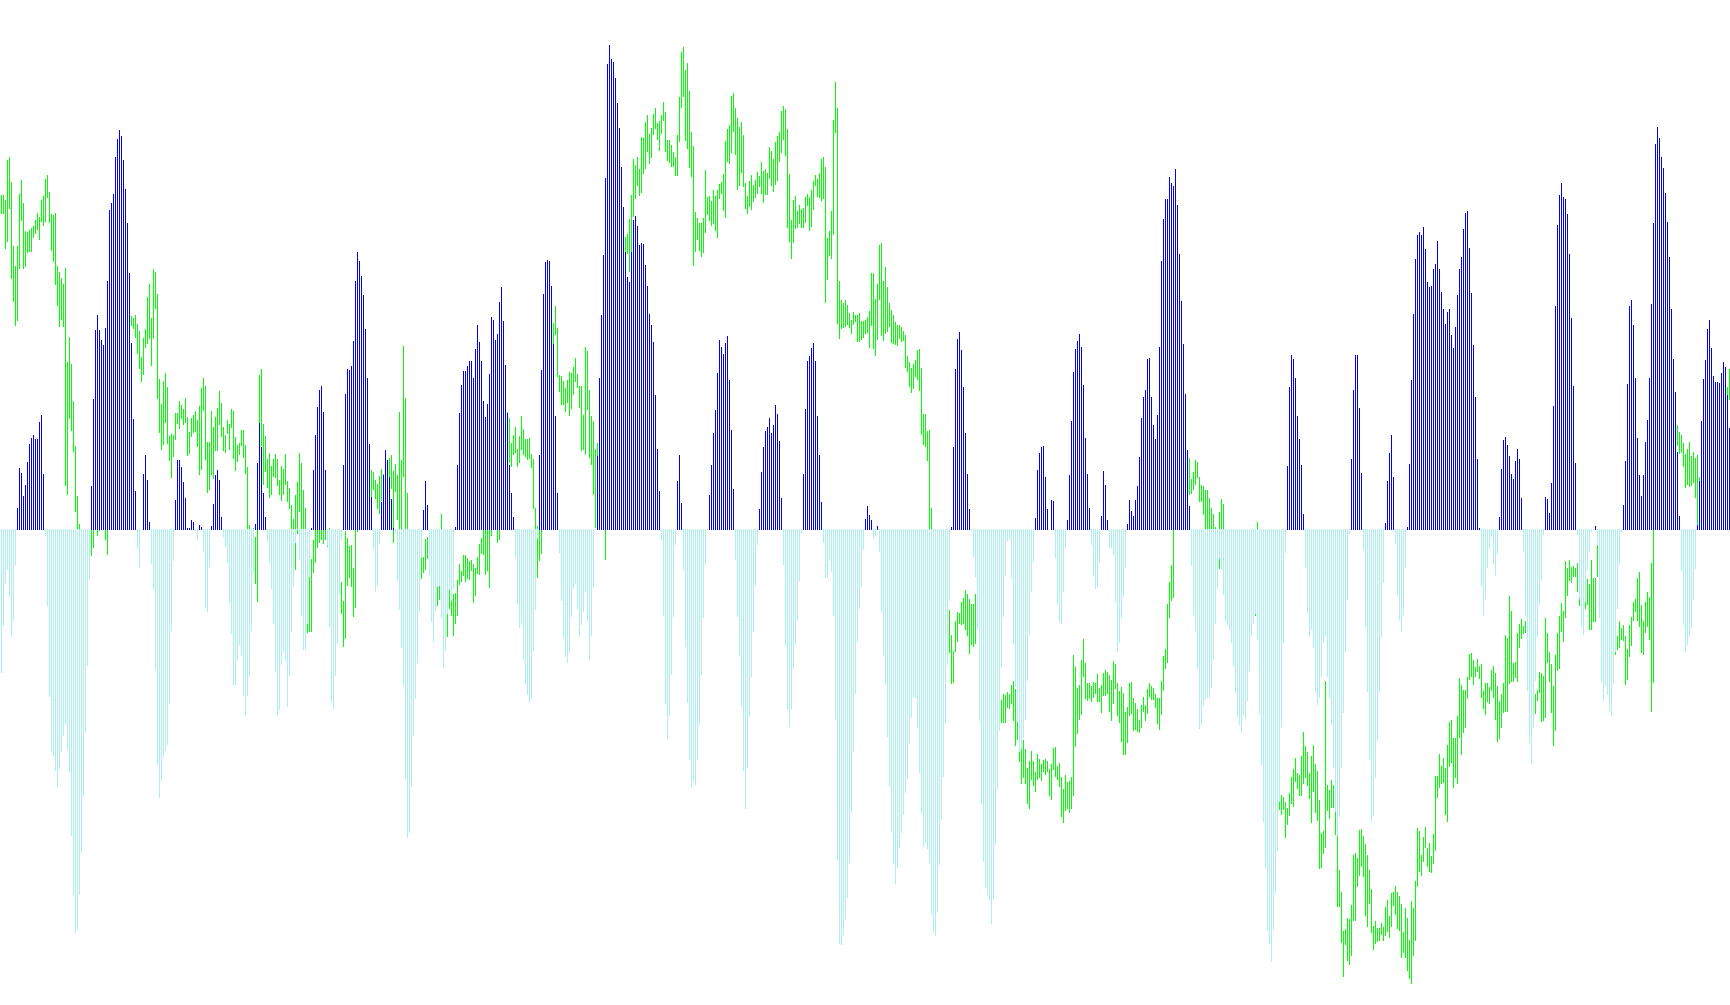
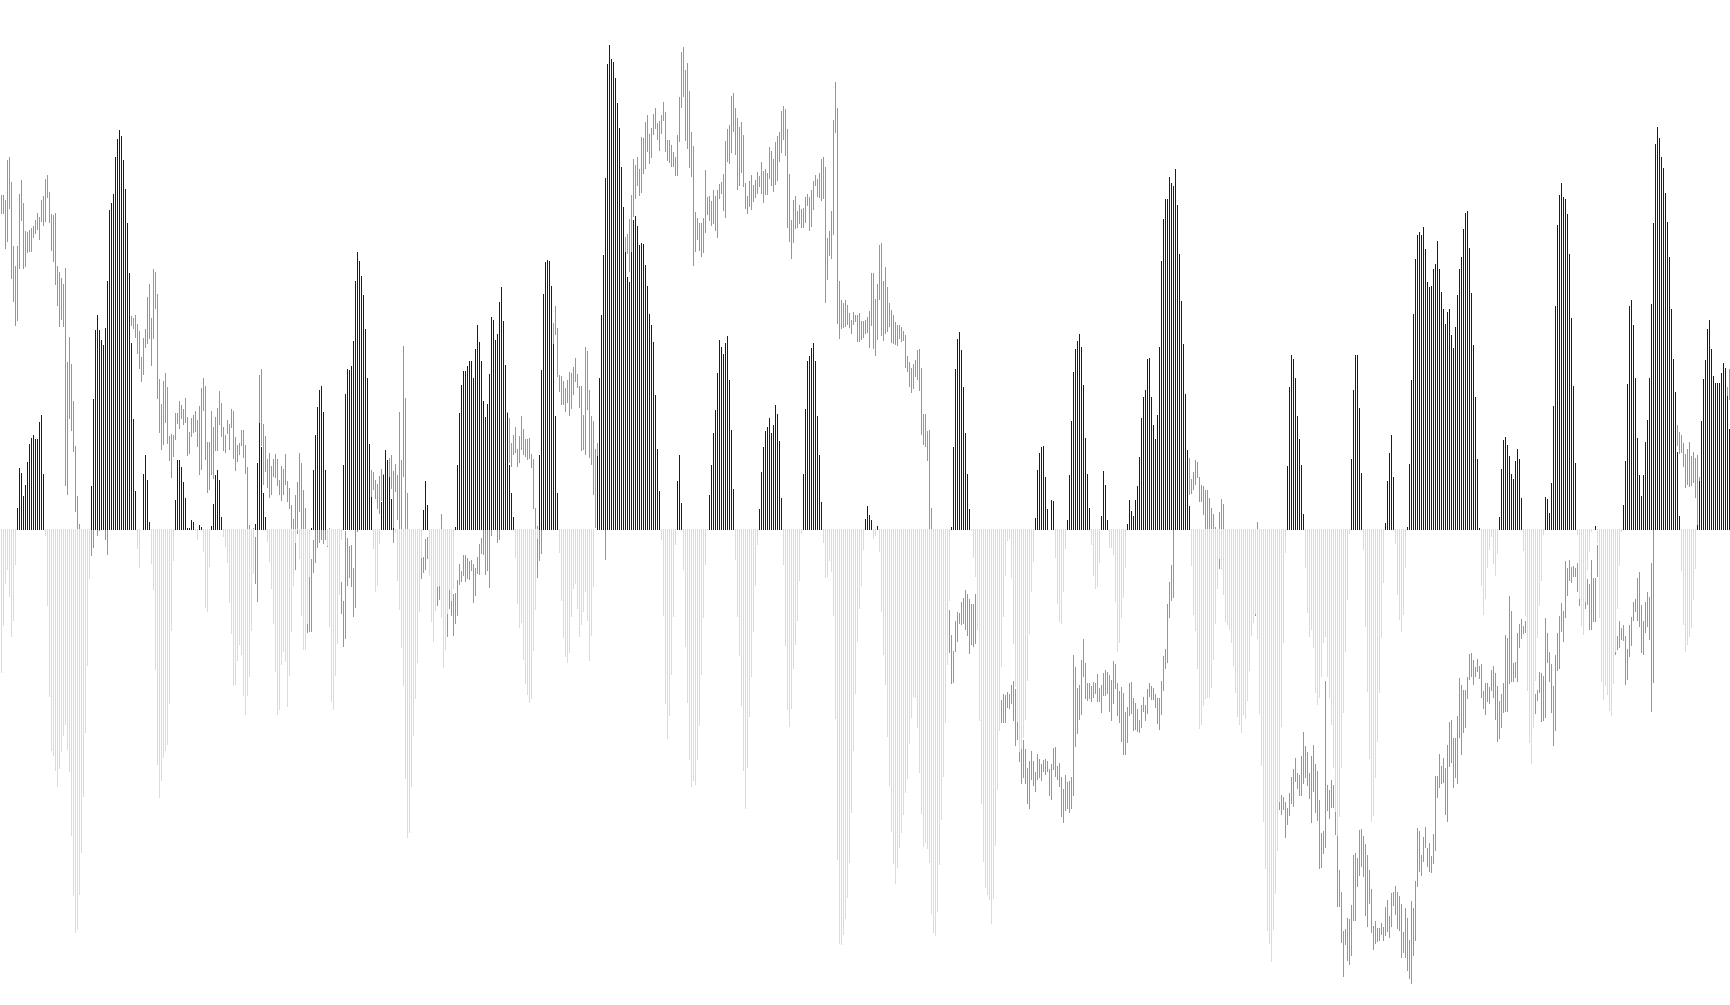
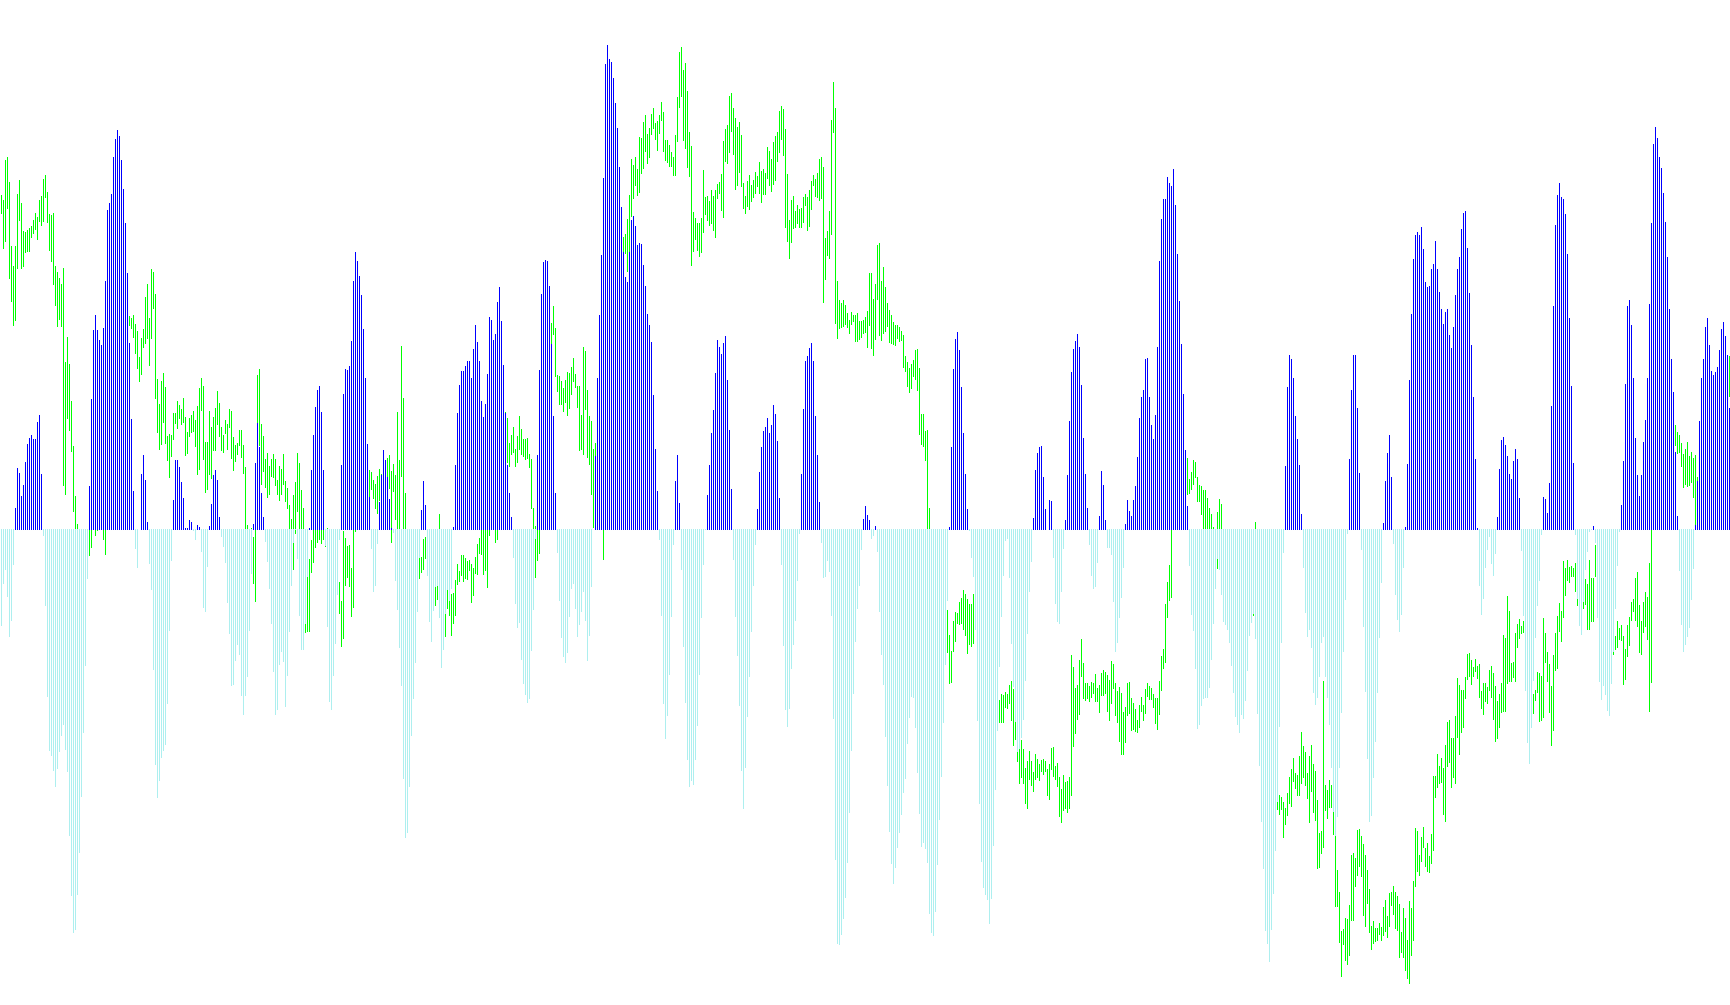
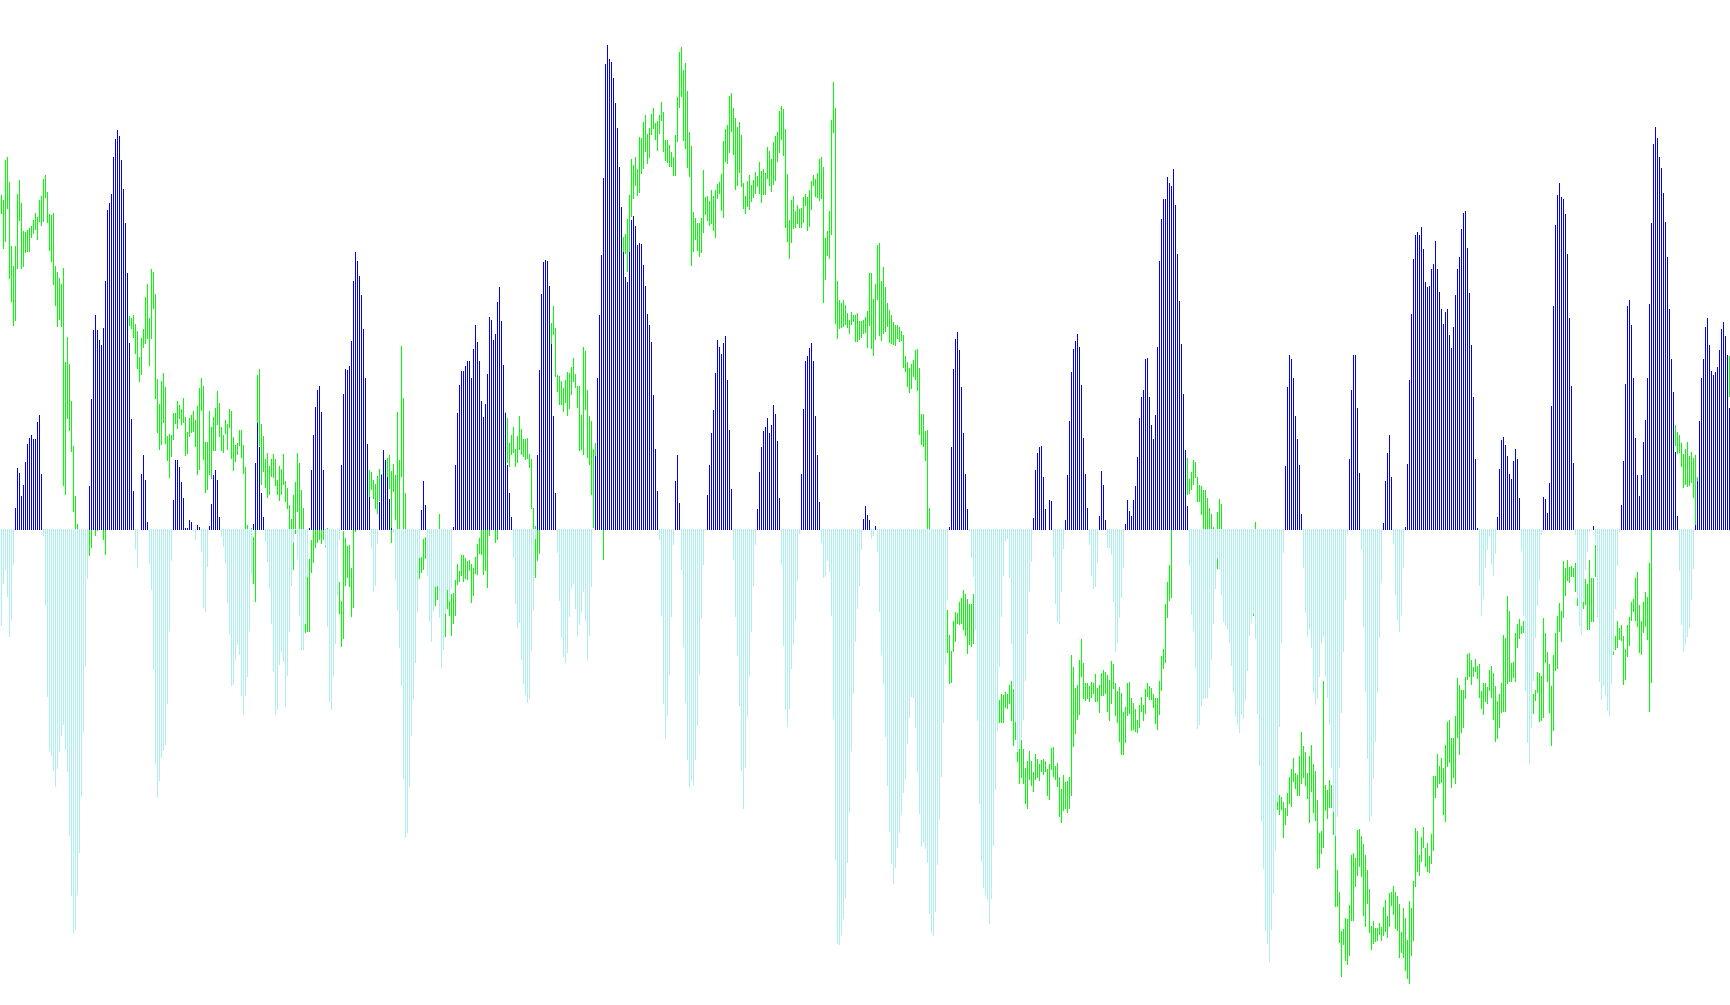
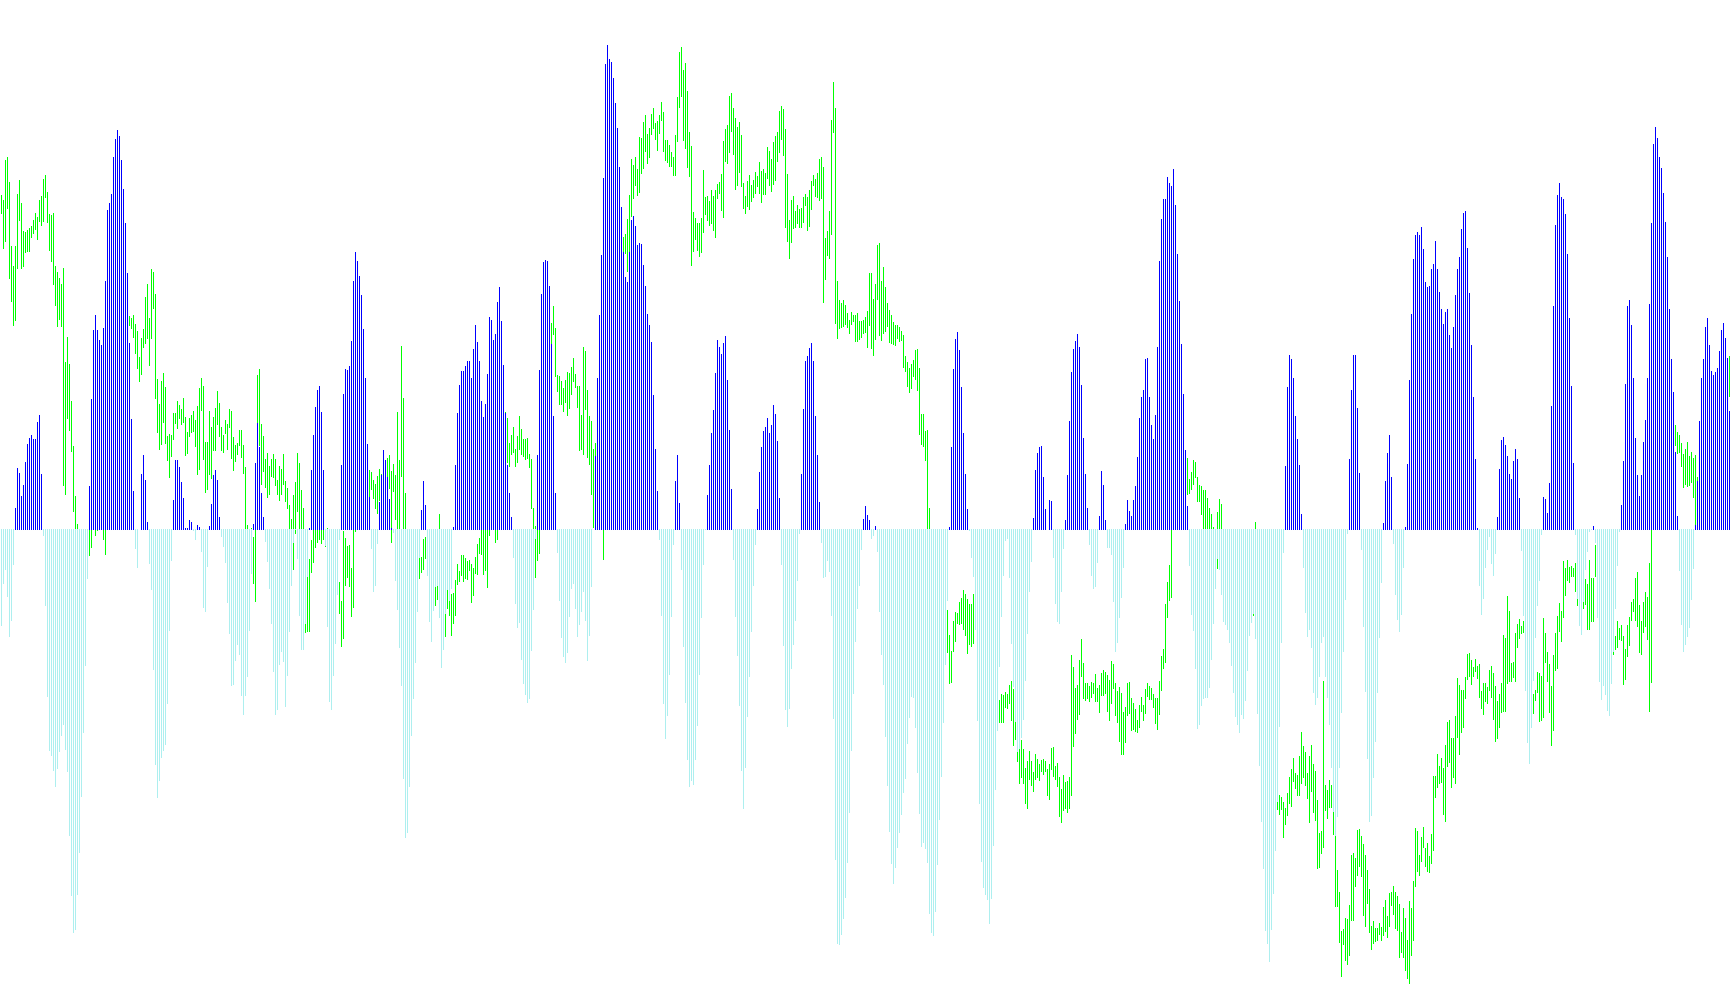
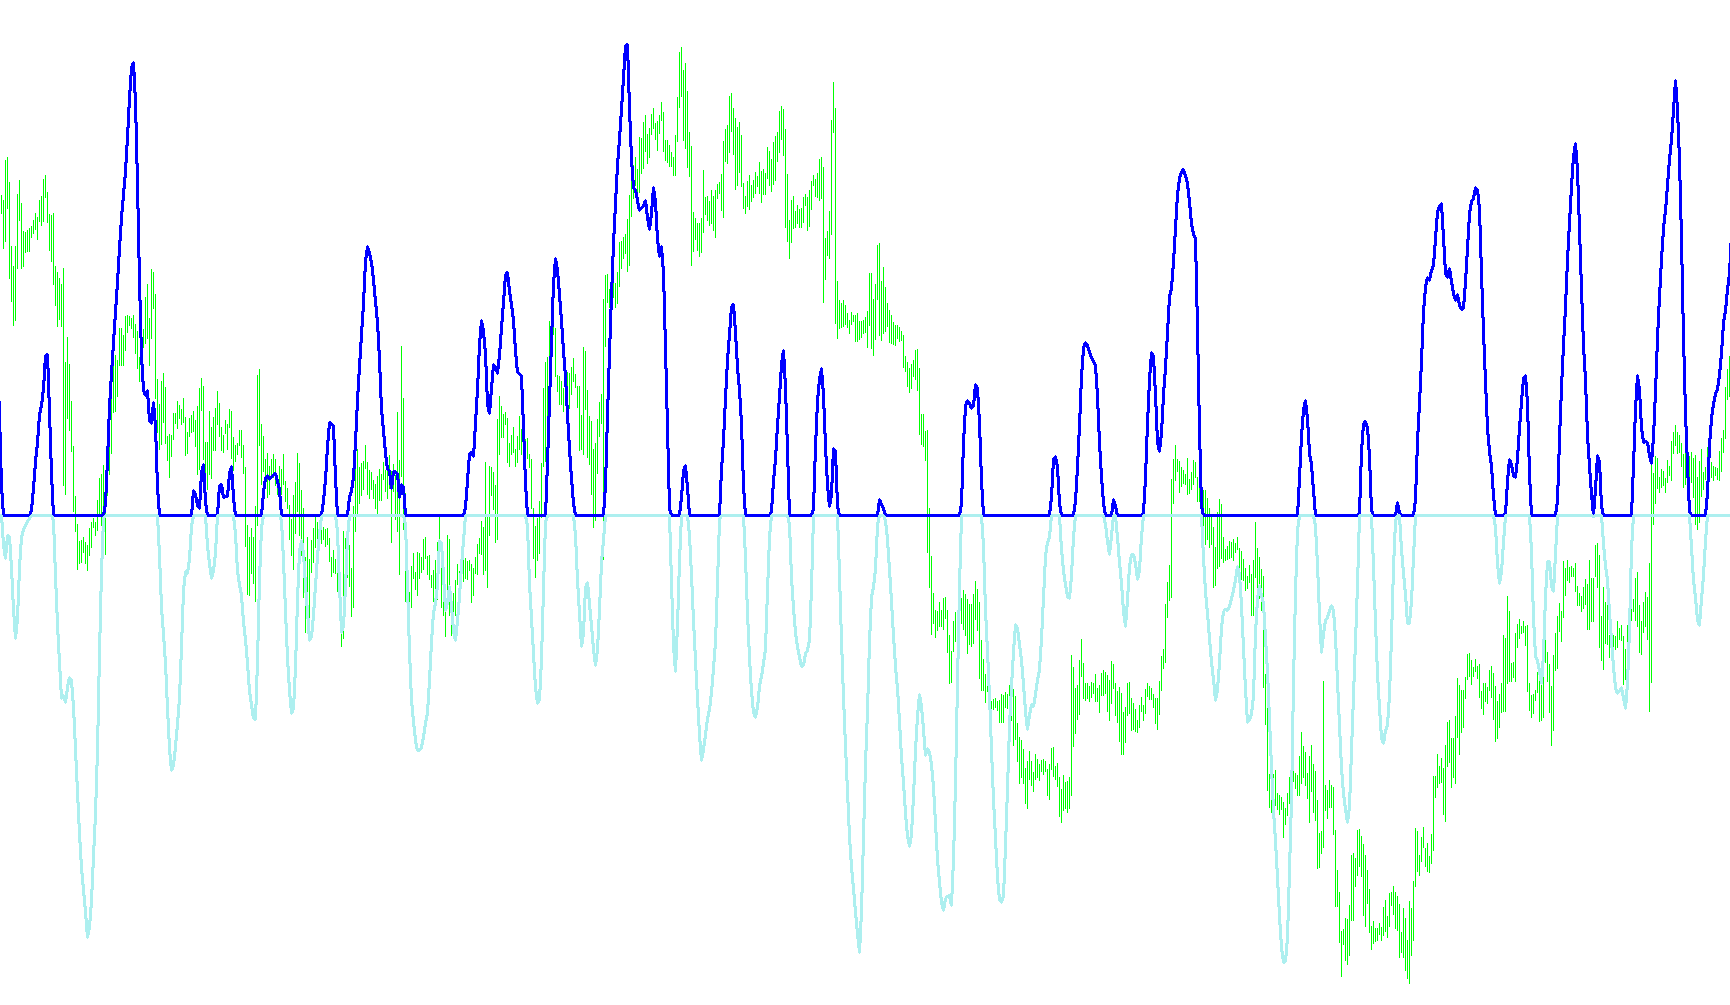
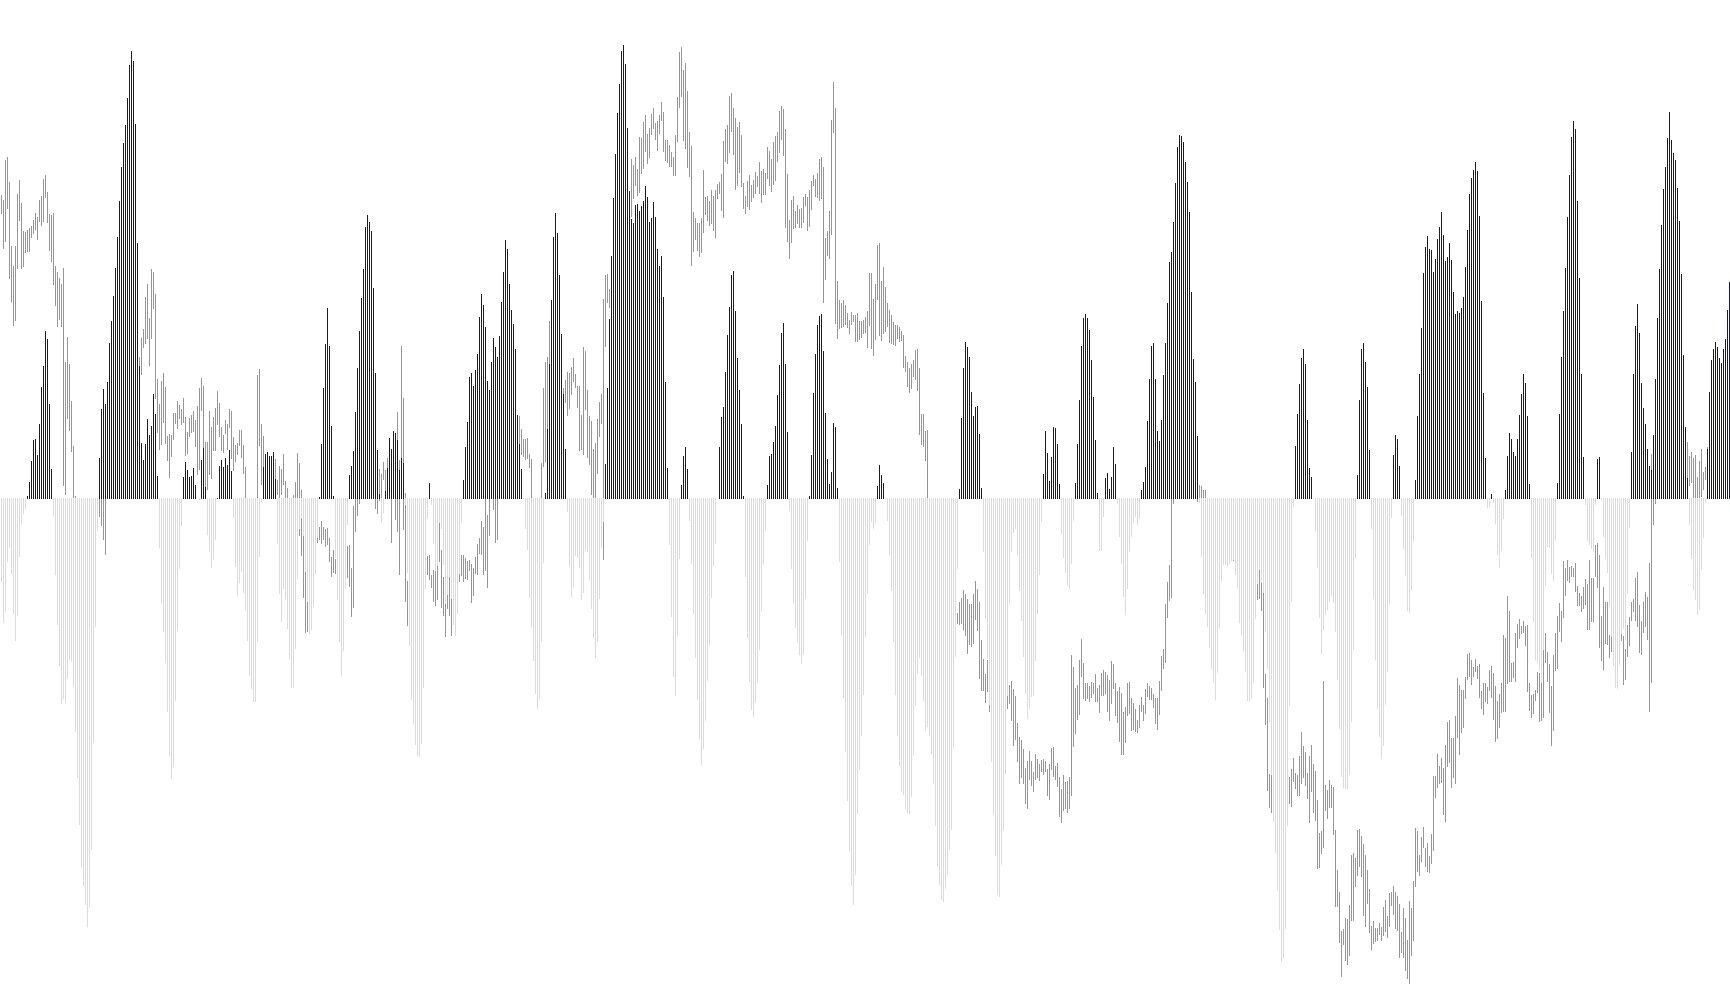
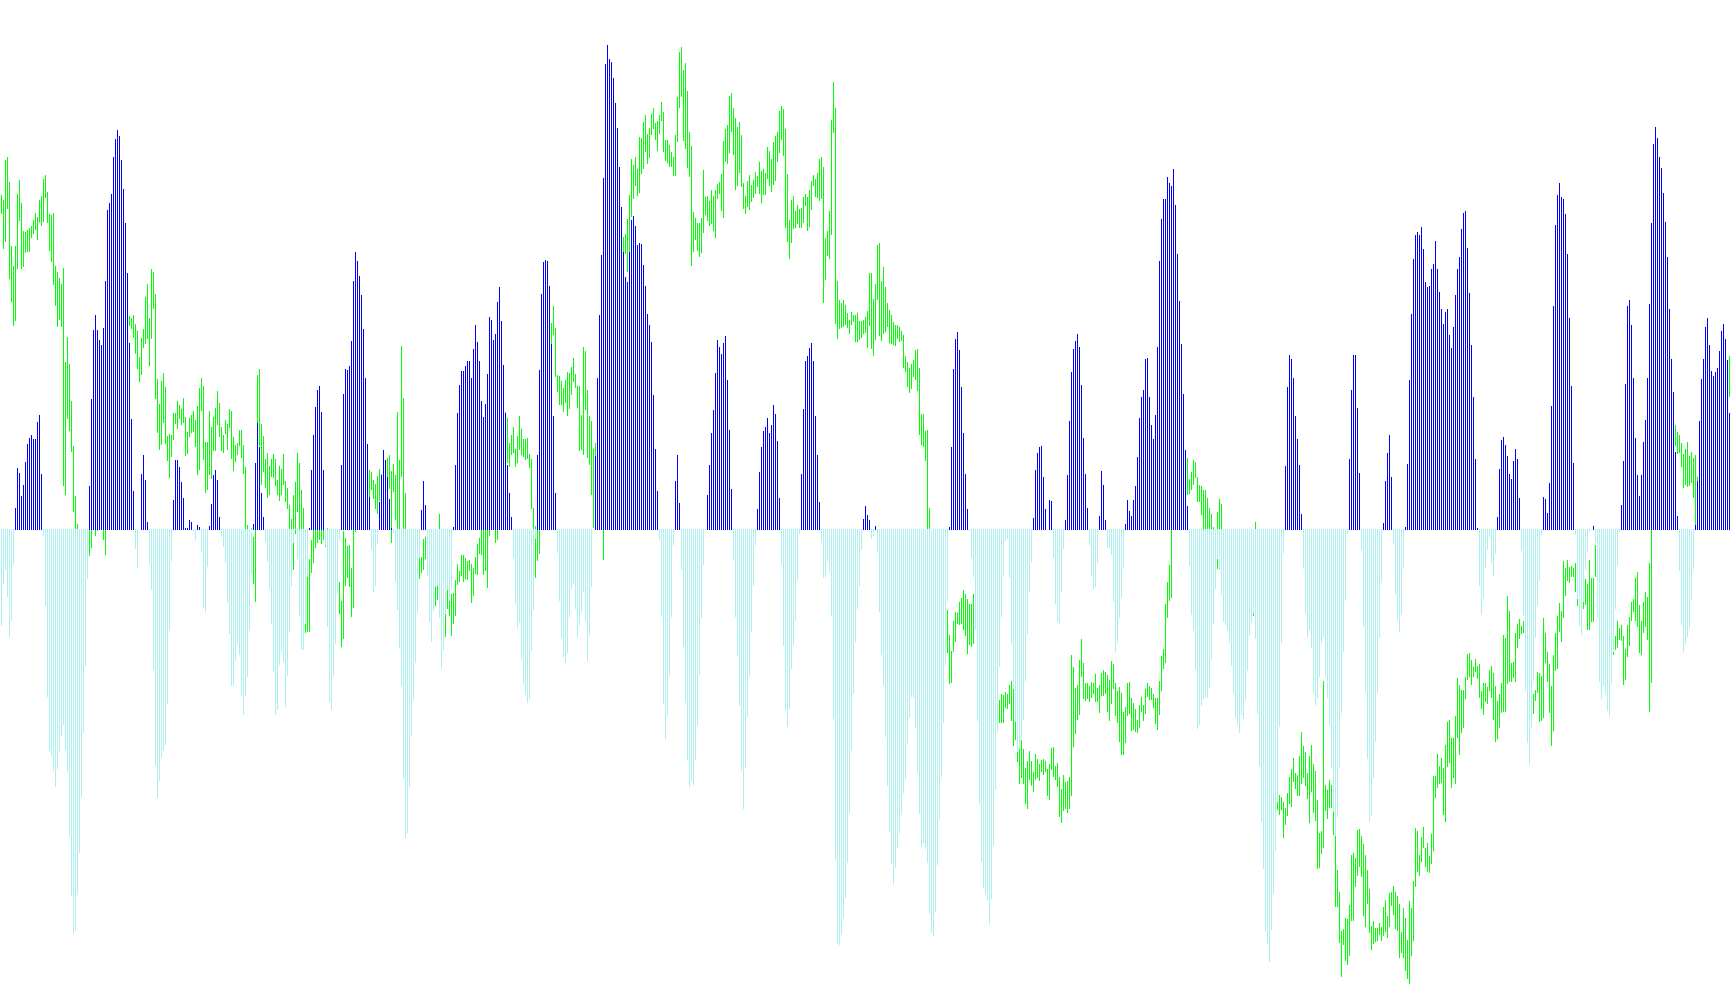
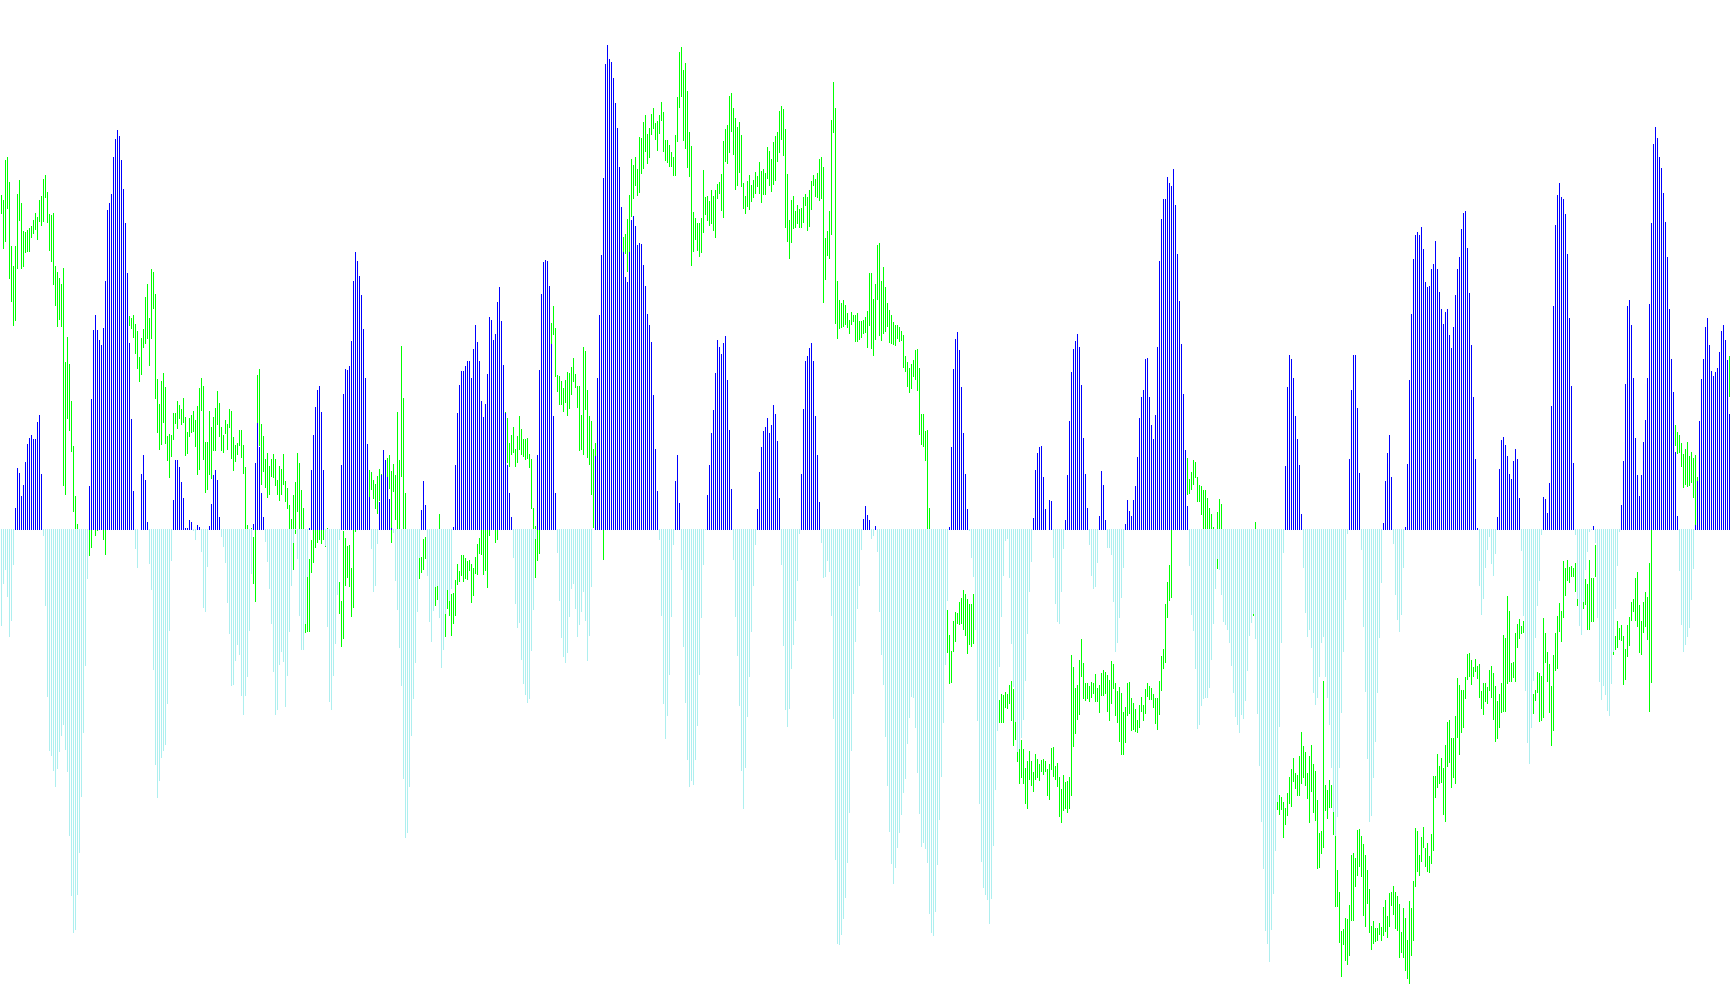
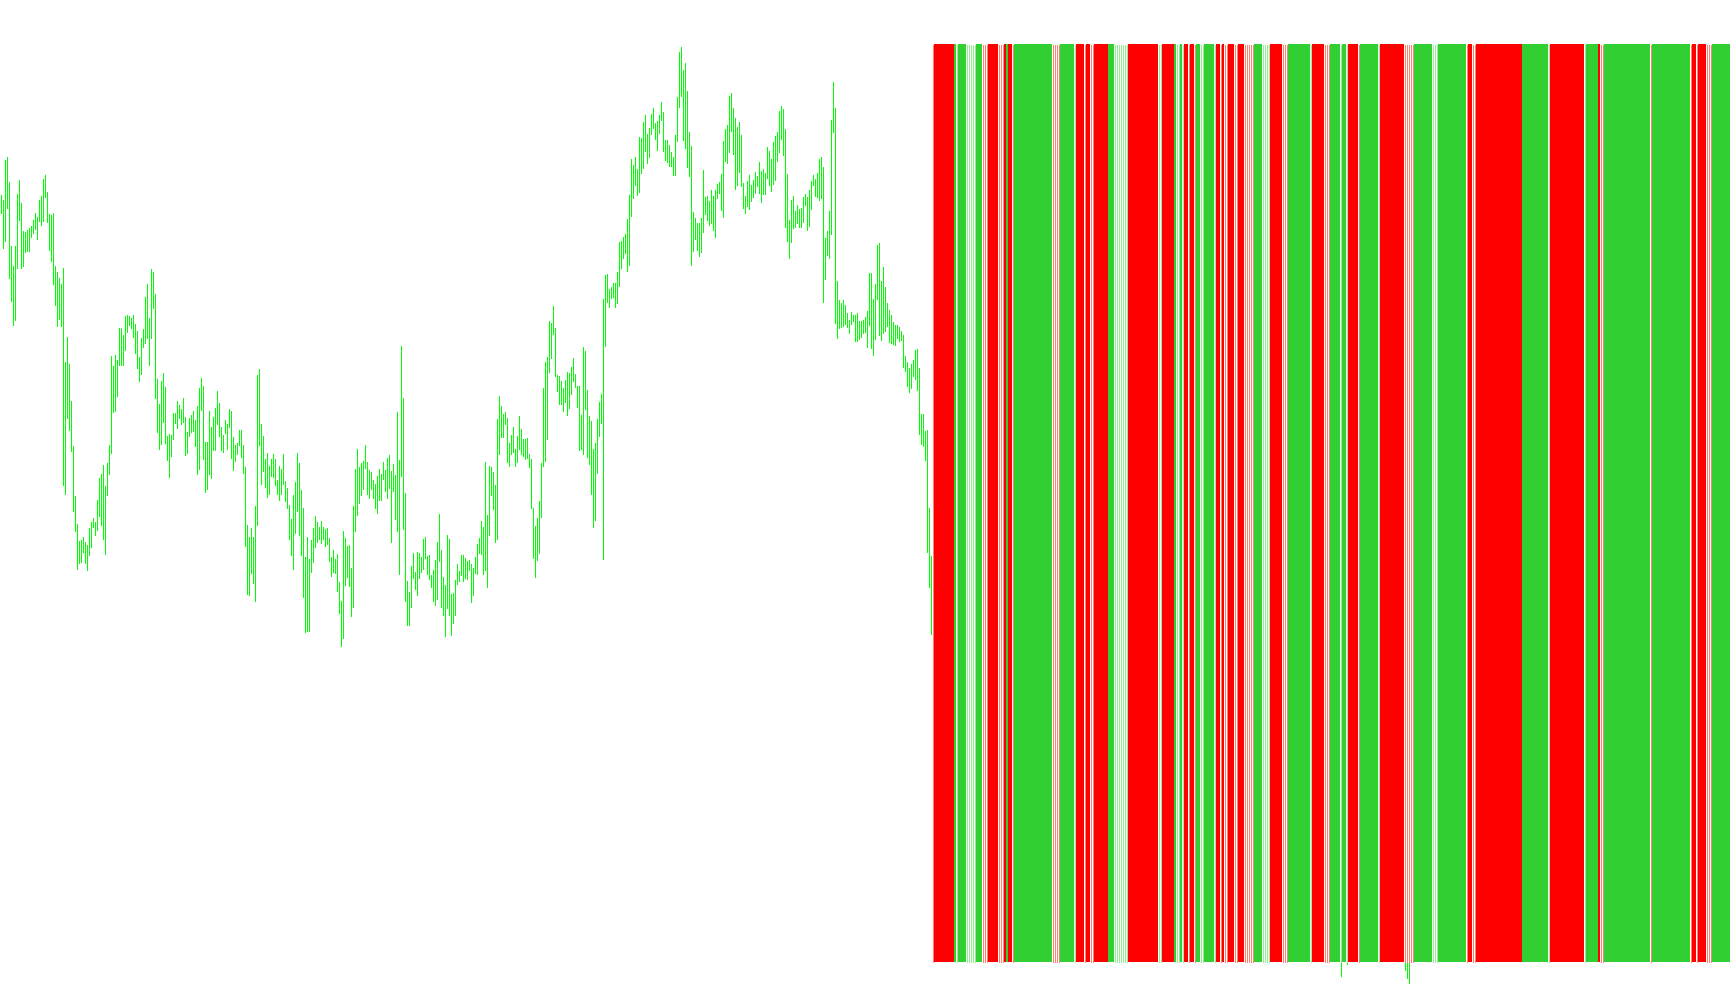
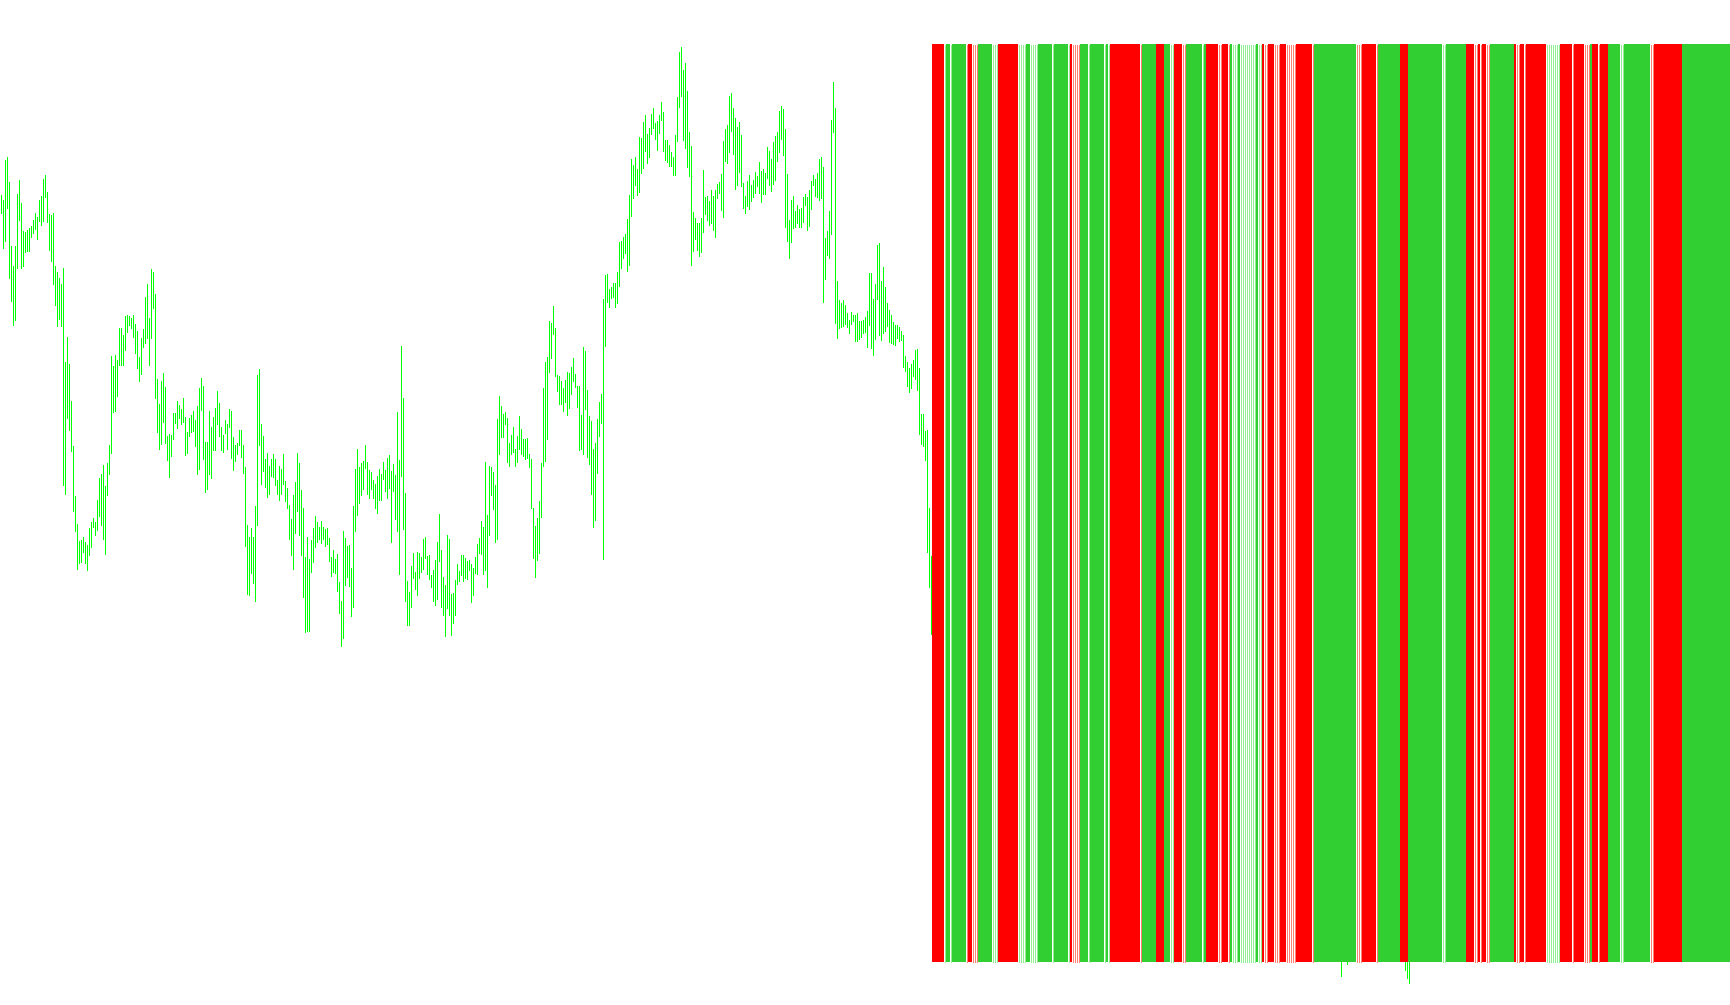
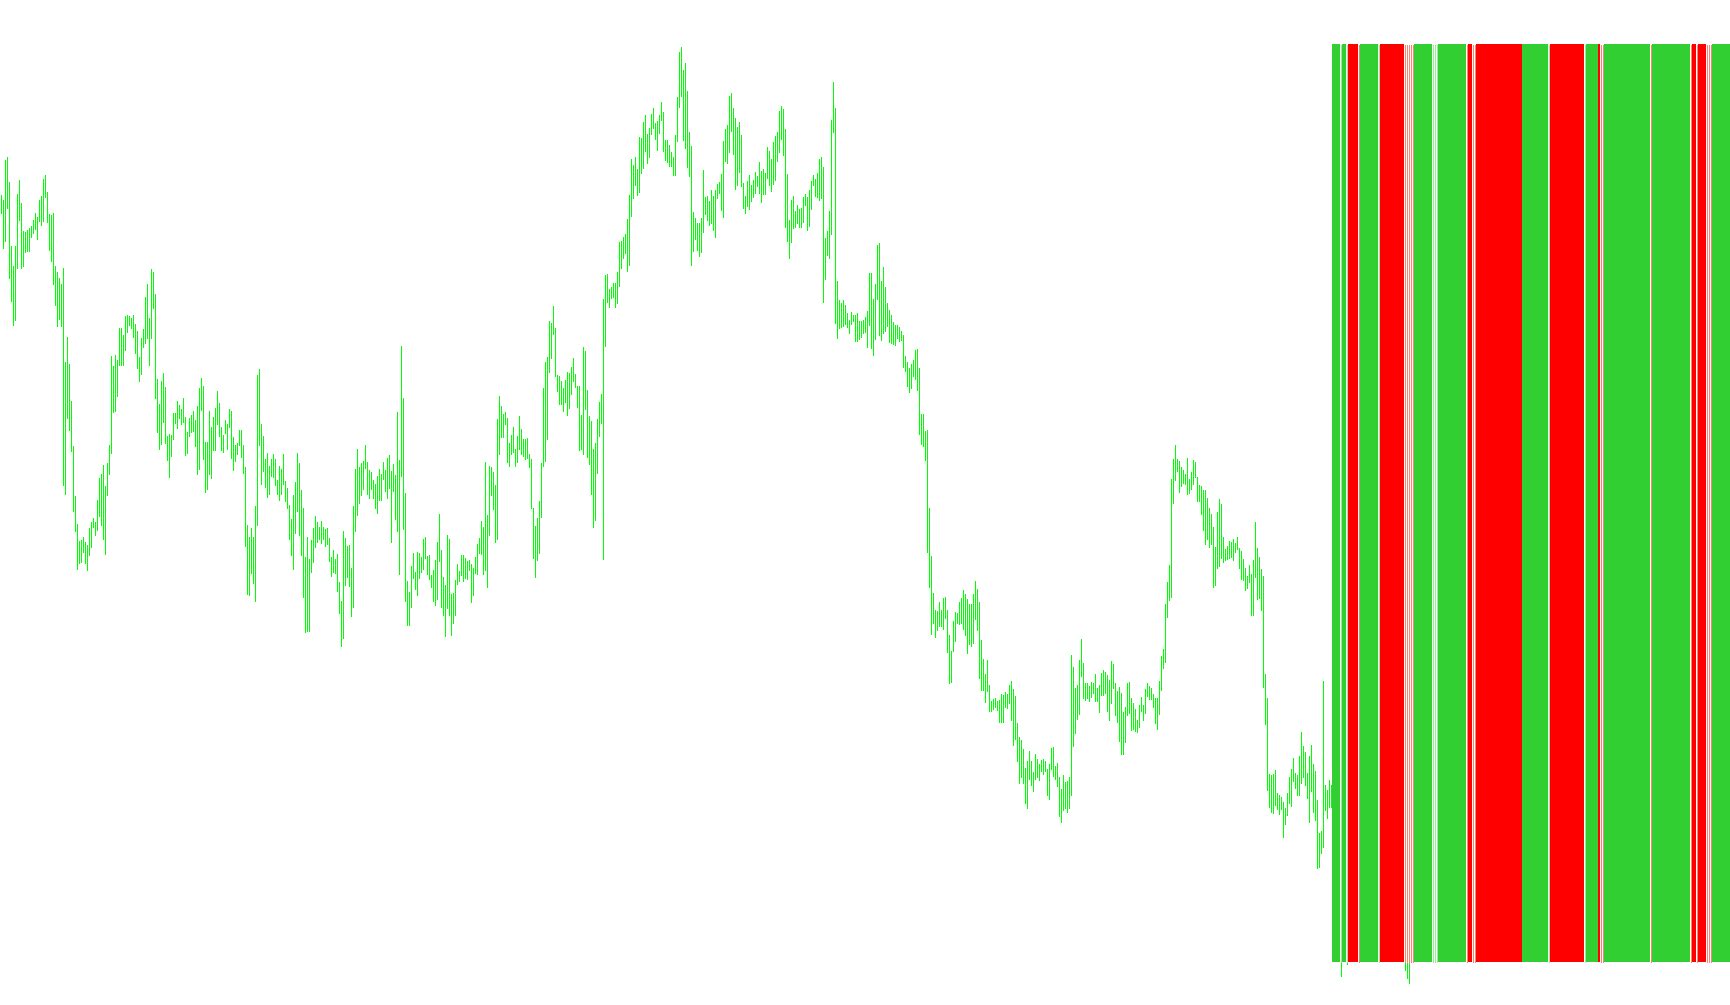
This indicator transforms price action into a non-linear momentum scale by applying a hyperbolic tangent transformation to normalized relative high-low ranges.

Fisher_org_v12_v3
Indicator

Fisher_org_v12_v3

iMA

This indicator utilizes a weighted price-to-range ratio transformed via hyperbolic tangent logic to identify overextended market momentum and potential trend exhaustion.

Fisher_v1
Indicator

Fisher_v1

iMA

This indicator utilizes a recursive smoothing algorithm and logarithmic transformation of price range positioning to identify momentum shifts and trend reversals.

Fisher_v1_001
Indicator

Fisher_v1_001

iMA

This indicator calculates a smoothed price position relative to a high-low range, transforming it into a logarithmic momentum scale to identify directional trend shifts.

Fisher_v1_002
Indicator

Fisher_v1_002

iMA

This indicator calculates a logarithmic momentum value by normalizing price action relative to historical extremes and applying a smoothed recursive weighting formula.

Fisher_Yur4ik-1
Indicator

Fisher_Yur4ik-1

This indicator utilizes a logarithmic transformation of price action variance relative to local highs and lows to identify momentum shifts and trend polarity.

Fisher_Yur4ik
Indicator

Fisher_Yur4ik

This indicator calculates a smoothed logarithmic transformation of price extremes relative to the high-low range to identify momentum shifts and polarity reversals.

Indicator

Fisher_Yur4ikk

Indicator

Fisher_Yur4ikk_v1

Fisher_Yur4ik_2
Indicator

Fisher_Yur4ik_2

The indicator utilizes a recursive smoothing algorithm on price range relative positions to calculate a logarithmic transformation of momentum shifts.

Fisher_Yur4ik_2_v1
Indicator

Fisher_Yur4ik_2_v1

This indicator transforms price action into a logarithmic momentum scale by calculating the relative position of the median price within a dynamic high-low range.

Fisher_Yur4ik_Alert
Indicator

Fisher_Yur4ik_Alert

This indicator calculates a smoothed price range normalization using a weighted moving average and applies a logarithmic transformation to identify momentum shifts and zero-line crossovers.

Fisher_Yur4ik_Alert_v2
Indicator

Fisher_Yur4ik_Alert_v2

This indicator calculates price momentum by applying a logarithmic transformation to smoothed relative price ranges, identifying directional shifts through zero-line crossovers.

Fisher_Yur4ik_Correct
Indicator

Fisher_Yur4ik_Correct

This indicator calculates a smoothed relative price position using a weighted moving average and transforms the result into a logarithmic scale to identify momentum shifts and zero-line crossovers.

Fisher_Yur4ik_Correct_One
Indicator

Fisher_Yur4ik_Correct_One

This indicator calculates price momentum by applying a logarithmic transformation to normalized high-low price ranges and smoothing the results to identify directional shifts.

Fisher_Yur4ik_Correct_v1
Indicator

Fisher_Yur4ik_Correct_v1

This indicator calculates a smoothed price velocity by applying a logarithmic transformation to a normalized range-based value, highlighting momentum shifts through histogram color transitions.

Fisher_Yur4ik_v1
Indicator

Fisher_Yur4ik_v1

This indicator transforms price action into a momentum value using logarithmic scaling and smoothing to identify trend reversals based on zero-line crossovers.

Fisher_Yur4ik_v2
Indicator

Fisher_Yur4ik_v2

This indicator calculates price velocity by applying a logarithmic transformation to a smoothed relative range, identifying trend transitions via histogram polarity shifts.

FISHER~1 (2)
Indicator

FISHER~1 (2)

This indicator calculates a smoothed price location relative to the extreme range and applies a logarithmic transformation to identify momentum shifts across zero-line thresholds.

FiveStep-T06R
Indicator

FiveStep-T06R

This indicator identifies trend reversal points by correlating ZigZag structural pivots with consecutive five-bar price action momentum sequences.

Five_MA_Crossover_Email_Alert
Indicator

Five_MA_Crossover_Email_Alert

iMA

This indicator identifies bullish or bearish momentum by detecting when the current price concurrently breaches five distinct moving average layers, including Linear Weighted and LSMA variants.

Five_MA_Crossover_Email_Alert_v1
Indicator

Five_MA_Crossover_Email_Alert_v1

iMA

This indicator identifies bullish or bearish momentum by detecting when price action simultaneously breaches five distinct moving average boundaries, providing real-time visual arrows and multi-channel notifications.

FiyatKesisme
Indicator

FiyatKesisme

iMA

This indicator synthesizes relative price momentum across major currency pairs by calculating the variance between fast and slow moving averages for various base and quote currencies.

Flat Trend MOM
Indicator

Flat Trend MOM

iMomentum

This indicator filters market sentiment by visualizing directional shifts based on whether the momentum value breaches a fixed 100-point baseline.

Flat Trend RSI
Indicator

Flat Trend RSI

iRSI

This indicator identifies directional bias by isolating RSI values above 70 or below 30 and validating the trend against a secondary threshold of 40 to 60.

Flat Trend RSI_v1
Indicator

Flat Trend RSI_v1

iRSI

This indicator identifies directional bias by monitoring RSI extremes and validates trade zones based on specific price momentum thresholds.

Flat Trend
Indicator

Flat Trend

iADXiSAR

This indicator identifies bullish and bearish trend shifts by intersecting Parabolic SAR price levels with directional ADX strength transitions.

Flat Trend_v1
Indicator

Flat Trend_v1

iADXiSAR

This indicator identifies trend shifts by synchronizing Parabolic SAR price crossovers with ADX directional strength momentum.

Flat
Indicator

Flat

iStdDev

This indicator calculates a normalized percentage based on the standard deviation of price movements relative to local high and low volatility extremes.

FLATTRAND_w_MACD_mtf
Indicator

FLATTRAND_w_MACD_mtf

iMACD

This indicator highlights periods of potential flat or ranging markets by analyzing MACD signal line crossovers and main MACD values against zero on a specified timeframe, indicating consolidation when neither bullish nor bearish signals are present.

FlatTrend Alert
Indicator

FlatTrend Alert

iMACD

This indicator identifies trend exhaustion and consolidation zones by detecting specific crossovers between the MACD main and signal lines relative to their zero-axis positioning.
FlatTrend SMC modified
Indicator

FlatTrend SMC modified

iADXiMAiSAR

This indicator synthesizes multi-layer moving average stacking, Parabolic SAR price deviations, and ADX directional shifts to identify structural equilibrium and trend exhaustion.

FlatTrend SMC modified_v1
Indicator

FlatTrend SMC modified_v1

iADXiMAiSAR

This indicator identifies market equilibrium by synchronizing multi-period moving average alignment with Parabolic SAR reversals and ADX trend strength divergence.

FlatTrend V2
Indicator

FlatTrend V2

iADXiSAR

This indicator synthesizes Parabolic SAR price positioning with multi-period ADX directional shifts to visualize trend momentum and potential structural reversals.

FlatTrend V21
Indicator

FlatTrend V21

iADXiSAR

This indicator identifies market trend reversals and momentum shifts by correlating Parabolic SAR price crossovers with ADX directional strength dynamics.

FlatTrend V21_v1
Indicator

FlatTrend V21_v1

iADXiSAR

This indicator identifies trend shifts by synthesizing Parabolic SAR price crossovers with ADX momentum velocity gradients across multi-timeframe periods.

FlatTrend V2_v1
Indicator

FlatTrend V2_v1

iADXiSAR

This indicator identifies trend polarity by correlating Parabolic SAR price positioning with the directional divergence of ADX values across multi-timeframe periods.

FlatTrend V2_v2
Indicator

FlatTrend V2_v2

iADXiSAR

This indicator identifies directional bias by correlating Parabolic Sar position relative to price against the expanding and contracting gradients of the Average Directional Index.

FlatTrend V2_v3
Indicator

FlatTrend V2_v3

iADXiSAR

This indicator identifies trend reversals and momentum shifts by intersecting Parabolic SAR price levels with dual ADX directional strength comparisons.

FlatTrend V3
Indicator

FlatTrend V3

iADX

This indicator synthesizes price action volatility through a normalized Fisher Transform and filters it against ADX directionality to identify high-probability trend shifts.

FlatTrend V3_v1
Indicator

FlatTrend V3_v1

iADX

This indicator synthesizes price range normalization with log-transformed momentum smoothing and multi-timeframe ADX directional shifts to identify trend exhaustion and reversal points.

FlatTrend w MACD
Indicator

FlatTrend w MACD

iMACD

This indicator identifies directional momentum shifts by detecting bullish and bearish crossovers relative to the zero line, while highlighting periods of price consolidation.

FlatTrend w MACD_v1
Indicator

FlatTrend w MACD_v1

iMACD

This indicator identifies bullish momentum, bearish exhaustion, and market neutrality by evaluating the relationship between MACD main and signal lines across specific timeframes.

FlatTrend w MACD_v2
Indicator

FlatTrend w MACD_v2

iMACD

This indicator identifies high-probability momentum shifts by monitoring specific crossover conditions between the MACD Main and Signal lines across multi-timeframe periods.

FlatTrend
Indicator

FlatTrend

iADXiSAR

Identifies trend shifts by correlating Parabolic SAR reversals with dual-period ADX momentum fluctuations to detect price breakouts and consolidation states.

FlatTrend1
Indicator

FlatTrend1

iADXiSAR

This indicator identifies bullish and bearish market regimes by filtering Parabolic SAR price crossovers through a minimum ADX threshold of 20 and sequential trend momentum shifts.

FlatTrend1_v1
Indicator

FlatTrend1_v1

iADXiSAR

This indicator synthesizes Parabolic SAR price crossovers with ADX directional strength and trend intensity filters to visualize active market momentum.

FlatTrend_SMC_modified
Indicator

FlatTrend_SMC_modified

iADXiMAiSAR

The logic identifies bearish pressure via Parabolic SAR and ADX divergence while simultaneously validating bullish alignment through multi-period Moving Average stacking.

FlatTrend_SMC_modified_v1
Indicator

FlatTrend_SMC_modified_v1

iADXiMAiSAR

Identifies structural market dynamics by synthesizing moving average ordering, Parabolic SAR price crossovers, and ADX directional momentum.

FlatTrend_v1
Indicator

FlatTrend_v1

iADXiSAR

This indicator identifies bullish and bearish trend shifts by correlating Parabolic SAR price breaches with ADX momentum directional changes to highlight active market movements.