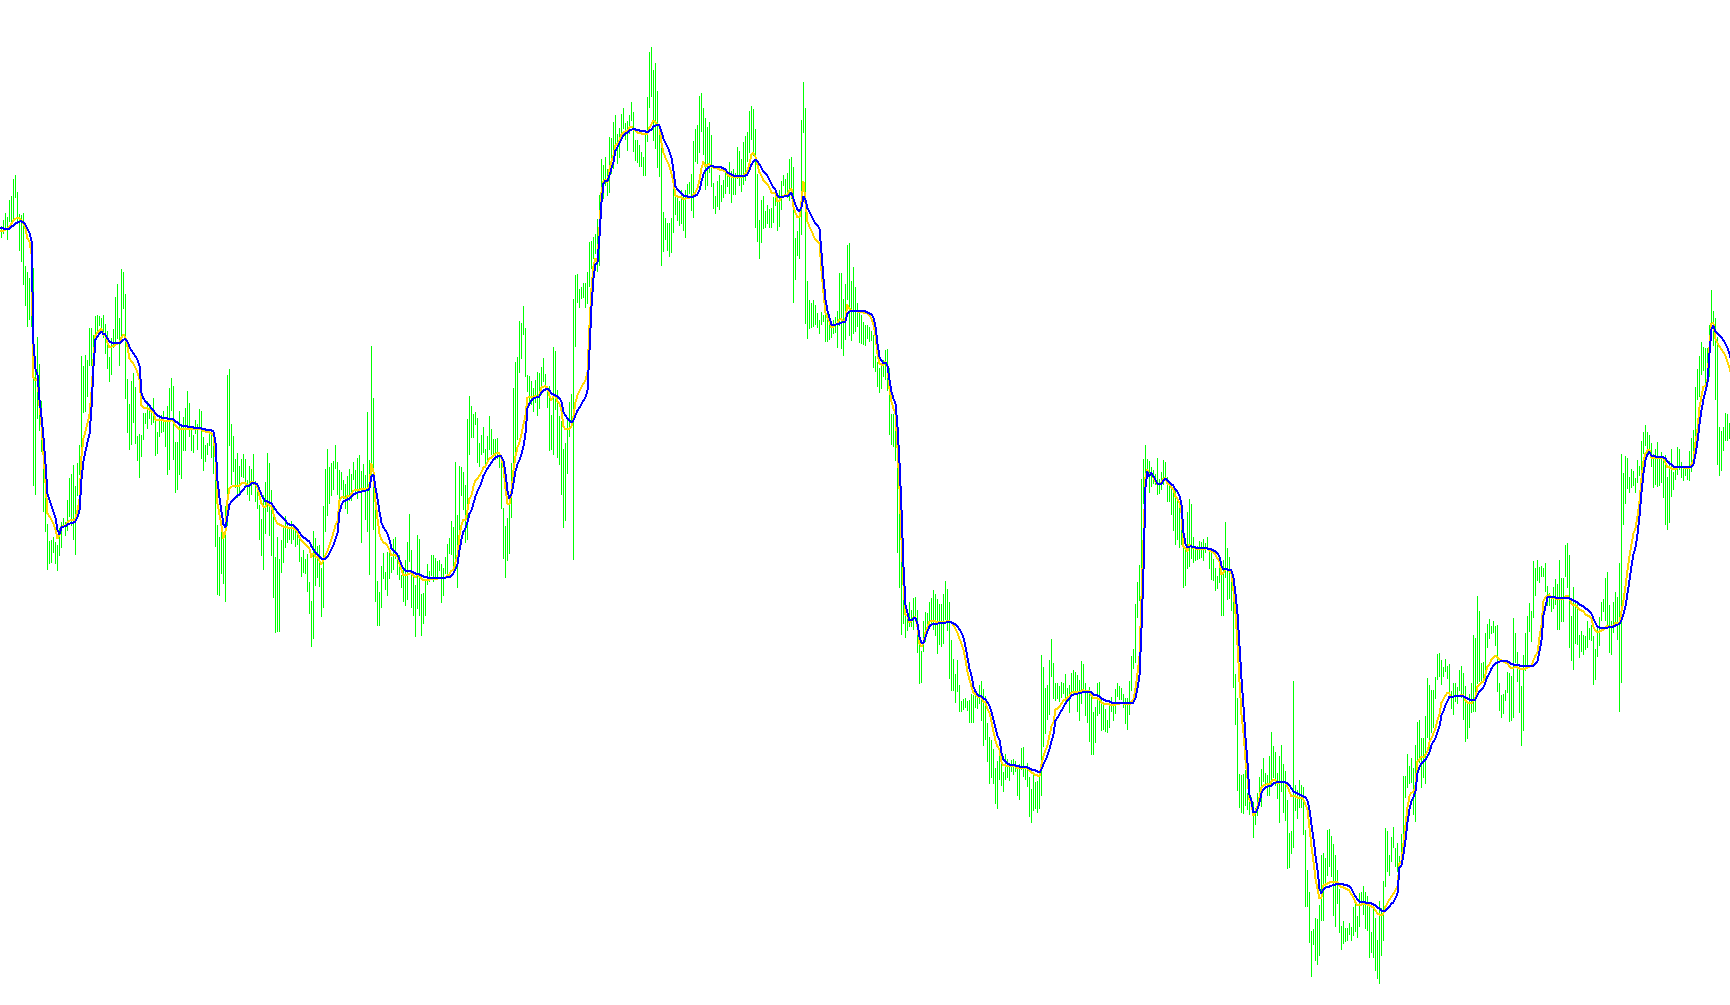
This indicator, known as the Fractal Adaptive Moving Average (FRAMA), is designed to provide a more responsive and intelligent way to track price trends on a trading chart. Unlike standard moving averages that apply a constant weight to past prices, this tool adapts its behavior based on the "fractal dimension" of the market—essentially measuring how erratic or smooth the current price movement is.
How the Logic Works
The core functionality of this script relies on identifying the complexity of market noise to determine how quickly the indicator should react:
- Market Complexity Analysis: The tool continuously calculates a "dimension estimate." This looks at the range of price highs and lows over specific time periods. It compares short-term fluctuations against longer-term movements to distinguish between trending markets (which are smoother) and choppy, sideways markets (which are more jagged).
- Dynamic Adaptation: Based on that complexity score, the script calculates two different smoothing factors (alphas).
- In a trending market, the indicator becomes "faster," allowing it to hug the price closely so traders can capture movements early.
- In a choppy or noisy market, the indicator becomes "slower" and smoother, which helps filter out false signals and prevents the user from getting caught in "whipsaws."
- Dual-Line Output: The script produces two distinct visual lines on your chart:
- The Fractal Adaptive Moving Average (FRAMA): This is the primary adaptive line that follows the price trends with varying sensitivity.
- The Signal Line: A secondary, smoother version of the FRAMA. By using a separate multiplier for this signal, it creates a buffer that helps traders identify potential trend shifts or momentum changes by watching the interaction between the two lines.
Key Features for Traders
- Auto-Adjustment: The script automatically ensures that the calculation periods are even numbers to maintain mathematical consistency.
- Stability Safeguards: To prevent the indicator from becoming too erratic during extreme market conditions, there are built-in limits on how fast or slow the adaptation can become. This ensures the lines remain readable and reliable.
- Visual Clarity: The tool provides two clearly differentiated lines (typically Red and Blue) to help you visualize both the immediate adaptive trend and the broader underlying momentum simultaneously.
Miscellaneous
11
Views
0
Downloads
0
Favorites
FractalAMA_MBK
/*-----------------------------+
|			       |
| Shared by www.Aptrafx.com    |
|			       |
+------------------------------*/

//
//+------------------------------------------------------------------+
// FractalAMA
//
// Description:  Fractal Adaptive Moving Average - by John Ehlers
// Version 1.1 7/17/2006
//
// Heavily modified and reprogrammed by Matt Kennel (mbkennelfx@gmail.com)
//
// Notes:
// October 2005 Issue - "FRAMA - Fractal Adaptive Moving Average"
//  Length will be forced to be an even number. Odd numbers will be bumped up to the
//  next even number.
// Formula Parameters:     Defaults:
// RPeriod                              16

#property  copyright "Copyright © 2005, MrPip "  // and mbkennel
#property  link      "http://www.metaquotes.net/"

//---- indicator settings
#property  indicator_chart_window
#property  indicator_buffers 2
#property indicator_color1 Red
#property indicator_color2 Blue

//---- buffers
double ExtMapBuffer1[];
double ExtMapBuffer2[];

extern int RPeriod = 16;
extern double multiplier = 4.6;
extern double signal_multiplier = 2.5;

//+------------------------------------------------------------------+
//| Custom indicator initialization function                         |
//+------------------------------------------------------------------+
int init()
  {


//---- 1 additional buffers are used for counting.
   IndicatorBuffers(2);

//---- drawing settings
   SetIndexBuffer(0,ExtMapBuffer1);
   SetIndexStyle(0,DRAW_LINE,STYLE_SOLID,2);
   SetIndexShift(0,0);
   IndicatorDigits(MarketInfo(Symbol(),MODE_DIGITS));
   SetIndexBuffer(1,ExtMapBuffer2);
   SetIndexStyle(1,DRAW_LINE,STYLE_SOLID,2);
   SetIndexShift(1,0);


//---- initialization done
   return(0);
  }

int start()
{
     int    i,k,counted_bars=IndicatorCounted();

     if (Bars < RPeriod) return(0);
     Comment("Bars : ",Bars);
     int maxshift = Bars-RPeriod-1;
     int limit= maxshift - counted_bars;
     if (limit < 1) limit = 1;

     int N = MathFloor(RPeriod/2)*2;  // Force N to even number
     double frama = Close[maxshift];
     double signal = frama;

     ExtMapBuffer1[maxshift] = Close[maxshift];
     ExtMapBuffer2[maxshift] = Close[maxshift];

     for(int shift = limit-1; shift >= 0; shift--) {
        double dimension_estimate = DEst(shift,N);

        double alpha = MathExp(-multiplier*(dimension_estimate-1.0));
        double alphas = MathExp(-signal_multiplier*(dimension_estimate-1.0));

        if (alpha > 1.0) alpha = 1.0;
        if (alpha < 0.01) alpha = 0.01;
        if (alphas > 1.0) alphas = 1.0;
        if (alphas < 0.01) alphas = 0.01;

        frama = alpha* Close[shift] + (1.0-alpha)* ExtMapBuffer1[shift+1];
        signal = alphas * frama + (1.0 - alphas)* ExtMapBuffer2[shift+1];

        ExtMapBuffer1[shift] = frama;
        ExtMapBuffer2[shift] = signal;


      }
   return(0);
}


double DEst(int shift, int n) {
   //
   double R1, R2, R3;
   int n2 = n/2;

   R3 = Range(shift,n) / n;
   R1 = Range(shift,n2) / n2;
   R2 = Range(shift+n2,n2) / n2;

   return(  (MathLog(R1+R2)-MathLog(R3) )* 1.442695 ) ; // log_2(e) = 1.442694


}

double Range(int i, int k) {

      return( High[Highest(NULL,0,MODE_HIGH,k,i)] - Low[Lowest(NULL,0,MODE_LOW,k,i)] );
}
Comments