FractalChannelh
Download script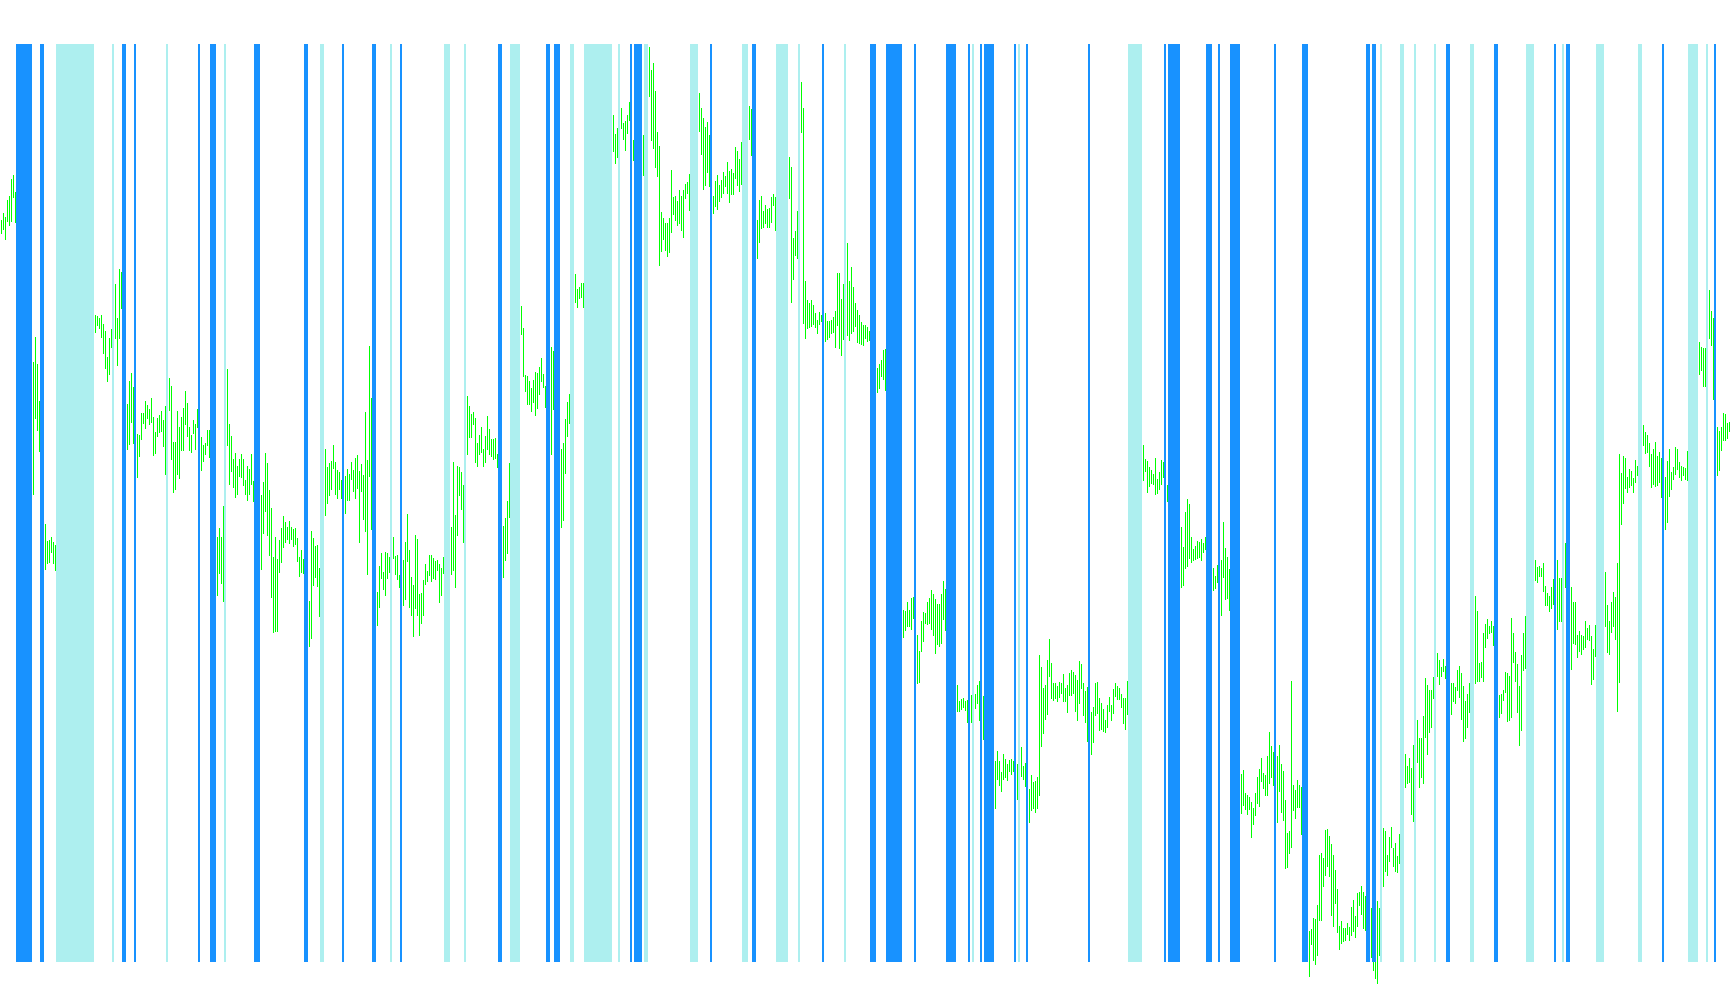
Overview
The Fractal Channel is a specialized visual tool designed to help traders identify key structural boundaries in the financial markets. By analyzing historical price movements, it automatically maps out "Support" and "Resistance" levels—the invisible floors and ceilings where prices often struggle to move through. Unlike static horizontal lines, this indicator dynamically adjusts based on the market's behavior, providing a clearer picture of current price trends.
How It Works
The logic behind the tool operates in three primary stages:
1. Identifying Market Extremes (Fractals) The script scans the price history to find specific "Fractal" points. A fractal is a geometric pattern that represents a significant peak or valley in price movement.
- Upper Fractals: These represent local highs where the price has reached a temporary summit before pulling back.
- Lower Fractals: These represent local lows where the price has bottomed out before moving higher.
2. Constructing the Support and Resistance Channels Once these peaks and valleys are identified, the tool builds a continuous channel:
- Resistance (The Ceiling): When the script finds an upper fractal, it marks that price level as a point of resistance. If no new high is formed, the tool maintains the previous resistance level, creating a horizontal boundary.
- Support (The Floor): Similarly, when a lower fractal is detected, it marks that price as a support level. The script carries this value forward until a new market bottom is established.
This creates two distinct boundaries on your chart: a "ceiling" that the price tends to hit and bounce off of, and a "floor" that serves as a base for potential upward movement.
3. Trend Detection and Signaling Beyond just drawing lines, the tool monitors where the current market price sits in relation to these boundaries. It evaluates the current closing price against the established support and resistance levels:
- Bullish Sentiment: If the market price closes above the current Resistance level, the tool recognizes a potential breakout toward the upside.
- Bearish Sentiment: If the market price closes below the current Support level, the tool identifies a potential breakdown toward the downside.
Key Benefits for Traders
By translating complex price action into clear visual boundaries, this script helps traders avoid "over-analyzing" every minor fluctuation. It allows you to see the broader structure of the market at a glance, helping you identify where the price is likely to encounter friction and where it might be gaining enough momentum to break through established barriers.
//+------------------------------------------------------------------+
//|                                             Fractal Channel.mq4  |
//|                                 Copyright © 2005  Chris Battles  |
//|                                             cbattles@neo.rr.com  |
//+------------------------------------------------------------------+
#property copyright "Chris Battles"
#property link      "mailto:cbattles@neo.rr.com"

#property indicator_separate_window
#property indicator_buffers 4
#property indicator_color1 Red
#property indicator_color2 Blue
#property indicator_color3 DodgerBlue
#property indicator_color4 Crimson
#property indicator_minimum -0.1
#property indicator_maximum 1.0
//---- buffers
double v1[];
double v2[];
double v3[];
double v4[];
//----
double val1;
double val2;
int i, b = 0, s = 0;
//+------------------------------------------------------------------+
//|                                                                  |
//+------------------------------------------------------------------+
int init()
  {

//----
   SetIndexStyle(0, 12);
   SetIndexDrawBegin(0, i-1);
   SetIndexBuffer(0, v1);
   SetIndexLabel(0, "Resistance");
//----
   SetIndexStyle(1, 12);
   SetIndexDrawBegin(1, i-1);
   SetIndexBuffer(1, v2);
   SetIndexLabel(1, "Support");

   SetIndexStyle(2, 2, 0, 4);
    SetIndexBuffer(2, v3);
       SetIndexStyle(3, 2, 0, 4);
    SetIndexBuffer(3, v4);
//----
   return(0);
  }
//+------------------------------------------------------------------+
//|                                                                  |
//+------------------------------------------------------------------+
int start()
  {
   i = Bars;
   while(i >= 0)
     {
       val1 = iFractals(NULL, 0, MODE_UPPER, i);
       //----
       if(val1 > 0)
           v1[i] = High[i];
       else
           v1[i] = v1[i+1];
       val2 = iFractals(NULL, 0, MODE_LOWER, i);
       //----
       if(val2 > 0)
           v2[i] = Low[i];
       else
           v2[i] = v2[i+1];


                if(iClose(NULL,0,i) > v1[i]){
     v3[i] = 1;
     v4[i] = 0;
     }
     if(iClose(NULL,0,i) < v2[i]){
      v3[i] = 0;
     v4[i] = 1;
     }
       i--;
     }

   return(0);
}

//+------------------------------------------------------------------+
Comments