Fractal Support and Resistance
Download script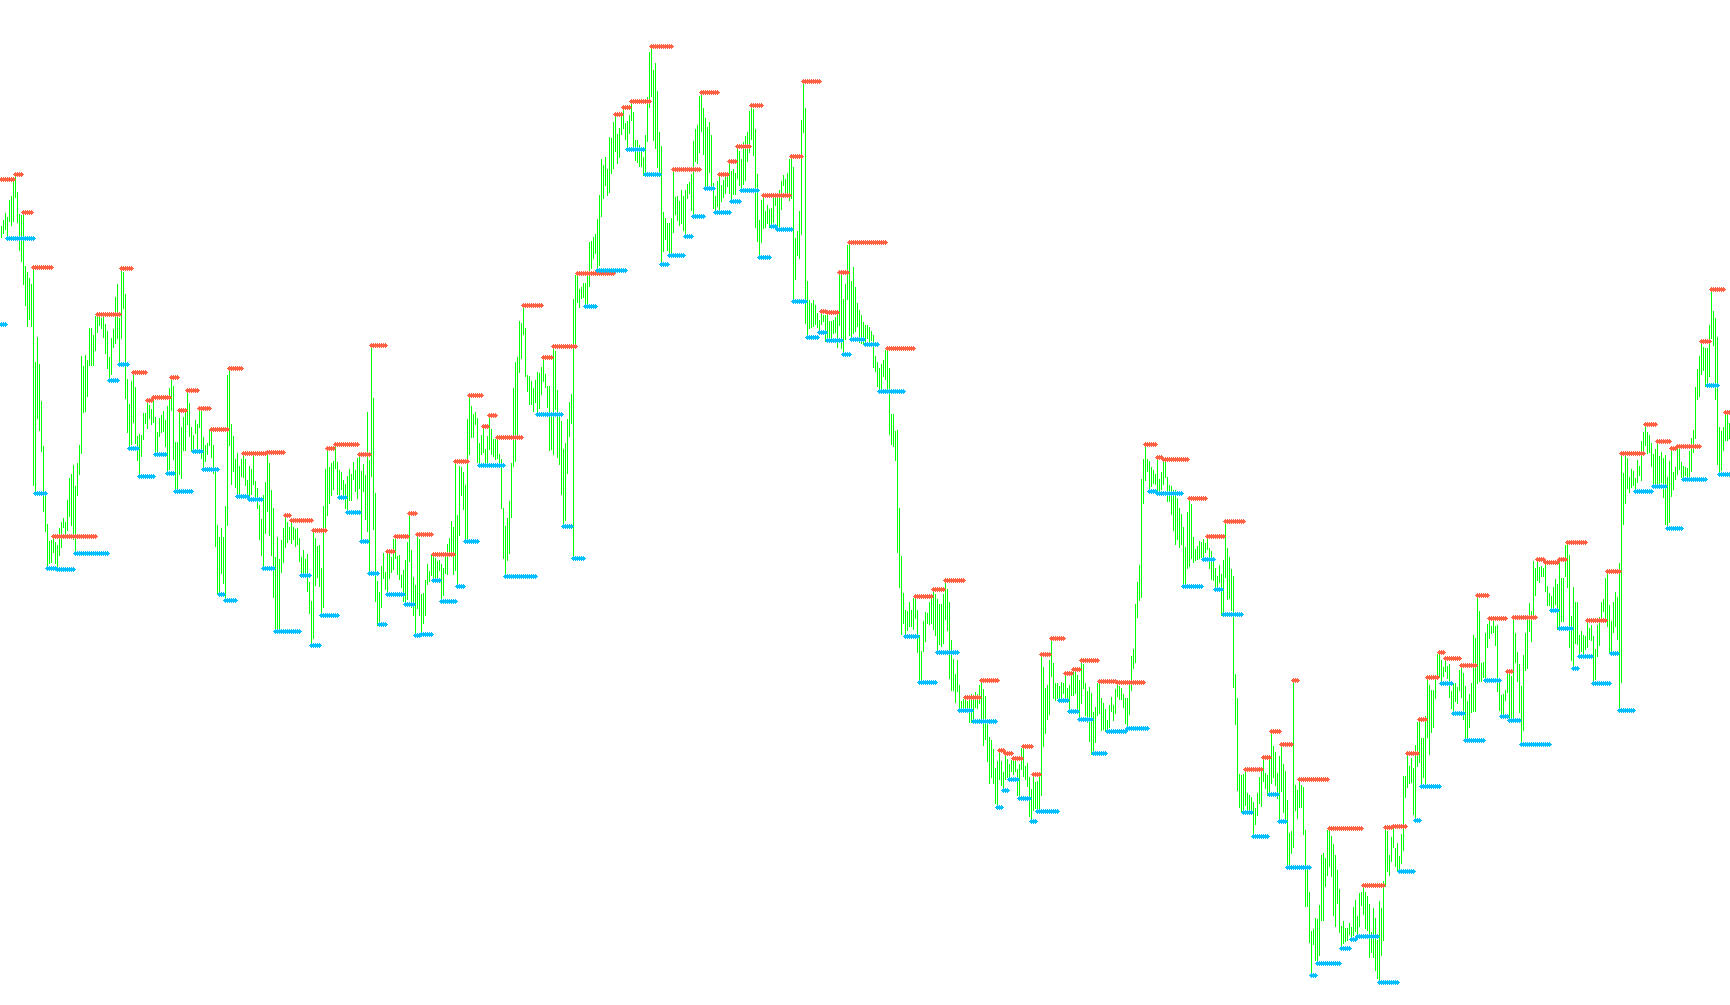
This tool is designed to help traders visualize key price levels on a financial chart by automatically identifying "Support" and "Resistance" zones. In trading, these are areas where the price historically struggles to move past—think of them as "floors" (support) where prices tend to bounce upward or "ceilings" (resistance) where prices tend to drop back down.
How it Works
The script scans your chart's historical data to pinpoint specific structural turning points. It uses a mathematical calculation to detect local peaks and valleys—moments where the market temporarily reversed direction.
- Resistance Levels (The Ceilings): The tool identifies upper peaks in price action. When it finds one of these high points, it marks it as a resistance level. If no new peak is found immediately, it carries forward the previous known high point, creating a continuous visual line that shows where the price has struggled to break through from below.
- Support Levels (The Floors): Similarly, the tool identifies lower valleys in price action. These represent moments where buying pressure pushed the price back up. The script tracks these low points and carries them forward, establishing a visible base that indicates where the price has historically found solid "ground."
Visual Representation
The indicator displays these levels directly on your main chart using two distinct colors:
- Tomato Red: Used to highlight Resistance levels.
- DeepSkyBlue: Used to highlight Support levels.
By automating this process, the script removes the guesswork from identifying significant price boundaries. Instead of manually guessing where a trend might stall, the tool provides a persistent visual map of the market's historical "memory," allowing you to see potential areas of interest at a glance.
//+------------------------------------------------------------------+
//|                Support and Resistance                            |
//|                Copyright © 2004  Barry Stander                   |
//|                http://myweb.absa.co.za/stander/4meta/            |
//+------------------------------------------------------------------+
#property copyright "Click here: Barry Stander"
#property link      "http://myweb.absa.co.za/stander/4meta/"

#property indicator_chart_window
#property indicator_buffers 2
#property indicator_color1 Tomato
#property indicator_color2 DeepSkyBlue

//---- buffers
double v1[];
double v2[];
double val1;
double val2;
int i;

int init()
  {

  IndicatorBuffers(2);

//---- drawing settings
 SetIndexArrow(0, 119);
 SetIndexArrow(1, 119);

   SetIndexStyle(0,DRAW_ARROW,STYLE_DOT,0,Tomato);
   SetIndexDrawBegin(0,i-1);
   SetIndexBuffer(0, v1);
   SetIndexLabel(0,"Resistance");


   SetIndexStyle(1,DRAW_ARROW,STYLE_DOT,0,DeepSkyBlue);
   SetIndexDrawBegin(1,i-1);
   SetIndexBuffer(1, v2);
   SetIndexLabel(1,"Support");

   return(0);
  }

int start()
  {

   i=Bars;
   while(i>=0)
     {

val1 = iFractals(NULL, 0, MODE_UPPER,i);
 if (val1 > 0)
   v1[i]=High[i];
    else
      v1[i] = v1[i+1];

val2 = iFractals(NULL, 0, MODE_LOWER,i);
 if (val2 > 0)
   v2[i]=Low[i];
      else
      v2[i] = v2[i+1];

      i--;
     }
   return(0);
  }

//+------------------------------------------------------------------+
Comments