Future Candles~
Indicator

Future Candles~

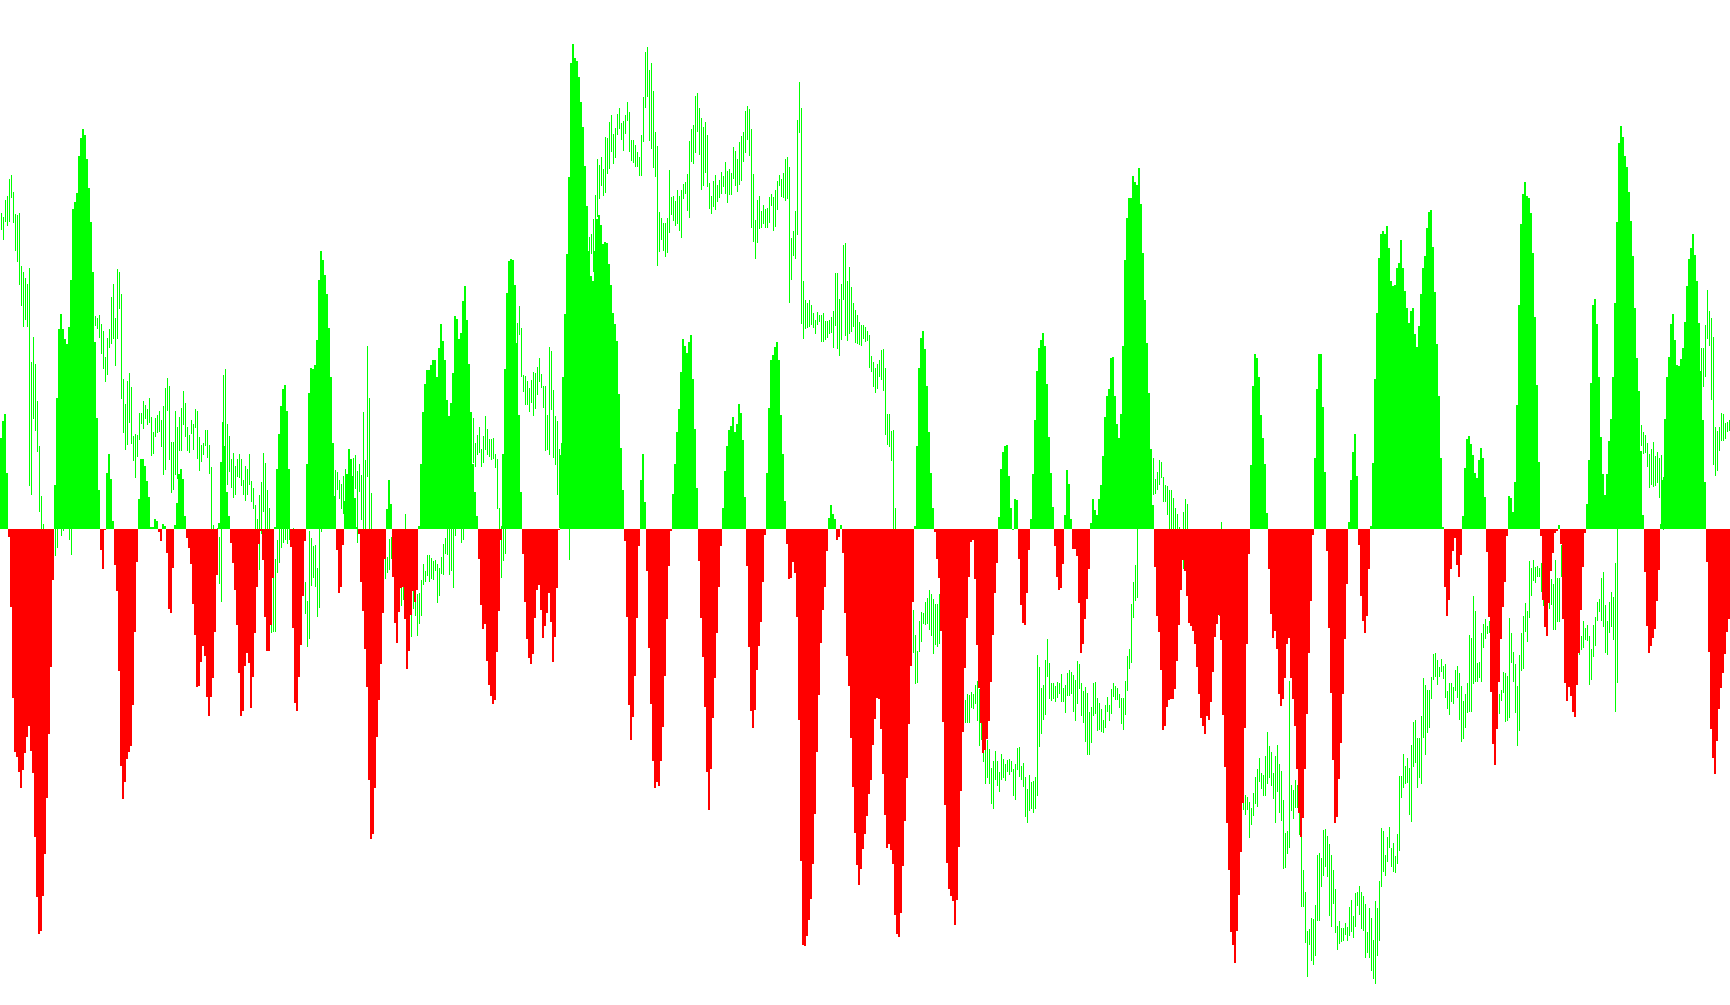
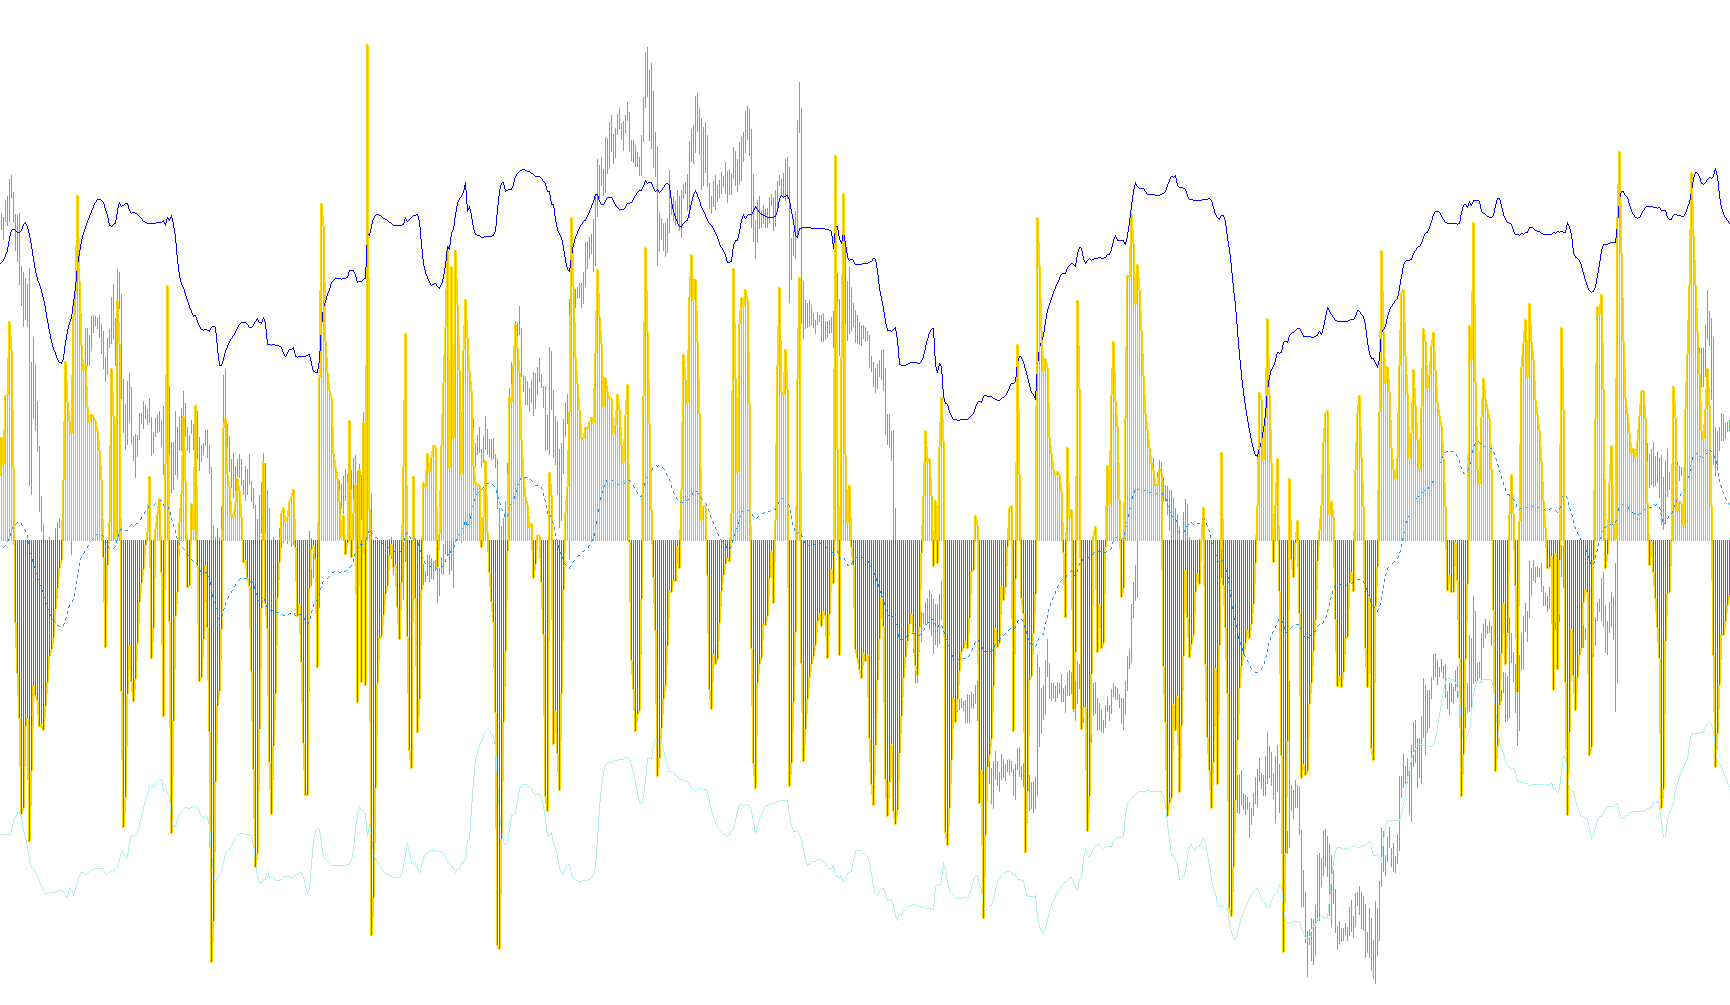
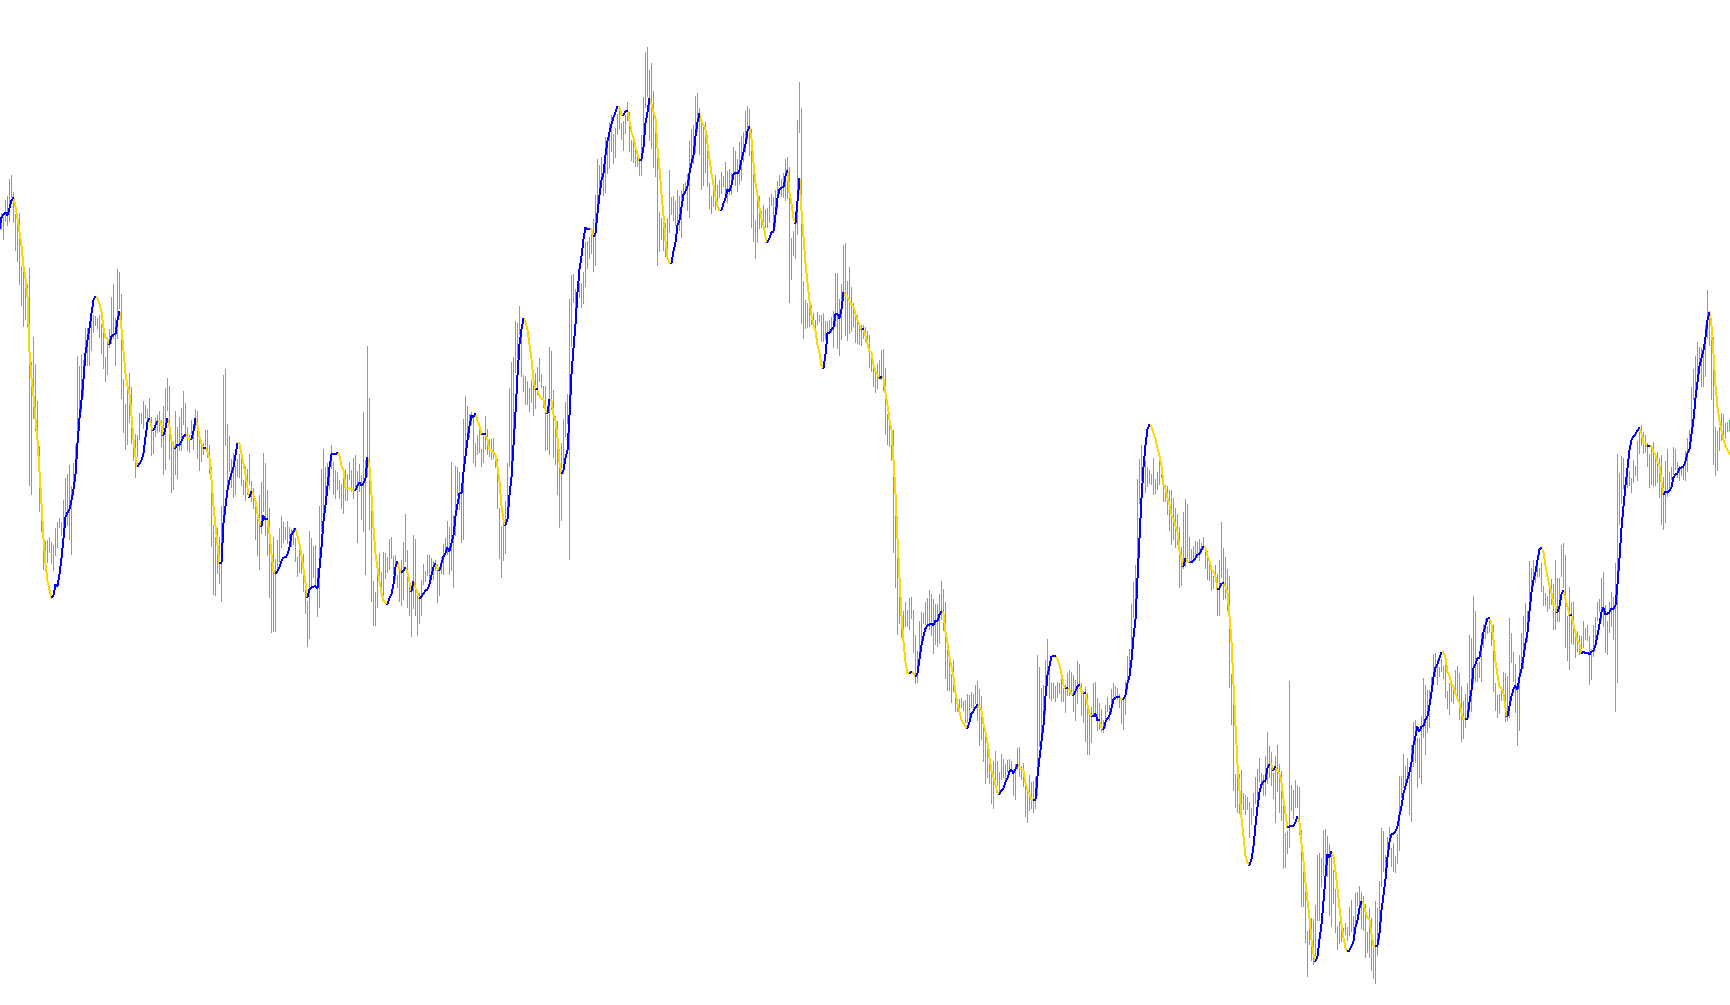
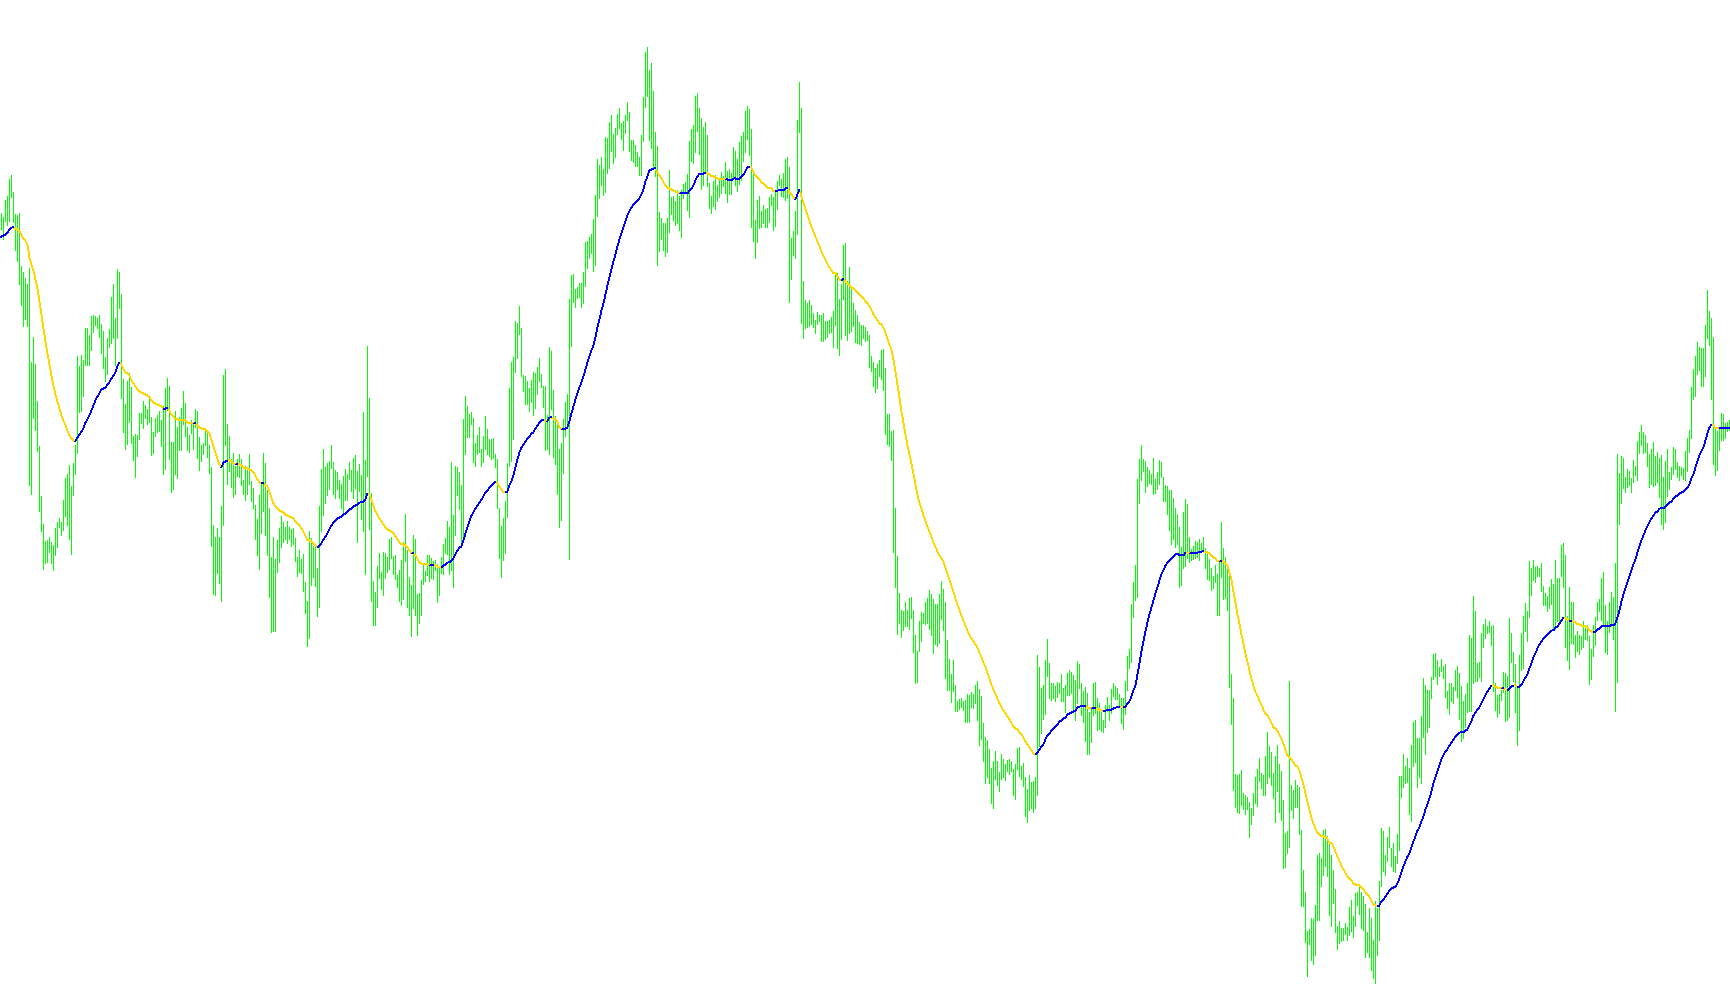
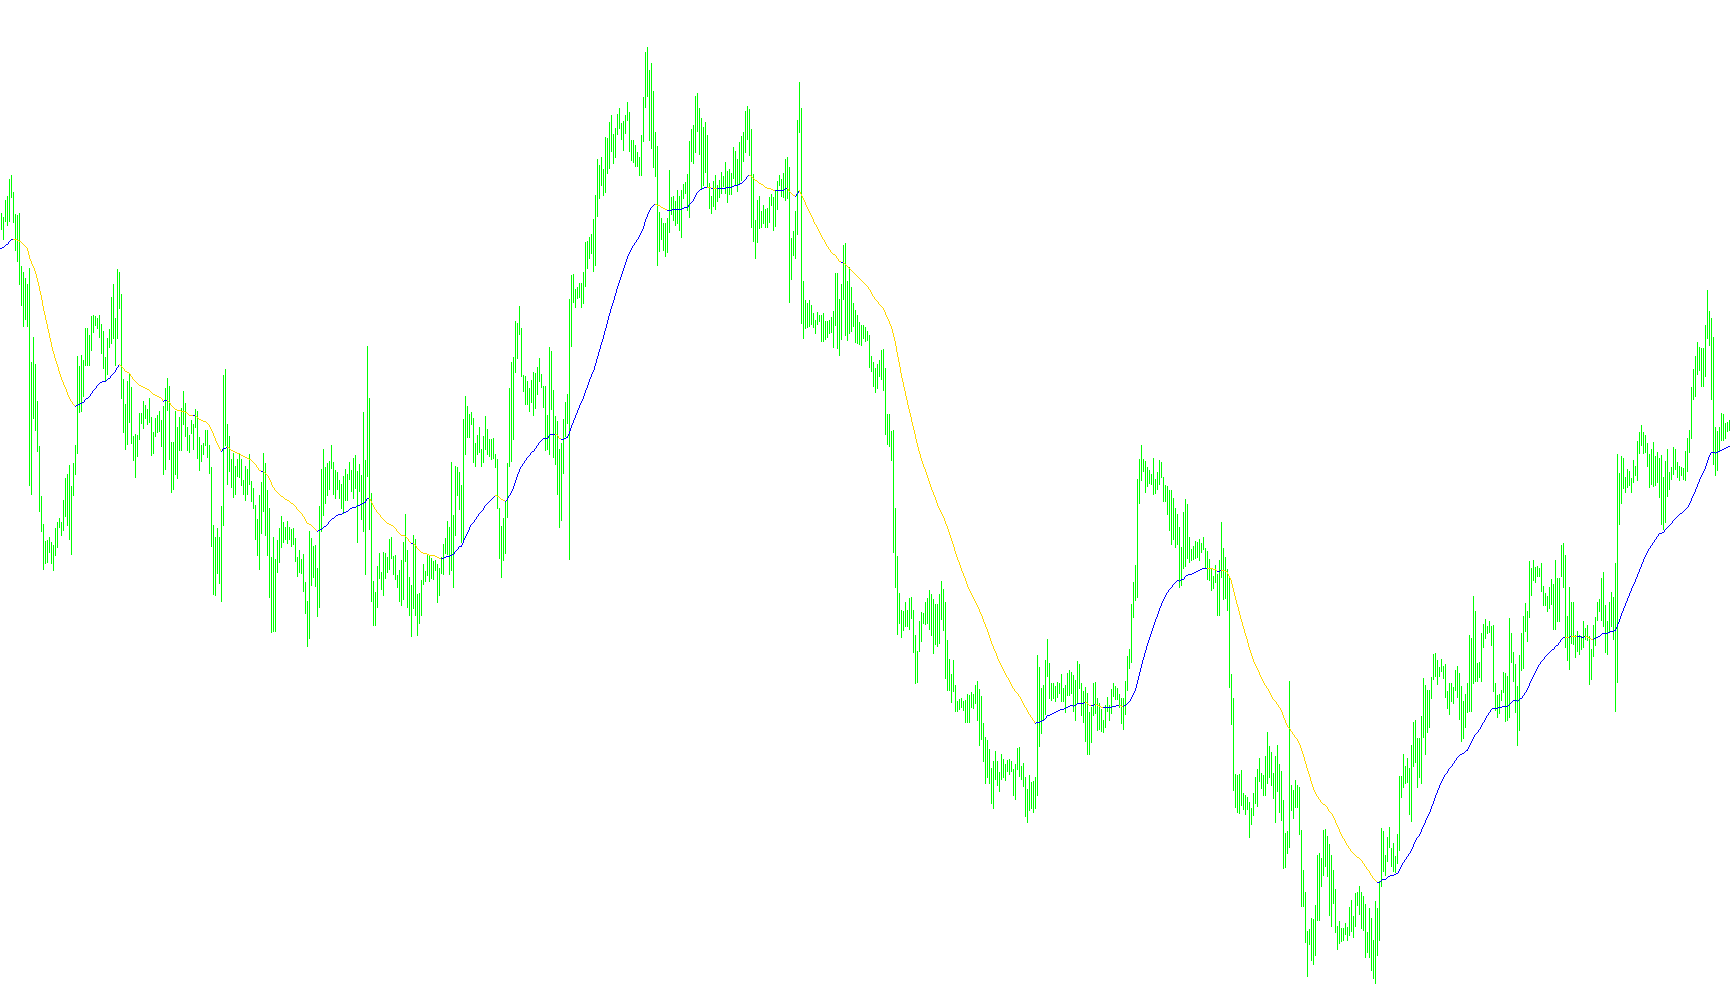
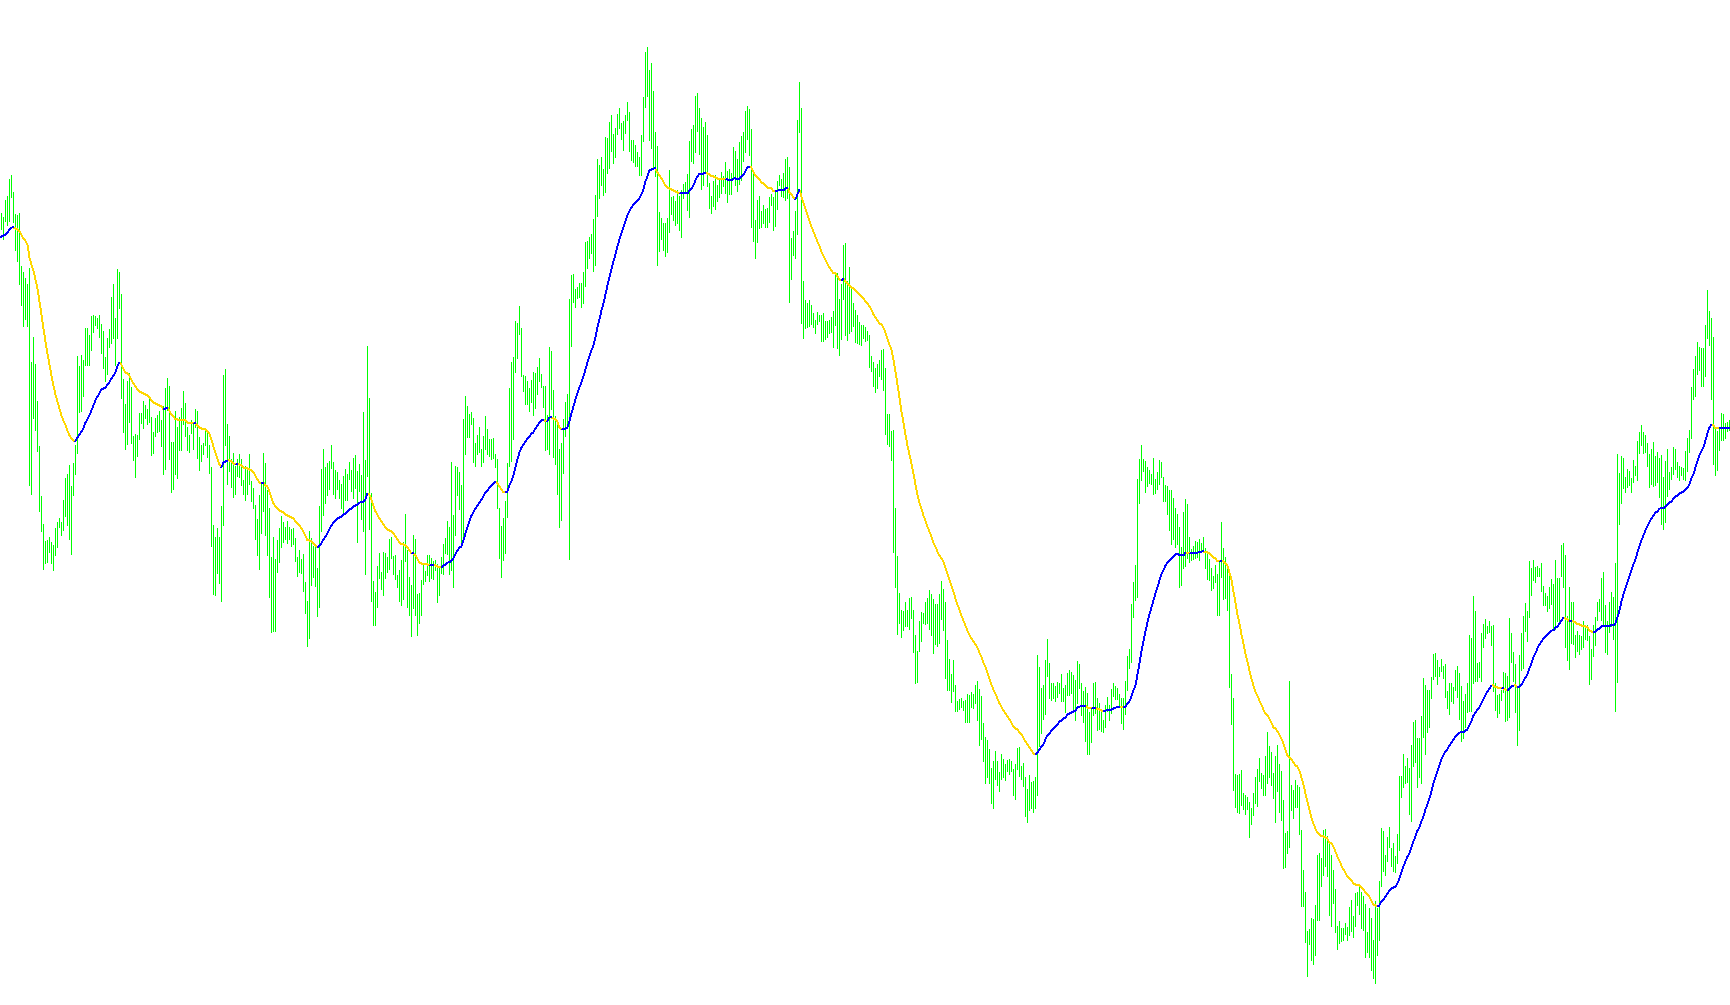
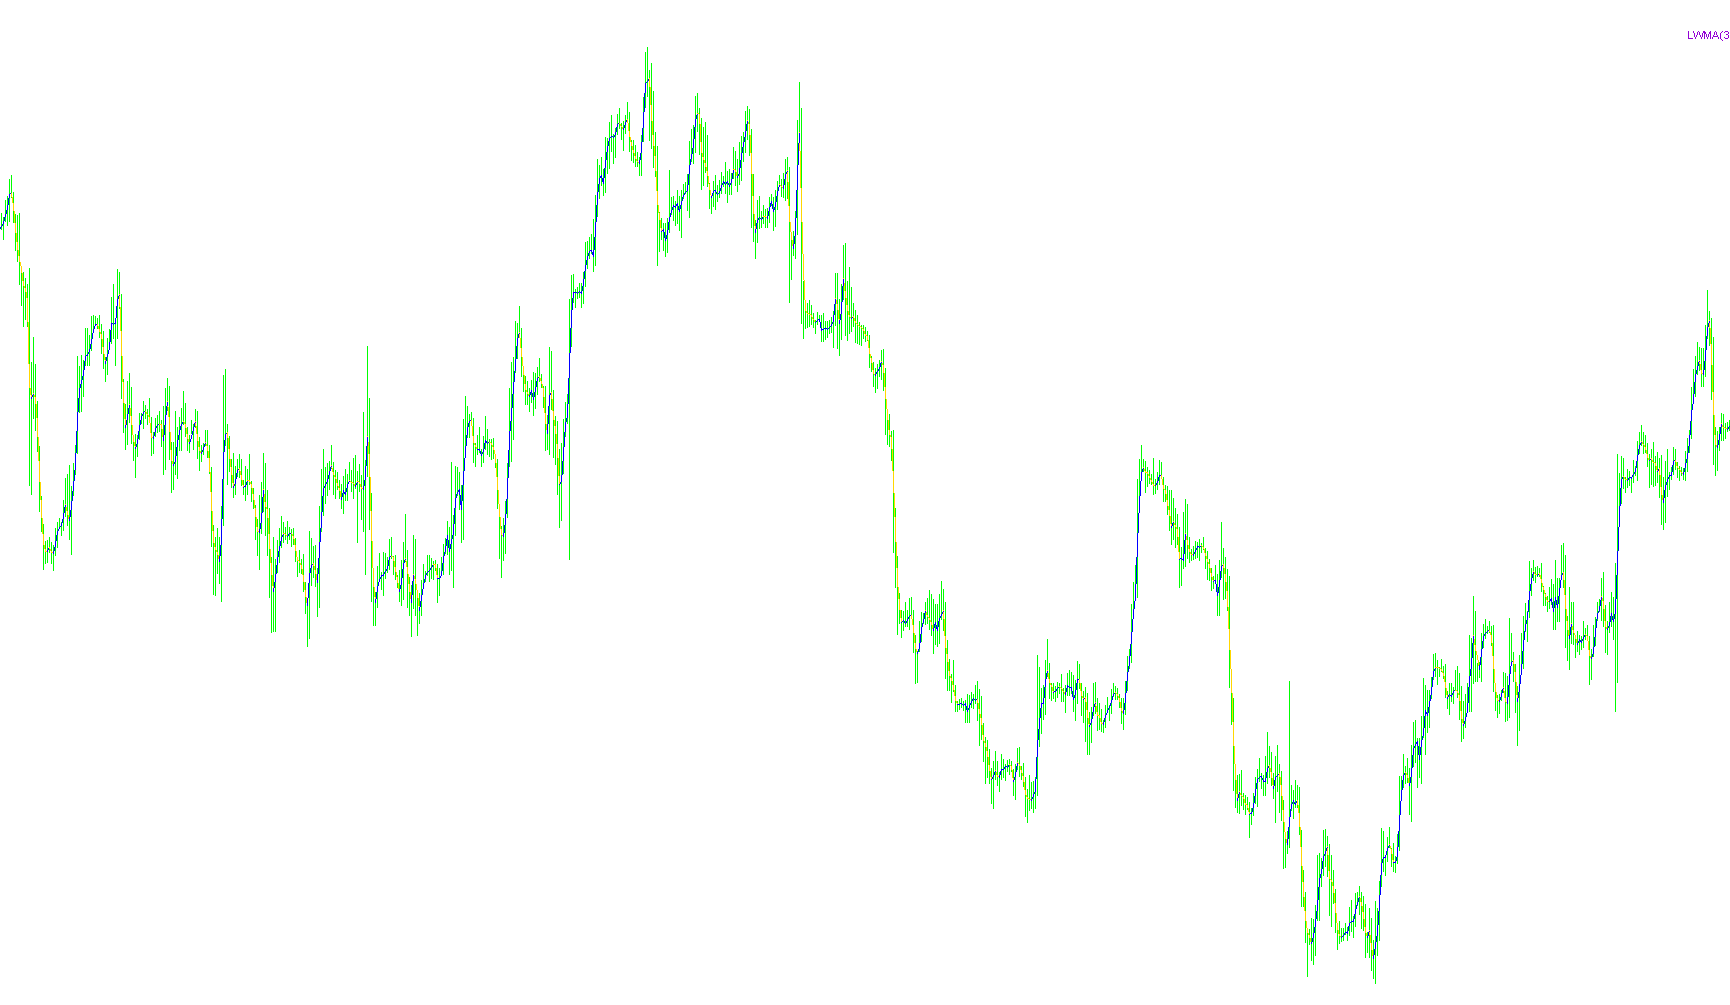
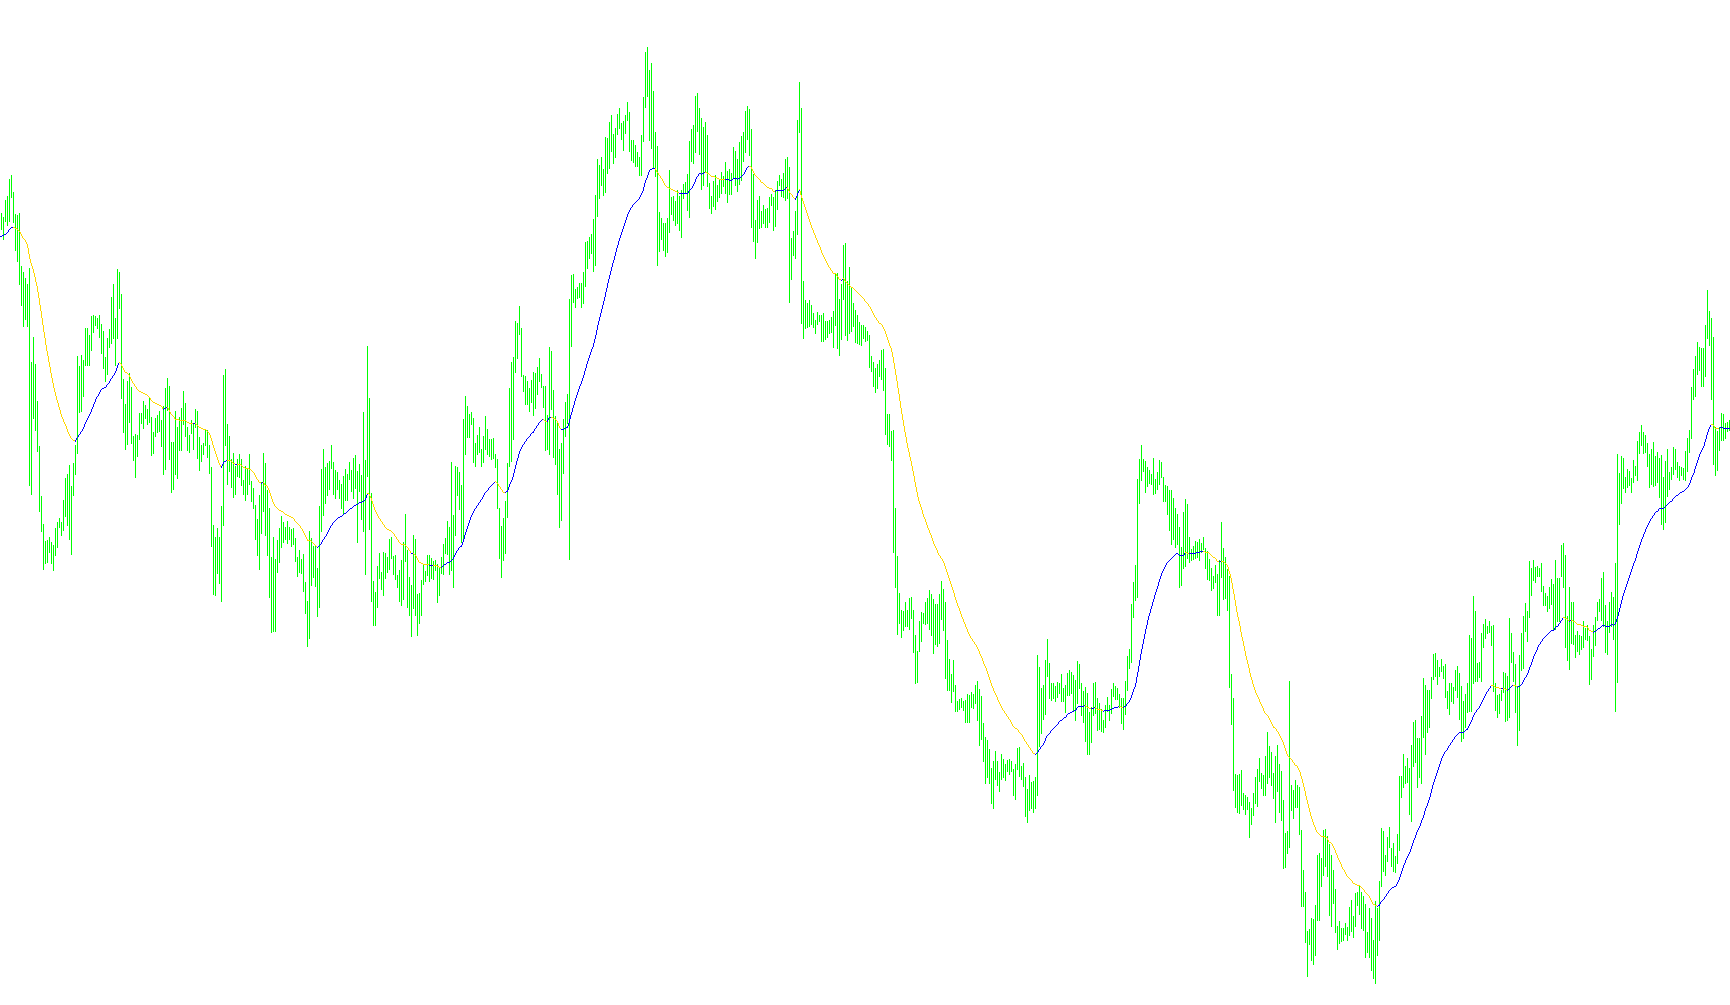
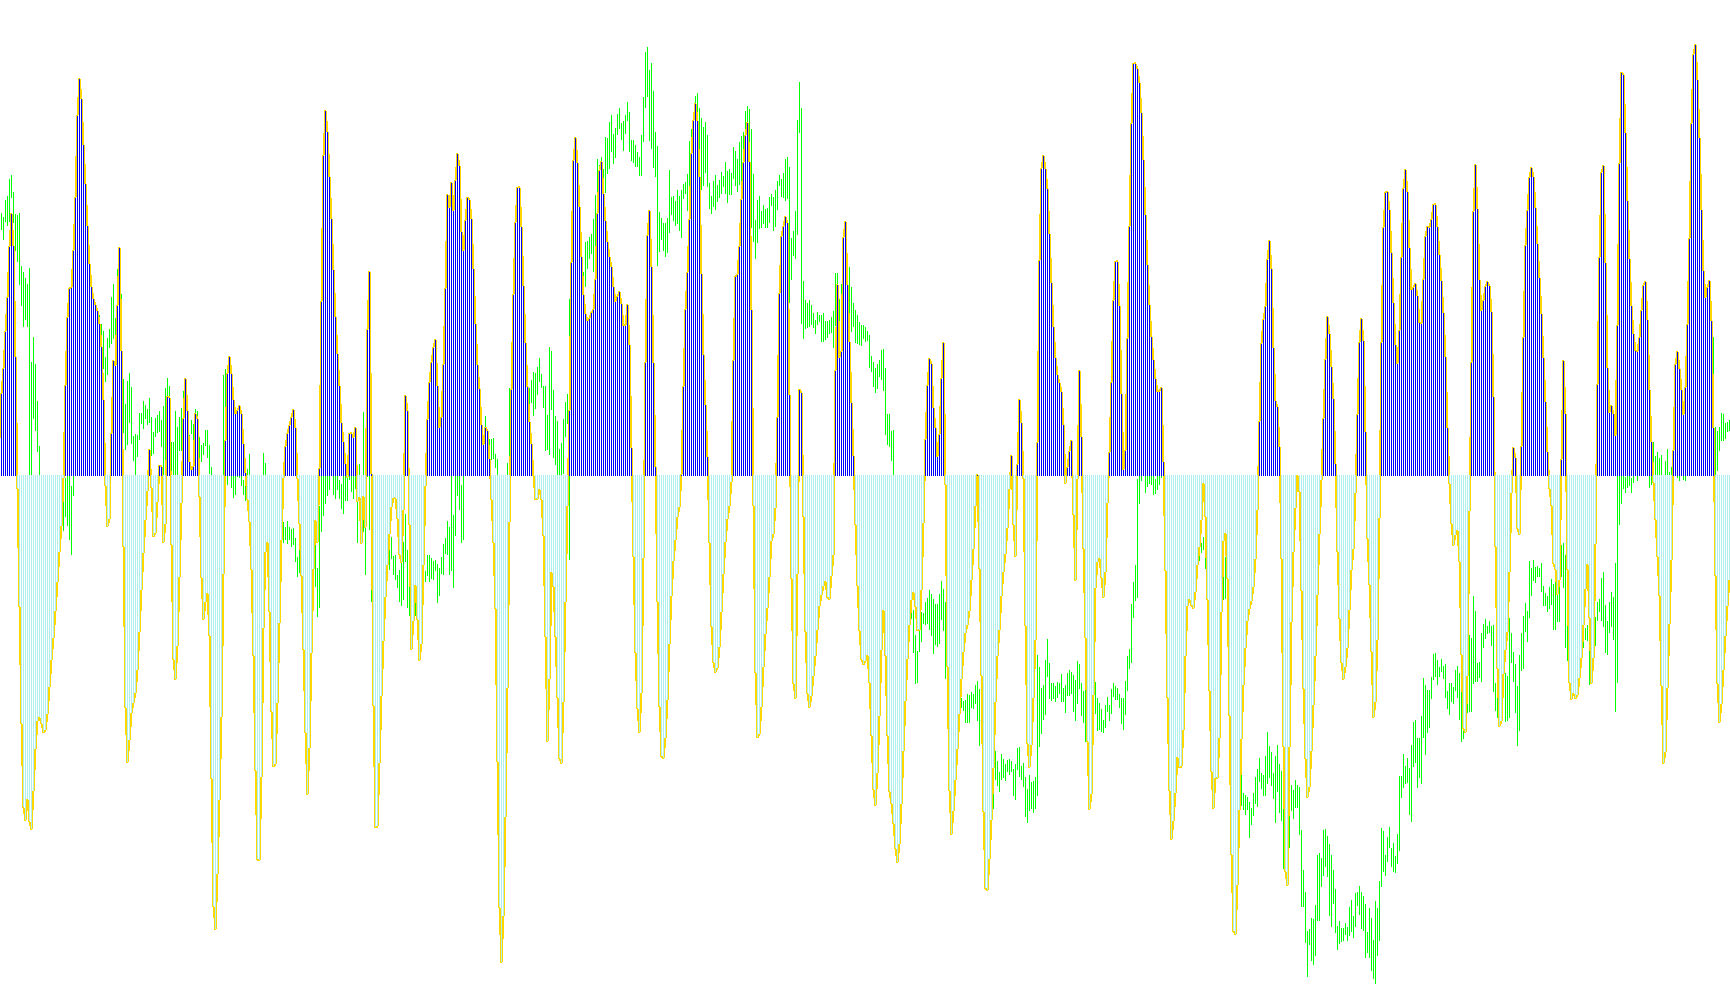
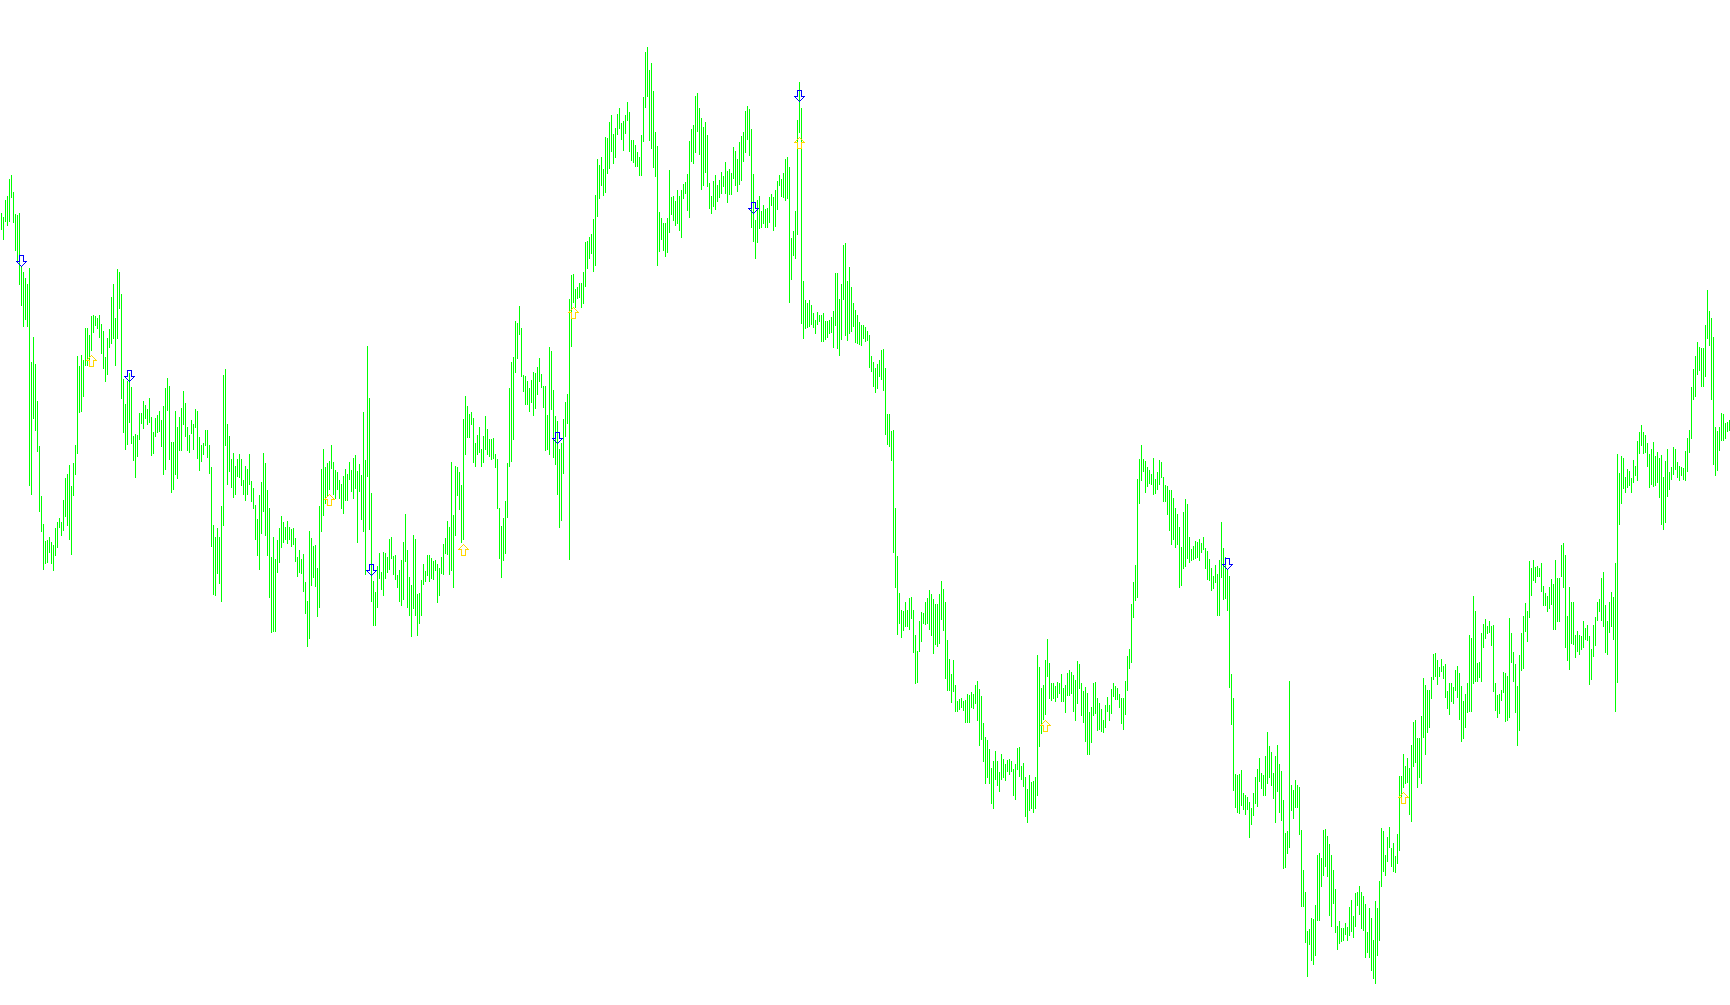
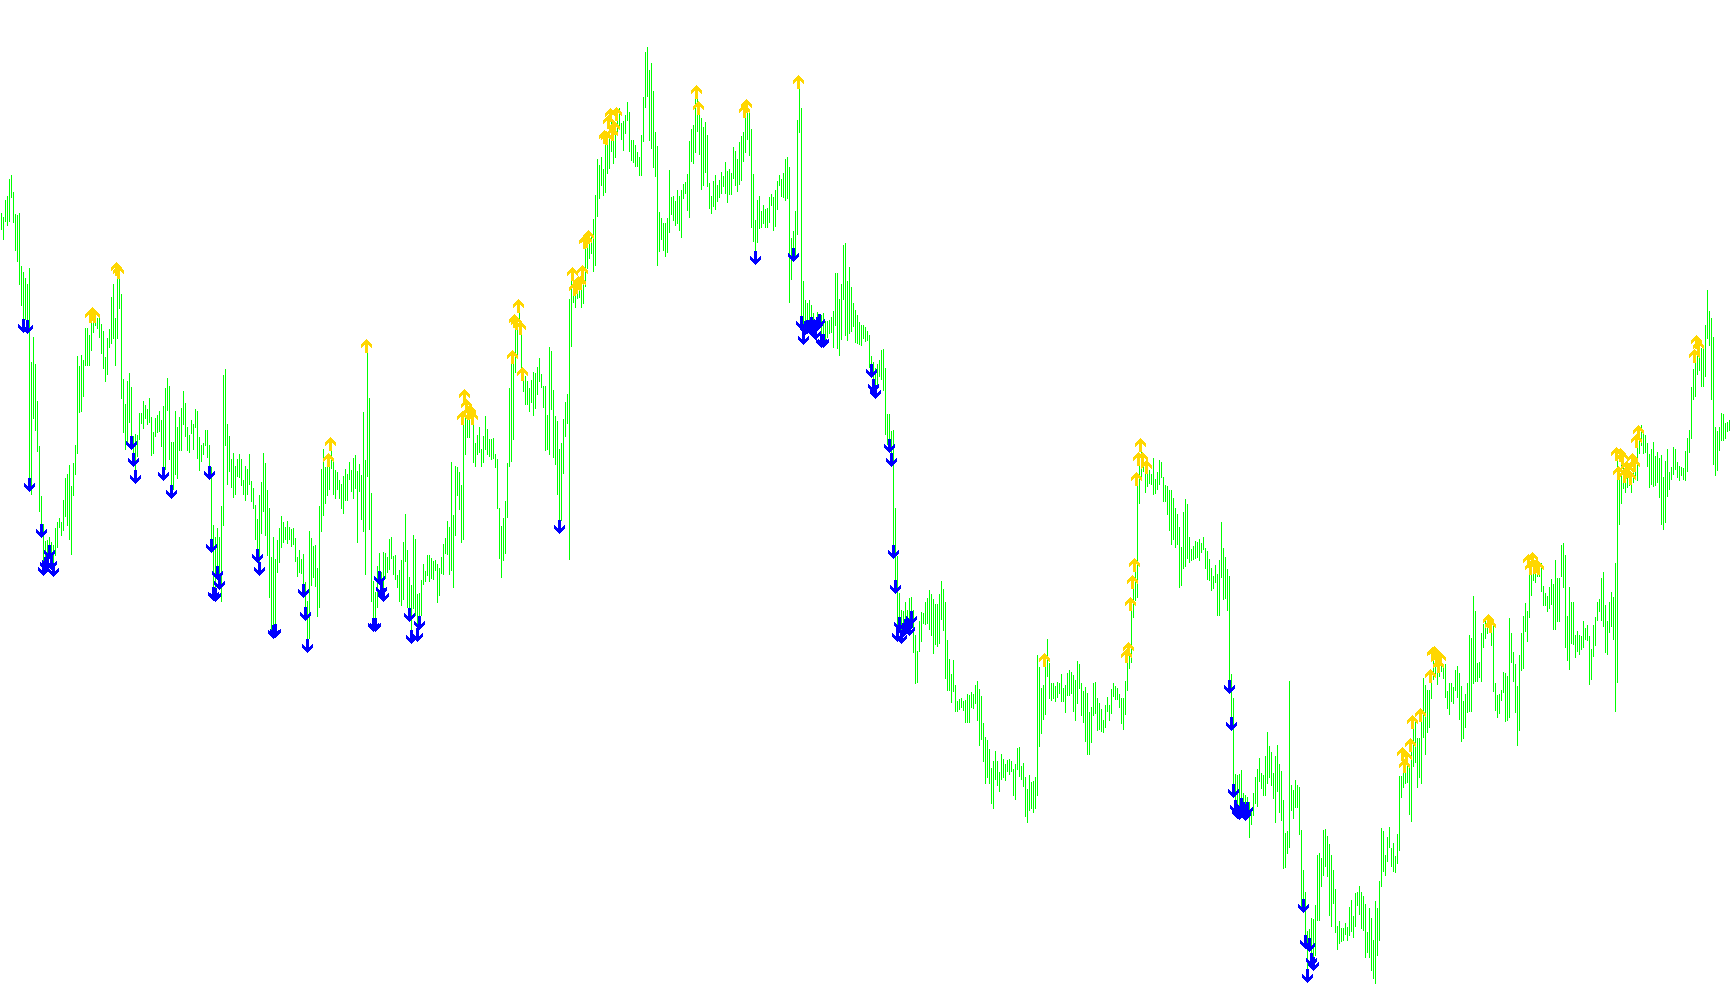
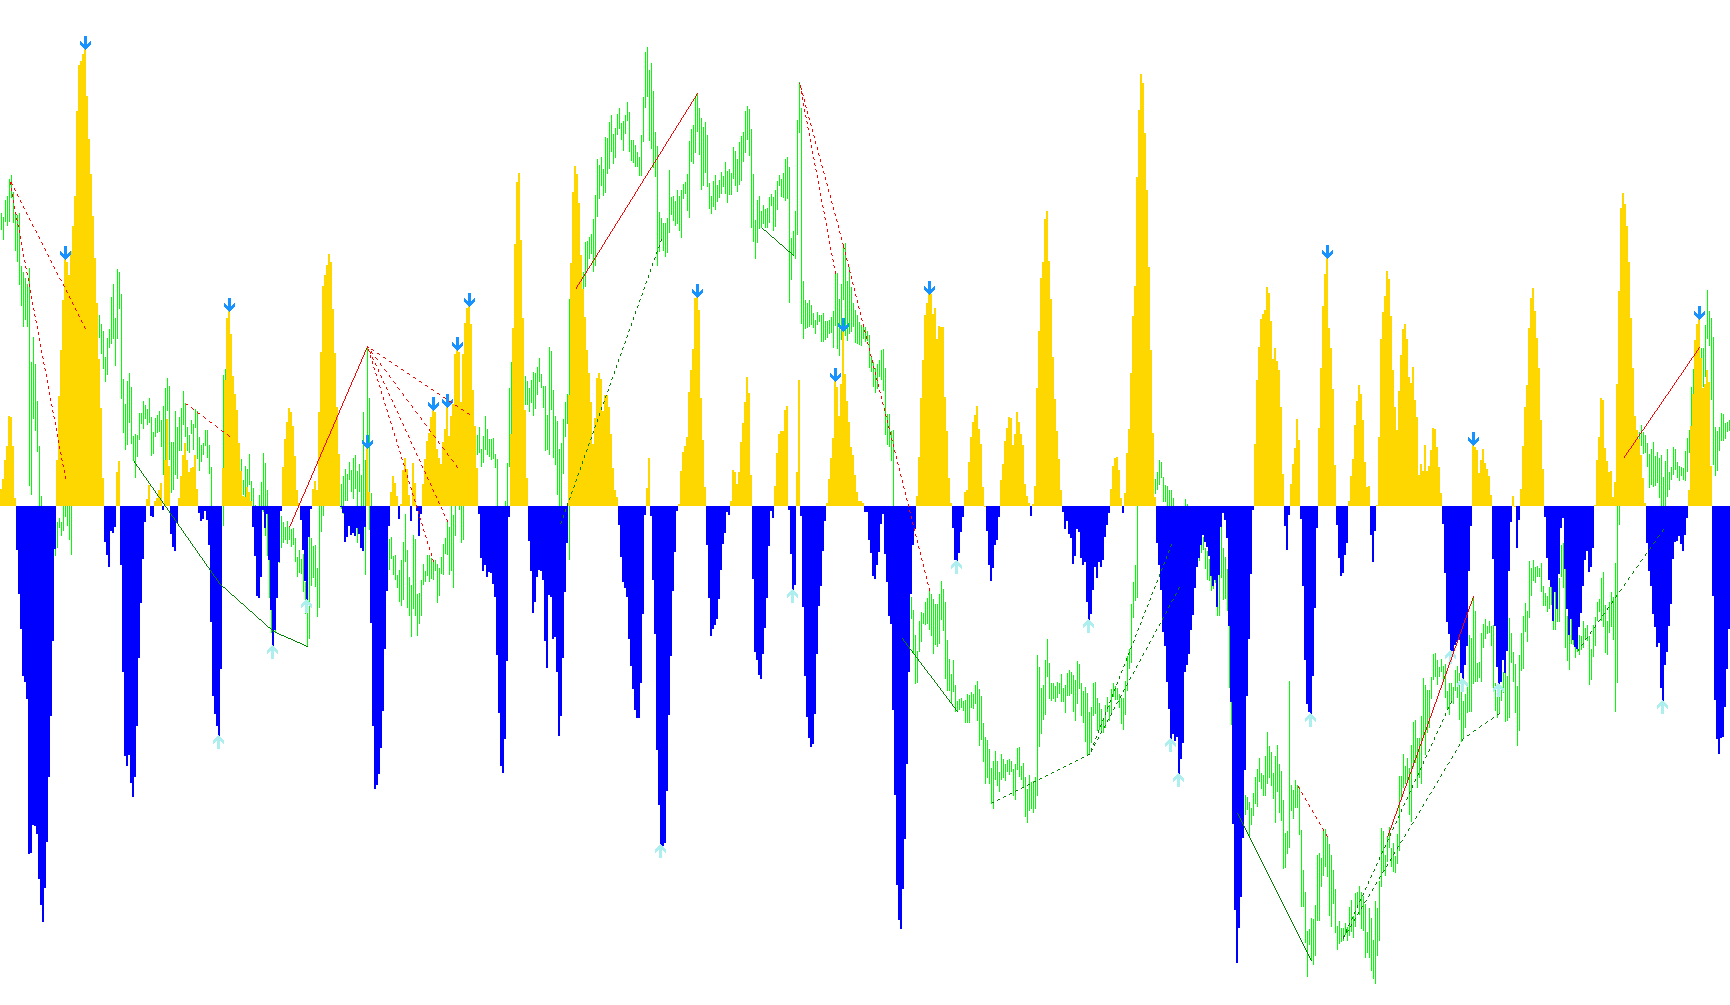
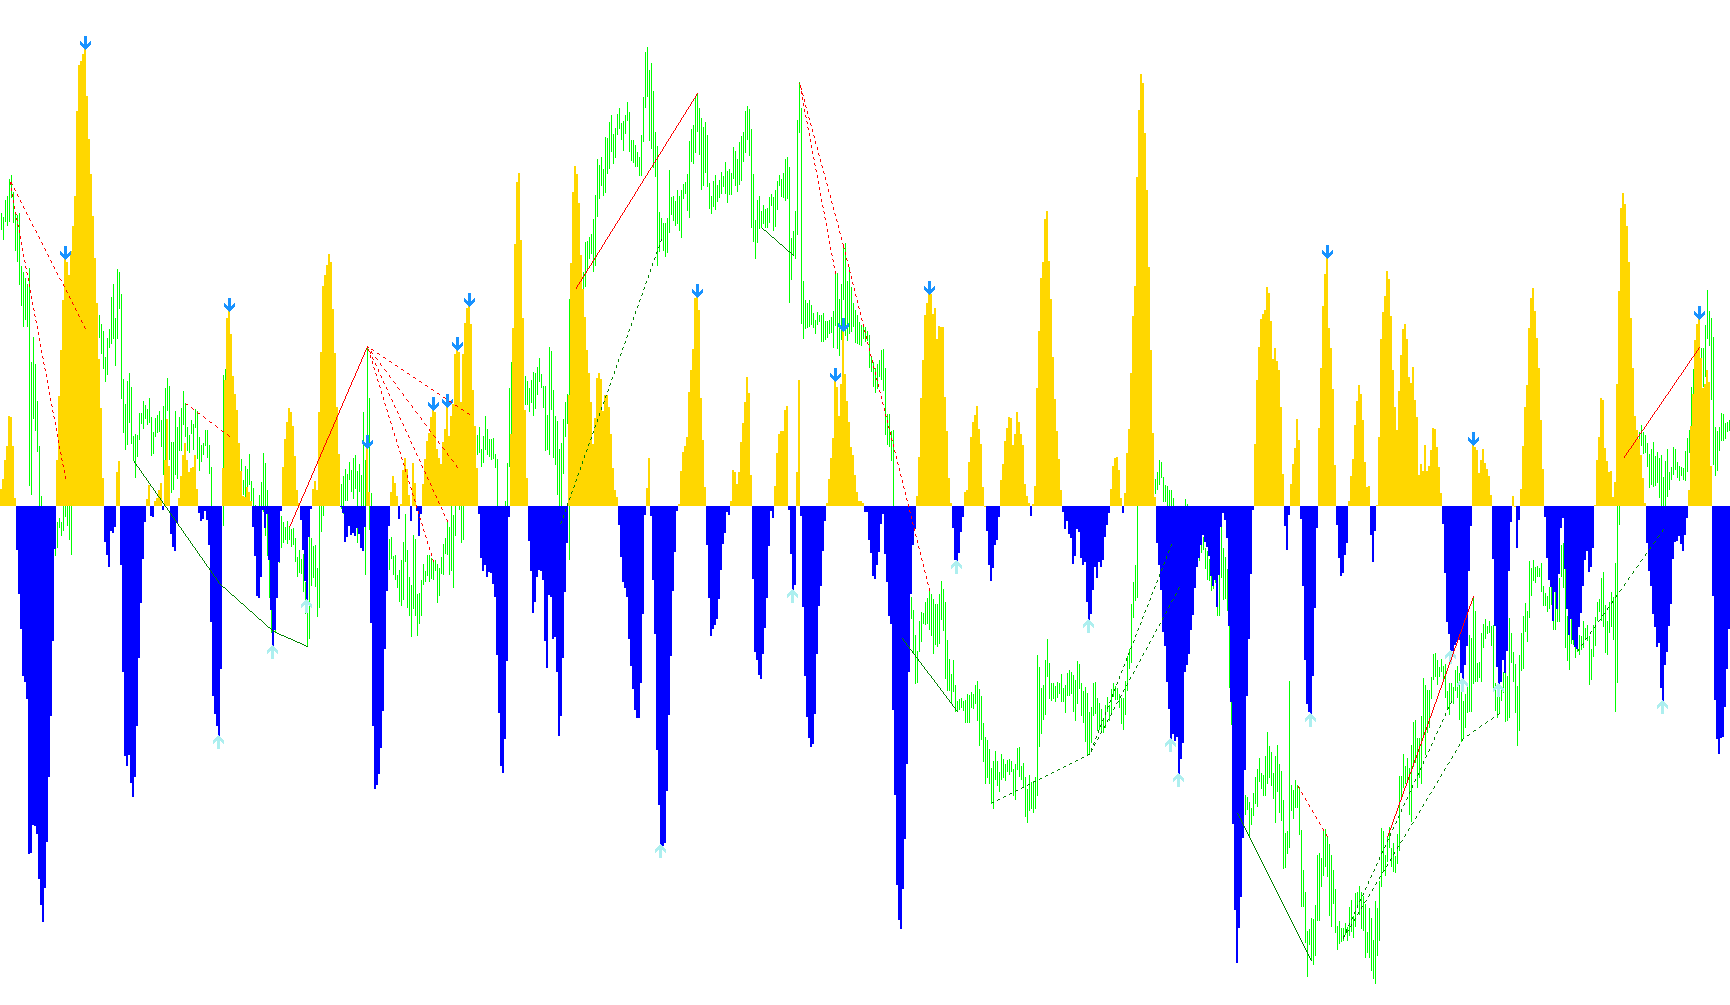
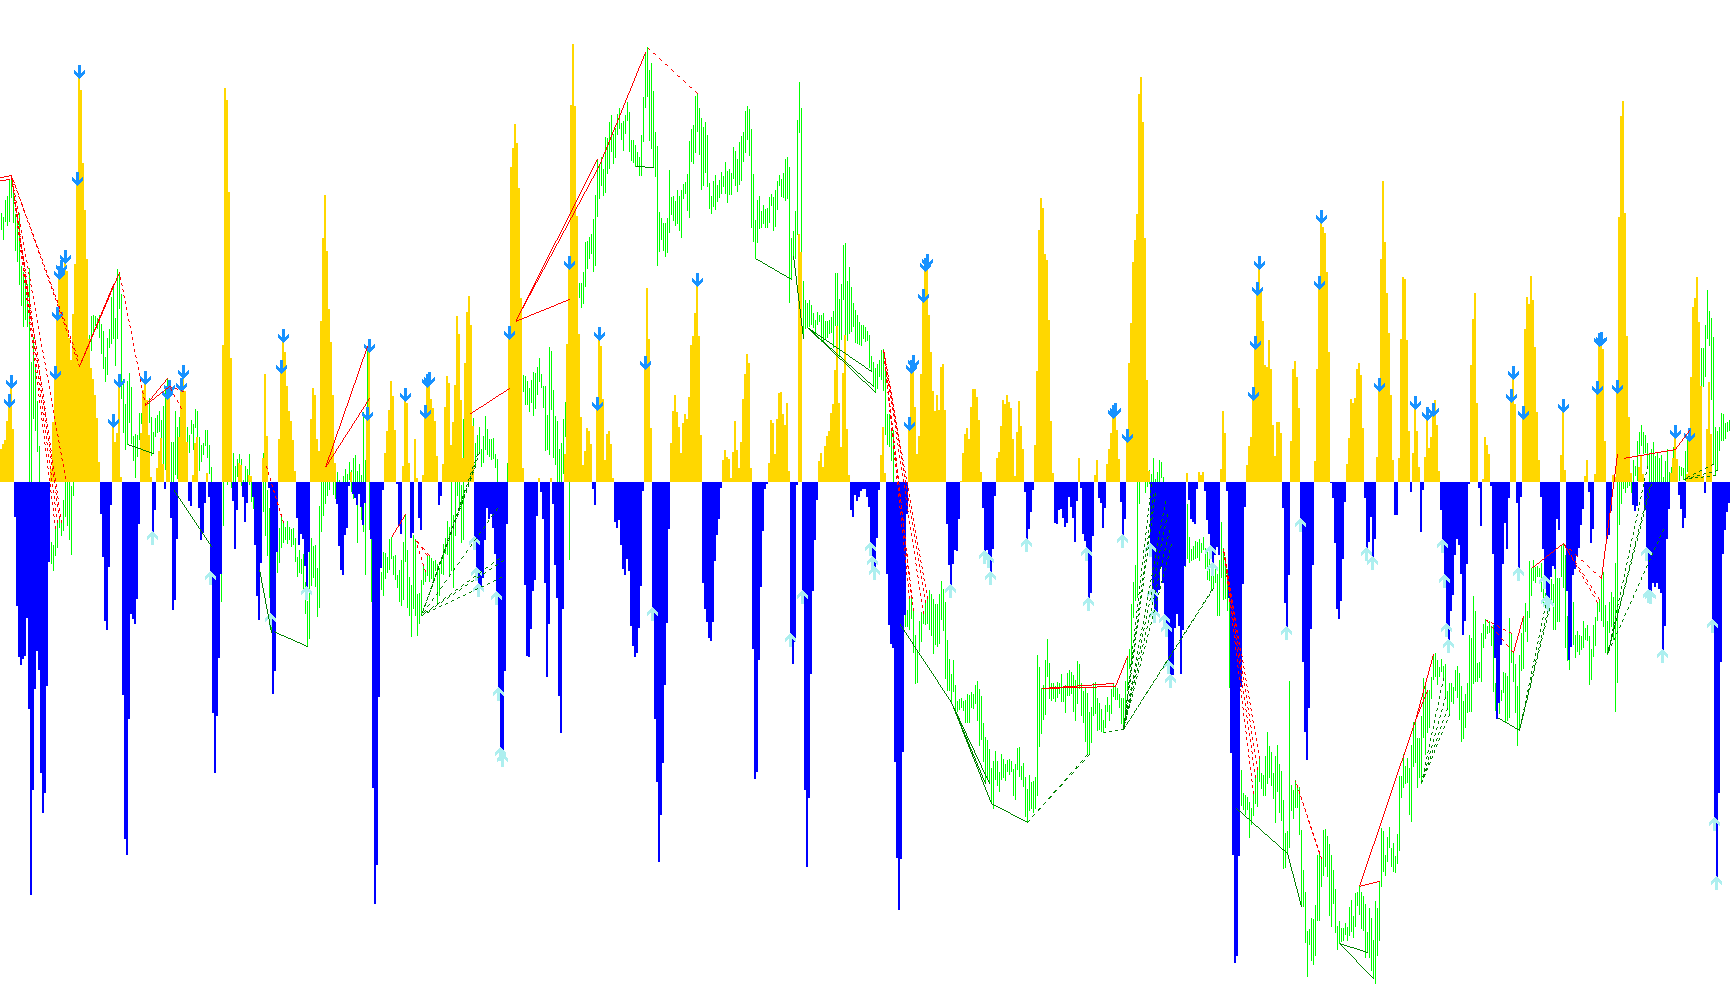
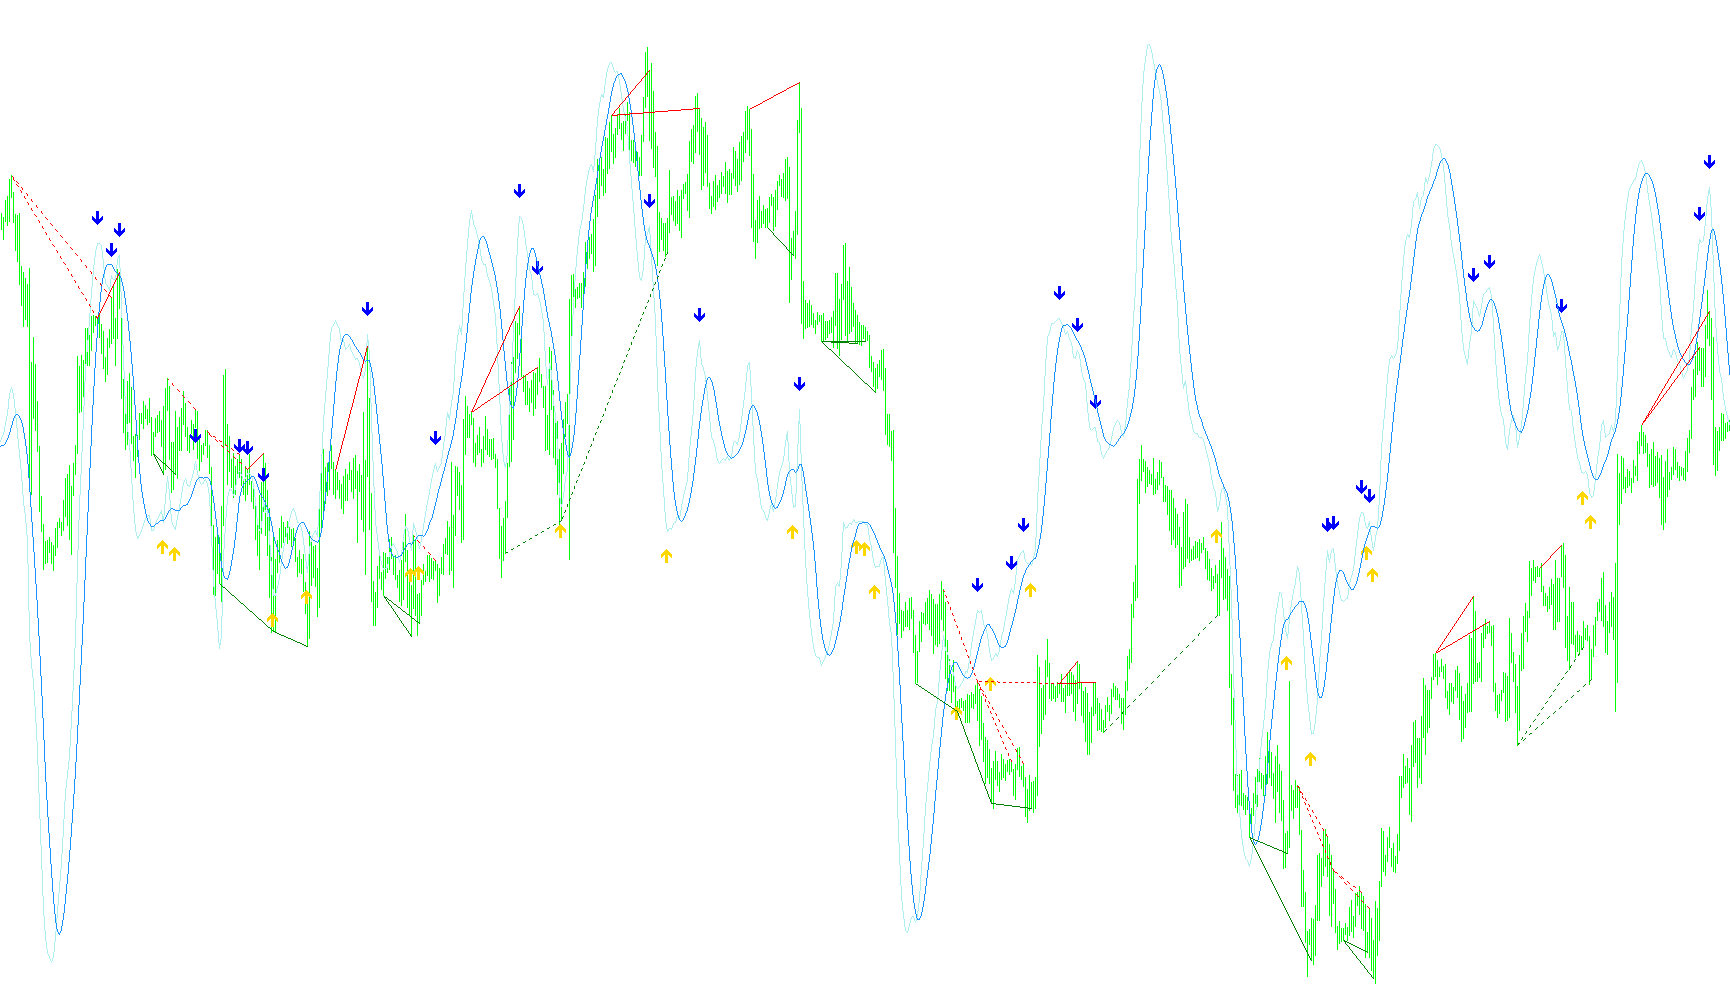
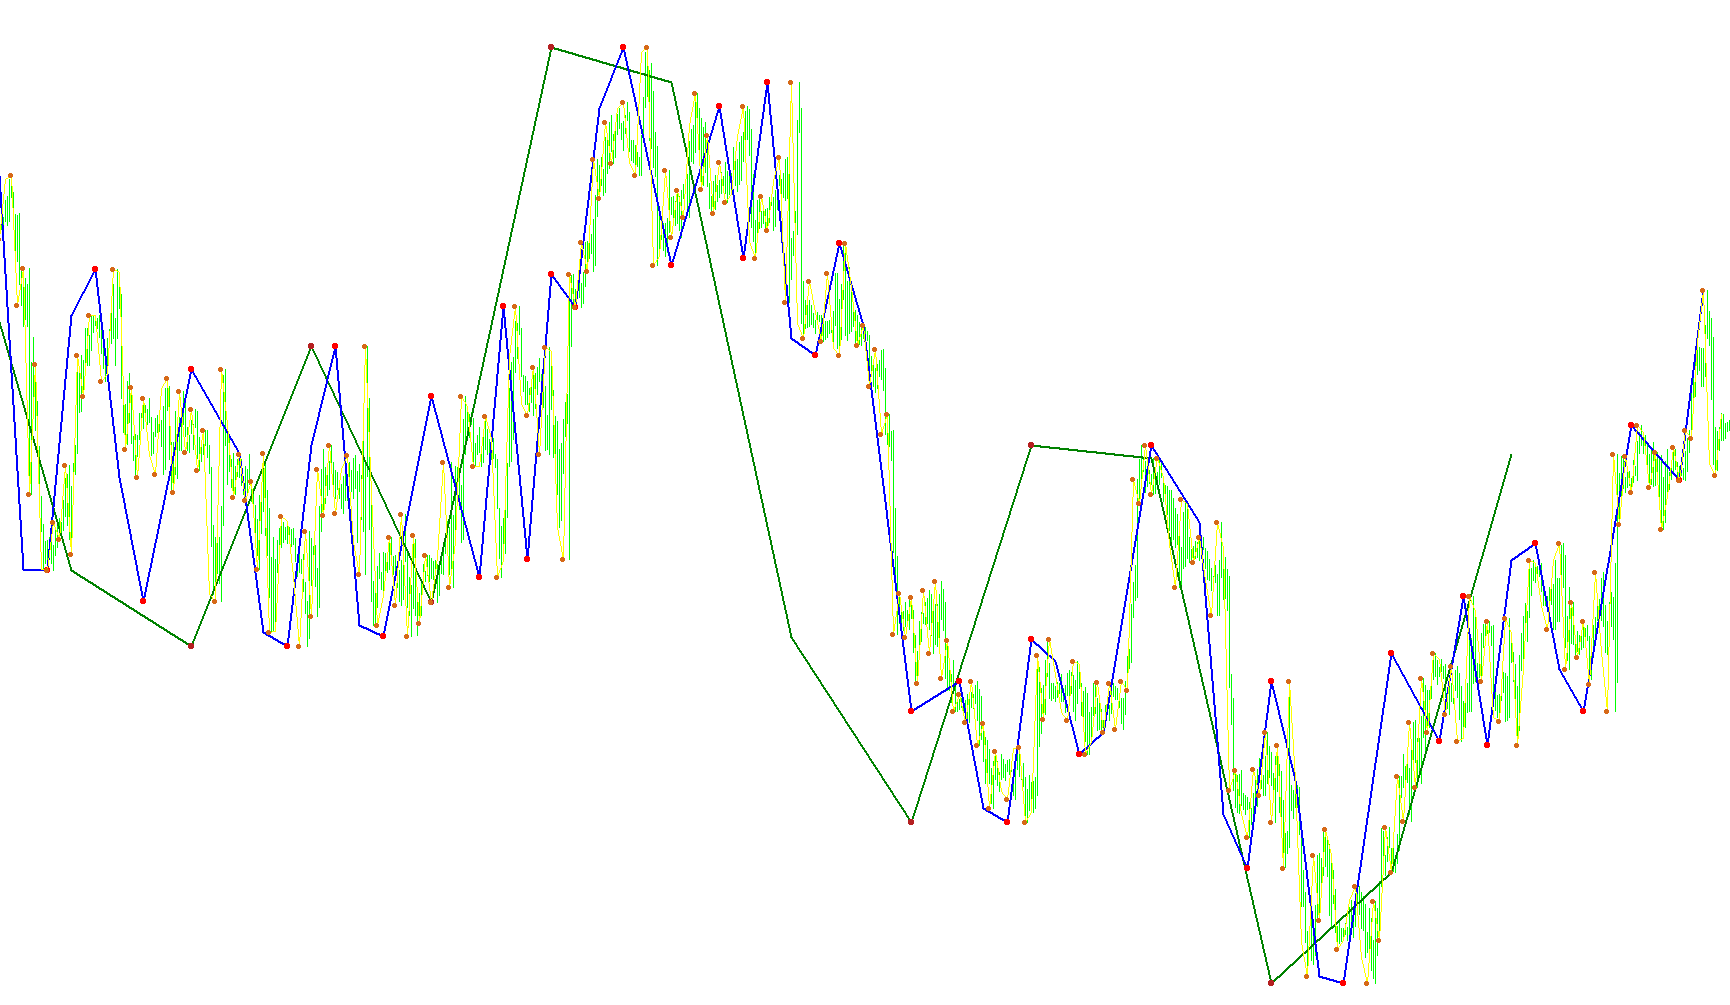
This indicator projects potential price targets and candle formations by calculating the midpoint deviation between short-term weighted averages and recent high-low volatility extremes.

FX Fish
Indicator

FX Fish

This indicator calculates a weighted price position relative to recent highs and lows, applying a logarithmic transformation to detect extreme momentum shifts and trend reversals.

FX Fish_v1
Indicator

FX Fish_v1

This indicator calculates a smoothed logarithmic momentum value based on the relative position of price within its high-low range to identify trend reversals and exhaustion.

FX Fish_v2
Indicator

FX Fish_v2

This indicator calculates a smoothed logarithmic transformation of price relative to high-low ranges to identify directional momentum reversals and trend exhaustion.

Indicator

FX Multi-Meter II

iMACDiMAiSARiStochastic
Indicator

FX Multi-Meter

iMACDiMAiSARiStochastic
FX Prime V2
Indicator

FX Prime V2

iCCIiADXiMAiRSI

This indicator identifies high-probability entry points by synchronizing EMA slope gradients with CCI momentum thresholds, RSI strength filters, and ADX trend confirmation.

Fx Sensor I_
Indicator

Fx Sensor I_

iCCI

This indicator synthesizes a modified T3 moving average smoothing filter over the Commodity Channel Index to identify momentum shifts and trend reversals.

FX Sniper's Chandelier
Indicator

FX Sniper's Chandelier

iATR

This indicator calculates a trend-following protective stop loss by dynamically adjusting price levels based on a recursive Chandelier Exit algorithm combined with Average True Range (ATR) volatility.

FX Sniper's Chandelier_v1
Indicator

FX Sniper's Chandelier_v1

iATR

This indicator calculates a trailing stop-loss level by dynamically adjusting price boundaries based on the Average True Range (ATR) and historical price extremes.

FX Sniper's Ergodic_CCI
Indicator

FX Sniper's Ergodic_CCI

iCCIiMAOnArray

This indicator synthesizes a custom momentum oscillator by calculating the ratio between smoothed absolute price changes and moving averages of those variances, overlaid against a standard CCI period.

FX Sniper's Ergodic_CCI_BB
Indicator

FX Sniper's Ergodic_CCI_BB

iCCI

This indicator identifies momentum extremes by overlaying Bollinger Bands onto the Commodity Channel Index to pinpoint price exhaustion and trend reversals.

FX Sniper's LSMA
Indicator

FX Sniper's LSMA

This indicator calculates a weighted moving average by applying increasing significance to more recent price data to identify trend direction through visual color transitions.

FX Sniper's MA
Indicator

FX Sniper's MA

iMA

This indicator identifies structural trend shifts by isolating discrete peak and trough coordinates from a moving average progression.

FX Sniper's MA2
Indicator

FX Sniper's MA2

iMA

Identifies momentum shifts by visualizing directional price changes relative to a moving average sequence.

FX Sniper's MACD Lines
Indicator

FX Sniper's MACD Lines

iMACD

This indicator calculates the absolute differential between the MACD main line and its signal line to quantify momentum velocity.

FX Sniper's MA[1]
Indicator

FX Sniper's MA[1]

iMA

This indicator isolates directional price momentum by visually mapping local maxima and minima shifts based on moving average slope inversions.

FX Sniper's MA_001
Indicator

FX Sniper's MA_001

iMA

This indicator tracks the directional velocity of a customizable moving average by toggling distinct visual buffers based on ascending or descending price trends.

FX Sniper's MA_002
Indicator

FX Sniper's MA_002

iMA

This indicator identifies price momentum shifts by bifurcating a moving average into two distinct visual streams based on sequential directional velocity.

FX Sniper's T3 CCI
Indicator

FX Sniper's T3 CCI

iCCI

This indicator applies a recursive T3 moving average filter to the Commodity Channel Index to reduce market noise and identify trend reversals via zero-line crossovers.

FX Sniper's T3 CCI_001
Indicator

FX Sniper's T3 CCI_001

iCCI

This indicator applies a Triple Exponential Smoothing (T3) filter to the Commodity Channel Index using Fibonacci-weighted coefficients to isolate underlying momentum trends.

FX Sniper's T3 CCI_002
Indicator

FX Sniper's T3 CCI_002

iCCI

This indicator applies a triple-smoothed moving average algorithm based on Fibonacci coefficients to the Commodity Channel Index (CCI) to filter out market noise and identify underlying momentum trends.

FX-ALLIGATOR
Indicator

FX-ALLIGATOR

iMA

The logic utilizes four distinct Smoothed Moving Averages with varying periods and shifts to map momentum, volatility, and price progression across different time horizons.

FX-AO
Indicator

FX-AO

iMA

This indicator visualizes the directional momentum of price action by calculating the difference between short and long simple moving averages based on median prices.

FX-AO_v1
Indicator

FX-AO_v1

iMAiMAOnArray

This indicator identifies bullish and bearish momentum shifts by calculating the differential between an SMMA-based MACD variant and its secondary smoothed signal line.

FX-BAR
Indicator

FX-BAR

iMA

This indicator identifies directional shifts by calculating the variance between extreme price points and Smoothed Moving Averages to detect momentum reversals.

FX-EVENTS
Indicator

FX-EVENTS

This indicator tracks real-time changes in trade positions by triggering alerts, sounds, and emails for order activations, modifications, deletions, and various exit conditions.

fx-trend
Indicator

fx-trend

This indicator synthesizes trend data from multiple timeframes and technical oscillators to calculate a weighted directional bias percentage.

FX-TREND_v1
Indicator

FX-TREND_v1

This indicator quantifies market bias by aggregating directional signals from a vast array of technical oscillators and moving averages across multiple timeframes to generate a unified percentage-based trend score.

Fx10Setup
Indicator

Fx10Setup

iMACDiMAiRSIiStochastic

This indicator identifies high-probability trend entries by requiring simultaneous alignment between moving average crossovers, RSI strength thresholds, Stochastic oscillator momentum, and MACD signal positioning.

Fx10Setup_RSI_Sto_Macd
Indicator

Fx10Setup_RSI_Sto_Macd

iMACDiMAiRSIiStochastic

This indicator identifies high-probability reversal points by synchronizing moving average crossovers with RSI threshold breaches, Stochastic momentum alignment, and MACD signal positioning.

Fx10Setup_v1
Indicator

Fx10Setup_v1

iMACDiMAiRSIiStochastic

This indicator identifies high-probability trend reversals by synchronizing LWMA/SMA crossovers with specific RSI thresholds, Stochastic signal positioning, and MACD main-to-signal alignment.

Fx10Setup_v2
Indicator

Fx10Setup_v2

iMACDiMAiRSIiStochastic

This indicator identifies high-probability reversal or continuation points by synchronizing Moving Average crossovers with RSI thresholds, Stochastic oscillator momentum, and MACD signal line positioning.
FX5_Divergence_v1-1_realtime[1]
Indicator

FX5_Divergence_v1-1_realtime[1]

iMAiMAOnArray

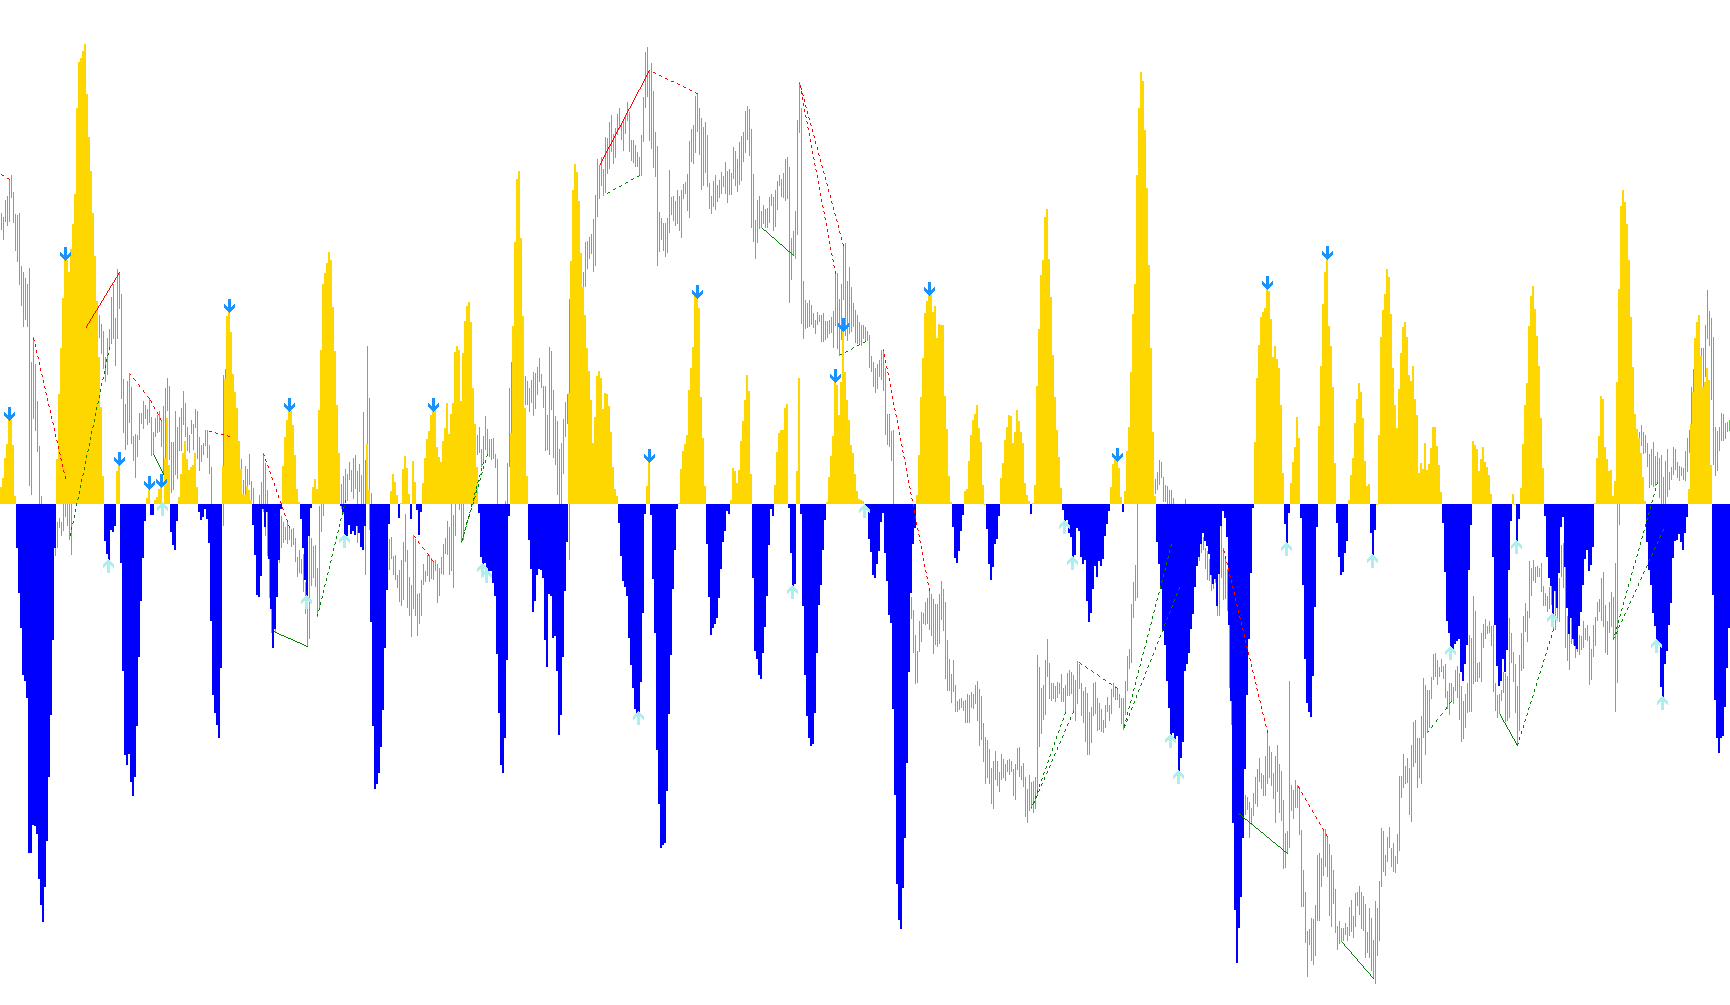
This indicator identifies bullish and bearish trend reversals by detecting discrepancies between price action extremes and the momentum oscillations of a smoothed MACD-based oscillator.

FX5_Divergence_v1.1
Indicator

FX5_Divergence_v1.1

iMAiMAOnArray

This indicator identifies trend exhaustion by detecting price-momentum asymmetries between market peaks and the OsMA oscillator values.

FX5_Divergence_v1.1_v1
Indicator

FX5_Divergence_v1.1_v1

iMAiMAOnArray

This indicator identifies structural market exhaustion by detecting discrepancies between price action peaks and the momentum oscillations of the Optimized Signal Moving Average.

FX5_Divergence_v1.5
Indicator

FX5_Divergence_v1.5

iMAiMAOnArray

This indicator identifies price-momentum discrepancies by comparing price extremes against the Oscillator of Moving Average (OsMA) to signal classic and hidden reversal patterns.

FX5_Divergence_v1.5[1]
Indicator

FX5_Divergence_v1.5[1]

iMAiMAOnArray

This indicator identifies momentum shifts by detecting discrepancies between price action extremes and the Oscillating Moving Average (OsMA) values to highlight classic, hidden, and reverse divergence patterns.

FX5_Divergence_v1[1]-1.5
Indicator

FX5_Divergence_v1[1]-1.5

iMAiMAOnArray

This indicator identifies bullish and bearish momentum shifts by detecting discrepancies between price action extremes and the OsMA (Oscillator Moving Average) peaks and troughs.

FX5_Divergence_V2.0
Indicator

FX5_Divergence_V2.0

iOsMA
FX5_Divergence_V2.1
Indicator

FX5_Divergence_V2.1

iOsMA
FX5_FiboSpiralScript_v1[1].0
Indicator

FX5_FiboSpiralScript_v1[1].0

This script projects a dynamic logarithmic golden spiral onto the price chart using polar coordinate transformations and Fibonacci growth constants.

FX5_MACD_Correct
Indicator

FX5_MACD_Correct

iMAiMAOnArray

This indicator identifies bullish and bearish divergence by comparing price extremes against a custom-weighted MACD Oscillator (OsMA) to detect momentum exhaustion.

FX5_MACD_Correct_a
Indicator

FX5_MACD_Correct_a

iMAiMAOnArray

This indicator identifies classic and hidden bullish/bearish divergences by comparing price extremes against a custom-weighted MACD oscillator's peaks and troughs.

FX5_MACD_Divergence_V1.0
Indicator

FX5_MACD_Divergence_V1.0

iMACD

This indicator identifies classical and hidden bullish or bearish divergences by comparing momentum shifts in the MACD histogram against price action extremes, visualizing structural trend reversals with automated geometric trendlines.

FX5_MACD_Divergence_V1.1
Indicator

FX5_MACD_Divergence_V1.1

iMACD

This tool identifies classical and hidden bullish/bearish divergences by comparing price extremes against MACD peak fluctuations and projects automated trendlines for visual confirmation.

FX5_MACD_MetaTrader
Indicator

FX5_MACD_MetaTrader

iMACDiMA

This indicator identifies classic and hidden bullish/bearish divergences by comparing price momentum shifts against MACD OsMA peak and trough oscillations.

FX5_NeelyElliotWave_v1.2
Indicator

FX5_NeelyElliotWave_v1.2

This indicator dynamically maps and visualizes nested price structures by identifying high-level swing points across monthly, weekly, daily, and quarter-daily intervals.

FX5_SelfAdjustingRSI_v1.0[1]
Indicator

FX5_SelfAdjustingRSI_v1.0[1]

iRSIiStdDevOnArray

This indicator calculates Relative Strength Index levels that dynamically expand and contract based on smoothed price deviation or standard deviation metrics.

FX5_SelfAdjustingRSI_v1.0[1]_v1
Indicator

FX5_SelfAdjustingRSI_v1.0[1]_v1

iRSIiStdDevOnArray

This indicator calculates relative strength by generating adaptive overbought and oversold thresholds based on moving average smoothing or standard deviation of price oscillations.