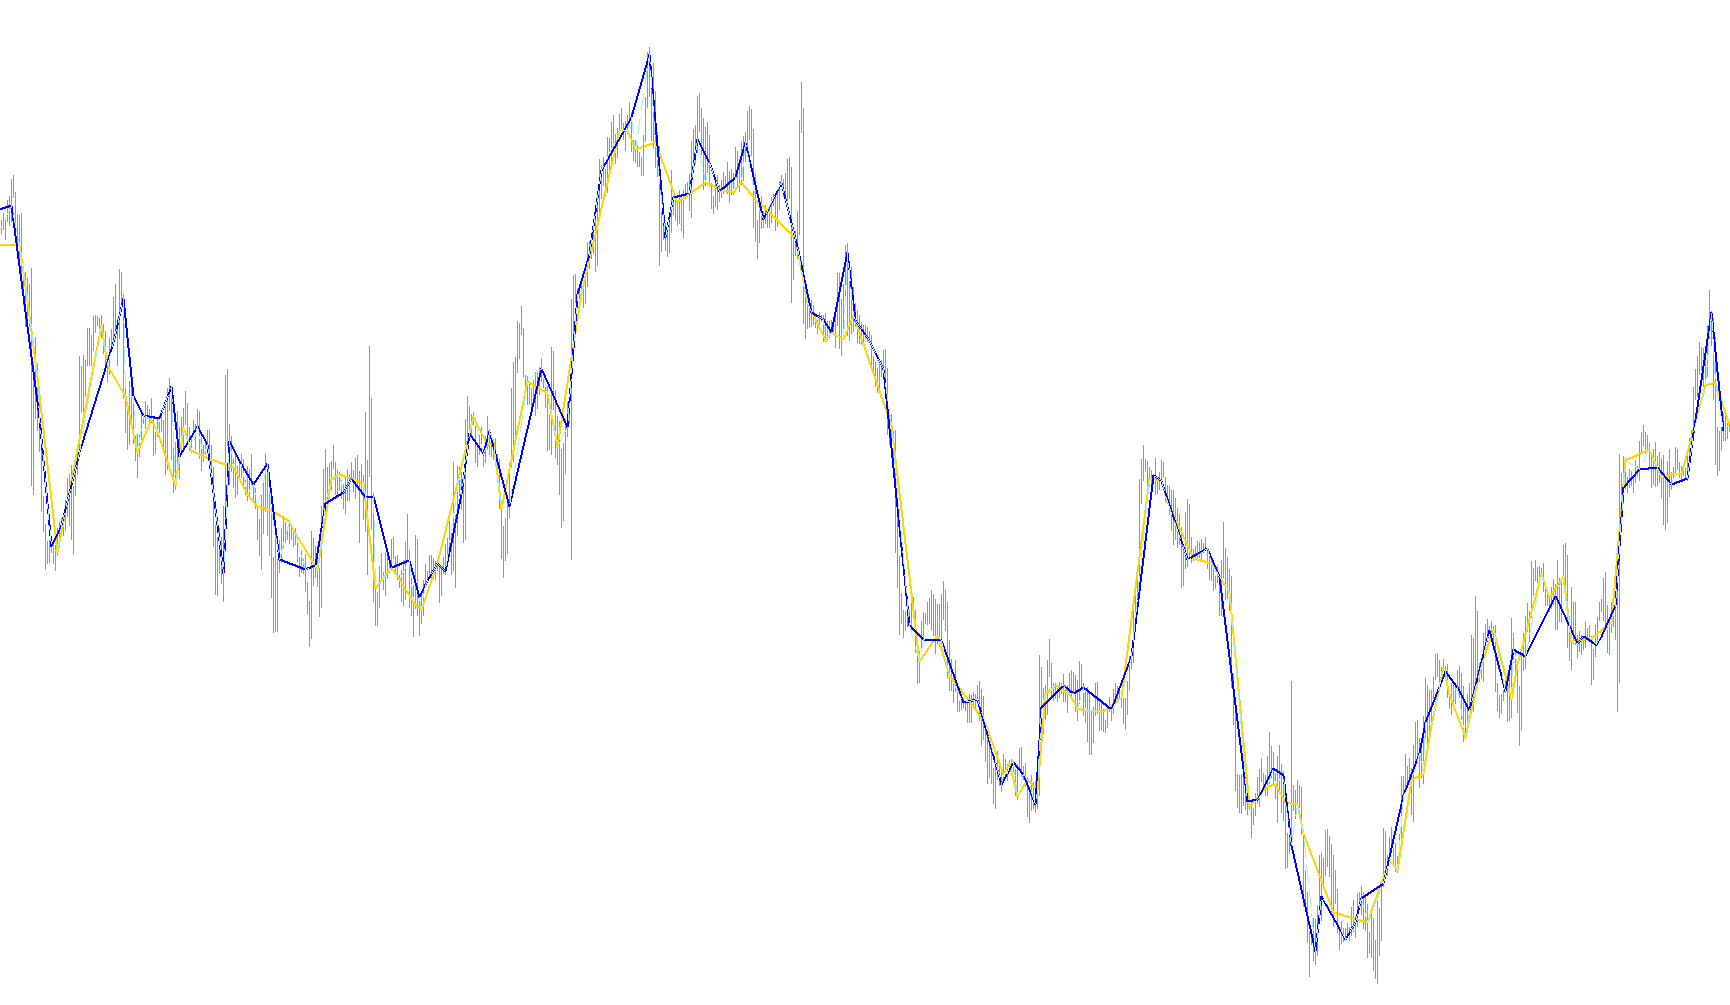
This script is designed as a visual trading tool for the MetaTrader platform, specifically engineered to identify key structural points in price movement. Its primary goal is to highlight specific "fractal" formations—peaks and valleys—that signify potential turning points or zones of interest in the market.
Core Logic Overview
The tool scans historical price data to detect specific price patterns based on a five-bar window. By analyzing the relationship between a central bar and its immediate neighbors, it identifies local highs and lows.
When the script detects these formations, it marks three distinct layers of information on your chart:
- Upward Range Detection (Highs): The logic looks for instances where a specific high point is higher than the bars immediately preceding and following it. When this "peak" is confirmed, the tool identifies it as an upward fractal.
- Downward Range Detection (Lows): Conversely, the script scans for "valleys"—points where a specific low is lower than its neighboring bars. These are identified as downward fractals.
- Middle Range Integration: The script also tracks a "Middle" value. Every time an upward or downward fractal is confirmed, it captures the opening price of that specific bar to provide a consistent reference point for the trading range.
Visual Representation
To make this data actionable for a trader, the script translates these mathematical findings into visual elements on the chart:
- Up Diapazon: Represents the upper boundaries identified by the peak logic.
- Down Diapazon: Represents the lower boundaries identified by the valley logic.
- Middle Diapazon: A dashed reference line that highlights the specific price levels where these fractal breakouts occurred, helping to visualize the "meat" of the price action.
How it Works in Practice
Instead of reacting to every minor wiggle in the market, this script filters out noise by requiring a specific geometric structure (the 5-bar fractal). Only when the price creates a distinct "V" or "inverted V" shape does the indicator trigger a visual marking. This allows traders to see the structural backbone of the market, helping them identify support and resistance zones more clearly based on historical price extremes.
//+------------------------------------------------------------------+
//|                                             Fractals5+Signal.mq4 |
//+------------------------------------------------------------------+
#property copyright "© Maloma"

#property indicator_chart_window
#property indicator_buffers 3
#property indicator_color1 Magenta
#property indicator_color2 Teal
#property indicator_color3 GreenYellow
//---- input parameters

//---- buffers
double UpDiapazonBuffer[];
double DnDiapazonBuffer[];
double MdDiapazonBuffer[];
//+------------------------------------------------------------------+
//| Custom indicator initialization function                         |
//+------------------------------------------------------------------+
int init()
  {
//---- indicator buffers mapping
    SetIndexBuffer(0,UpDiapazonBuffer);
    SetIndexBuffer(1,DnDiapazonBuffer);
    SetIndexBuffer(2,MdDiapazonBuffer);
//---- drawing settings
    SetIndexStyle(0,DRAW_SECTION,EMPTY,2);
    SetIndexStyle(1,DRAW_SECTION,EMPTY,2);
    SetIndexStyle(2,DRAW_SECTION,STYLE_DASH);
//----
    SetIndexEmptyValue(0,0.0);
    SetIndexEmptyValue(1,0.0);
    SetIndexEmptyValue(2,0.0);
//---- name for DataWindow
    SetIndexLabel(0,"Diapazon Up");
    SetIndexLabel(1,"Diapazon Down");
    SetIndexLabel(2,"Diapazon Middle");
//---- initialization done
    IndicatorShortName("F5-Diapazon");
   return(0);
  }
//+------------------------------------------------------------------+
//| Custor indicator deinitialization function                       |
//+------------------------------------------------------------------+
int deinit()
  {
//---- TODO: add your code here

//----
   return(0);
  }
//+------------------------------------------------------------------+
//| Custom indicator iteration function                              |
//+------------------------------------------------------------------+
int start()
  {
    int i,j,nCountedBars;
    nCountedBars=IndicatorCounted();
//---- check for possible errors
    if(nCountedBars<0 || Bars<5) return(-1);
//----
      i=Bars-nCountedBars-1;
    while(i>=0)
     {
//----Up and Down Fractals
//----5 bars Fractal
          if(High[i+3]>High[i+4] && High[i+3]>High[i+5] && High[i+3]>High[i+2] && High[i+3]>High[i+1])
            {
             UpDiapazonBuffer[i]= Open[i];
             MdDiapazonBuffer[i]= Open[i];
            }
          if(Low[i+3]<Low[i+4] && Low[i+3]<Low[i+5] && Low[i+3]<Low[i+2] && Low[i+3]<Low[i+1])
            {
              DnDiapazonBuffer[i]= Open[i];
              MdDiapazonBuffer[i]= Open[i];
            }
      i--;
     }

//----
   return(0);
  }
//+------------------------------------------------------------------+
Comments