FractalChannel
Download script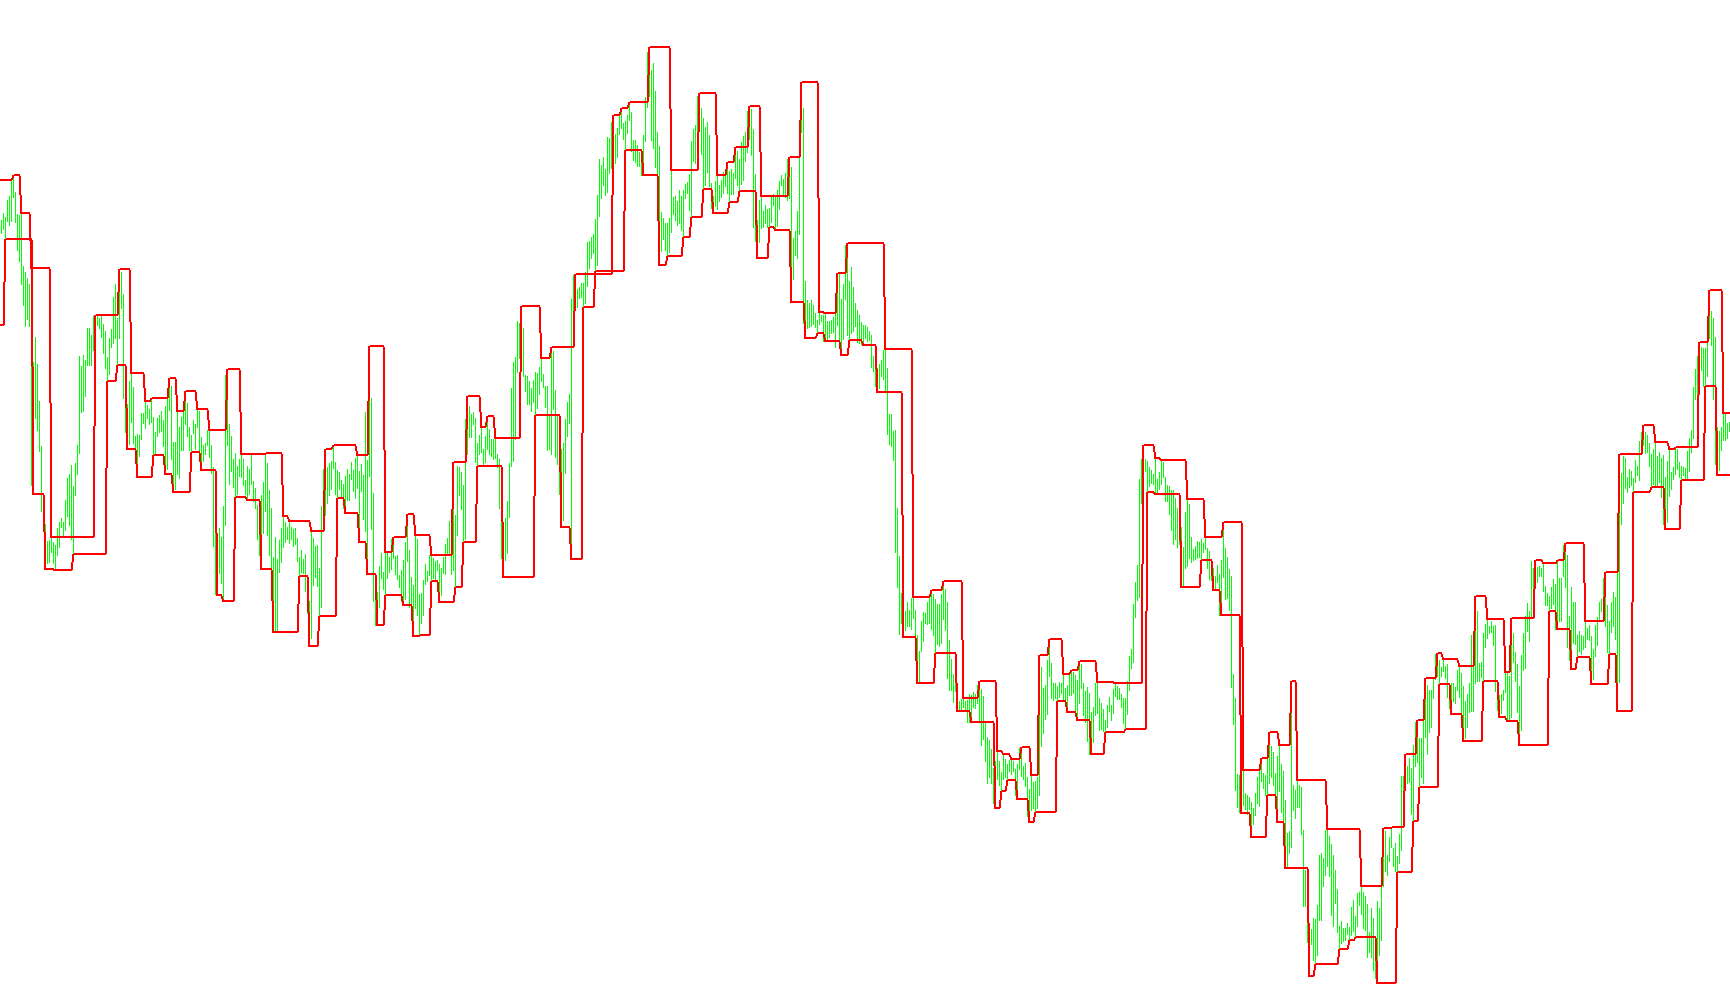
This tool is designed to provide visual clarity on a trading chart by identifying and mapping out significant price boundaries, specifically focusing on "Resistance" and "Support" levels. Instead of showing every minor price fluctuation, it filters the data to highlight major structural turning points in the market.
How the Logic Works
Identifying Key Turning Points The script utilizes a mathematical concept known as "Fractals." In trading terms, a fractal represents a peak or a valley—a point where the price reverses direction. The logic specifically looks for:
- Upper Fractals: These are the local "ceilings" or peaks where the price reached a high point before pulling back.
- Lower Fractals: These are the local "floors" or valleys where the price reached a low point before bouncing back up.
Mapping the Boundaries The script processes the historical price data from the oldest candle to the most recent one, performing the following actions at each step:
- Resistance Tracking (The Ceiling): Whenever the logic detects an Upper Fractal, it captures that specific high price and marks it as a resistance level. If no new fractal is detected at a certain point, the script "carries over" the previous resistance value. This creates a continuous horizontal line that stays at the highest established peak until a new, higher peak is formed.
- Support Tracking (The Floor): Similarly, the logic looks for Lower Fractals to identify support levels. When a valley is found, it captures that price point. Just like with the resistance, it maintains this level as a continuous line until the market creates a new significant low.
Visual Output
On your chart, this results in two distinct red lines:
- The Resistance Line: Represents the "ceiling" of the current price action. It shows you where the price has struggled to break through in the past.
- The Support Line: Represents the "floor" of the current price action. It shows you where the price has historically found a base to bounce from.
By connecting these points, the script creates a visual "channel." This allows traders to see the corridor in which the price is currently moving, helping to identify whether the market is trending between two established boundaries or if it is approaching a significant zone of potential reversal.
//+------------------------------------------------------------------+
//|                Fractal Channel                                   |
//|                Copyright © 2005  Chris Battles                   |
//|                cbattles@neo.rr.com                               |
//+------------------------------------------------------------------+
#property copyright "Chris Battles"
#property link      "mailto:cbattles@neo.rr.com"

#property indicator_chart_window
#property indicator_buffers 2
#property indicator_color1 Red
#property indicator_color2 Red

//---- buffers
double v1[];
double v2[];
double val1;
double val2;
int i;

int init(){
   IndicatorBuffers(2);
//---- drawing settings
   SetIndexArrow(0, 119);
   SetIndexArrow(1, 119);

   SetIndexStyle(0,DRAW_LINE,STYLE_SOLID,2,Red);
   SetIndexDrawBegin(0,i-1);
   SetIndexBuffer(0, v1);
   SetIndexLabel(0,"Resistance");

   SetIndexStyle(1,DRAW_LINE,STYLE_SOLID,2,Red);
   SetIndexDrawBegin(1,i-1);
   SetIndexBuffer(1, v2);
   SetIndexLabel(1,"Support");

   return(0);
}

int start(){
   i=Bars;
   while(i>=0){
      val1 = iFractals(NULL, 0, MODE_UPPER,i);
      if (val1 > 0)
         v1[i]=High[i];
      else
         v1[i] = v1[i+1];

      val2 = iFractals(NULL, 0, MODE_LOWER,i);
      if (val2 > 0)
         v2[i]=Low[i];
      else
         v2[i] = v2[i+1];

      i--;
   }
   return(0);
}

//+------------------------------------------------------------------+
Comments