FoxPivot
Download script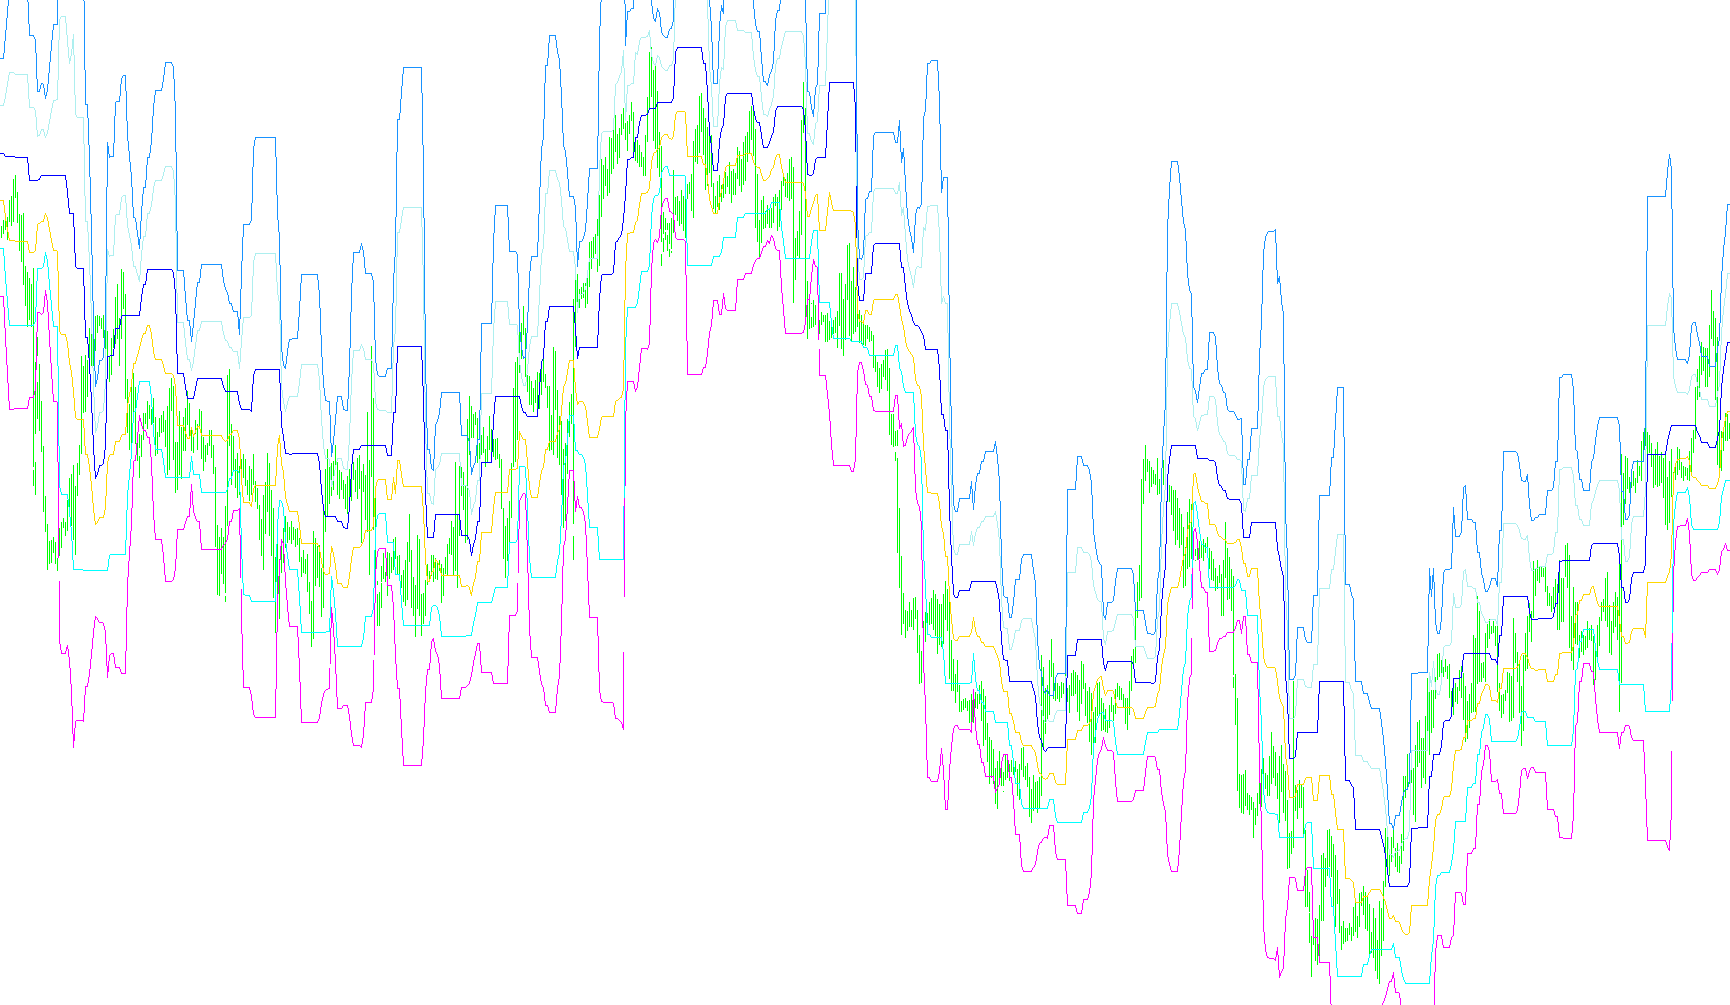
The FoxPivot indicator is designed to provide visual market structure analysis by identifying key price levels and potential pivot points on a trading chart. Rather than relying on a single moving average, this tool analyzes price extremes—specifically the highest highs and lowest lows—over a specific period to map out zones of interest.
How the Logic Works
The indicator functions by looking at a user-defined "Lookback Window" (determined by the length settings). For every point in time on the chart, the script performs the following steps:
- Identifying Extremes: It scans the recent price history to find the highest price reached and the lowest price dropped during that specific timeframe.
- Calculating the Core Pivot: It takes these two extremes and calculates the exact midpoint between them. This midpoint represents the "center of gravity" for that price action period.
- Projecting Market Boundaries: Using that central midpoint as an anchor, the script then projects out seven distinct mathematical levels. These levels are calculated by adding or subtracting various multiples of the distance between the high and the low.
Visual Representation
The result is a series of plotted lines on your chart that expand outward from the central pivot point. These lines act as dynamic boundaries:
- Core Support and Resistance: By visualizing where these projected levels land, traders can better identify areas where price has historically struggled to break through or has consistently bounced back from.
- Volatility Mapping: Because the distance between the lines is based on the difference between the high and low of the lookback period, the "spread" of the lines will automatically widen during periods of high market volatility and tighten during stable, consolidating markets.
Summary for Traders
Essentially, FoxPivot transforms raw price data into a geometric map. It helps you visualize where the "balance" of the market sits and provides a framework of potential support and resistance levels based on the most recent price extremes, helping you anticipate where the next major price reaction might occur.
//+------------------------------------------------------------------+
//|                                                     FoxPivot.mq4 |
//|                                        Copyright © 2006, Fox Rex |
//|                                                                  |
//+------------------------------------------------------------------+
#property copyright "Copyright © 2006, Fox Rex"
#property link      ""
//----
#property indicator_chart_window
#property indicator_buffers 7
#property indicator_color1 Yellow
#property indicator_color2 MediumBlue
#property indicator_color3 MediumBlue
#property indicator_color4 MediumBlue
#property indicator_color5 Red
#property indicator_color6 Red
#property indicator_color7 Red
//---- input parameters
extern int       Leght=13;
extern int       Shift=13;
//---- buffers
double ExtMapBuffer1[];
double ExtMapBuffer2[];
double ExtMapBuffer3[];
double ExtMapBuffer4[];
double ExtMapBuffer5[];
double ExtMapBuffer6[];
double ExtMapBuffer7[];
//+------------------------------------------------------------------+
//| Custom indicator initialization function                         |
//+------------------------------------------------------------------+
int init()
  {
//---- indicators
   SetIndexStyle(0,DRAW_LINE);
   SetIndexBuffer(0,ExtMapBuffer1);
   SetIndexStyle(1,DRAW_LINE);
   SetIndexBuffer(1,ExtMapBuffer2);
   SetIndexStyle(2,DRAW_LINE);
   SetIndexBuffer(2,ExtMapBuffer3);
   SetIndexStyle(3,DRAW_LINE);
   SetIndexBuffer(3,ExtMapBuffer4);
   SetIndexStyle(4,DRAW_LINE);
   SetIndexBuffer(4,ExtMapBuffer5);
   SetIndexStyle(5,DRAW_LINE);
   SetIndexBuffer(5,ExtMapBuffer6);
   SetIndexStyle(6,DRAW_LINE);
   SetIndexBuffer(6,ExtMapBuffer7);
   SetIndexShift(0,Shift);
   SetIndexShift(1,Shift);
   SetIndexShift(2,Shift);
   SetIndexShift(3,Shift);
   SetIndexShift(4,Shift);
   SetIndexShift(5,Shift);
   SetIndexShift(6,Shift);
//----
   return(0);
  }
//+------------------------------------------------------------------+
//| Custom indicator deinitialization function                       |
//+------------------------------------------------------------------+
int deinit()
  {
//----
//----
   return(0);
  }
//+------------------------------------------------------------------+
//| Custom indicator iteration function                              |
//+------------------------------------------------------------------+
int start()
  {
//----
   int limit;
   double Max,Min;
   int counted_bars=IndicatorCounted();
//---- check for possible errors
   if(counted_bars<0) return(-1);
//---- last counted bar will be recounted
   if(counted_bars>0) counted_bars--;
   limit=Bars-counted_bars;
//---- macd counted in the 1-st buffer
   for(int i=0; i<limit; i++)
     {
      Max=High[Highest(Symbol(),0,MODE_HIGH,Leght,i)];
      Min=Low[Lowest(Symbol(),0,MODE_LOW,Leght,i)];
      ExtMapBuffer1[i]=(Max+Min)/2;
      ExtMapBuffer2[i]=2*ExtMapBuffer1[i]-Min;
      ExtMapBuffer3[i]=ExtMapBuffer1[i]+(Max-Min);
      ExtMapBuffer4[i]=2*ExtMapBuffer1[i]+(Max-Min*2);
      ExtMapBuffer5[i]=2*ExtMapBuffer1[i]-Max;
      ExtMapBuffer6[i]=ExtMapBuffer1[i]-(Max-Min);
      ExtMapBuffer7[i]=2*ExtMapBuffer1[i]-(Max*2-Min);
     }
//----
   return(0);
  }
//+------------------------------------------------------------------+
Comments